| Param | Original file | Final file |
|---|---|---|
| Filename | modeM0/AS1A12_068T02_9000005564_40753cztM0_level2.fits | modeM0/AS1A12_068T02_9000005564_40753cztM0_level2_quad_clean.evt |
| Size (bytes) | 378,967,680 | 79,643,520 |
| Size | 361.4 MB | 76.0 MB |
| Events in quadrant A | 2,742,399 | 559,110 |
| Events in quadrant B | 2,677,297 | 571,056 |
| Events in quadrant C | 5,377,216 | 502,688 |
| Events in quadrant D | 2,834,986 | 422,330 |
| Mode M0 | |||
|---|---|---|---|
| Quadrant | BADHDUFLAG | Total packets | Discarded packets |
| A | 0 | 11067 | 3 |
| B | 0 | 11464 | 2 |
| C | 0 | 19503 | 2 |
| D | 0 | 12090 | 2 |
| Mode SS | |||
|---|---|---|---|
| Quadrant | BADHDUFLAG | Total packets | Discarded packets |
| A | 0 | 104 | 0 |
| B | 0 | 104 | 0 |
| C | 0 | 104 | 0 |
| D | 0 | 104 | 0 |
| Mode M9 | |||
|---|---|---|---|
| Quadrant | BADHDUFLAG | Total packets | Discarded packets |
| A | 0 | 23 | 0 |
| B | 0 | 23 | 0 |
| C | 0 | 23 | 0 |
| D | 0 | 24 | 0 |
| Quadrant | Total seconds | Saturated seconds | Saturation percentage |
|---|---|---|---|
| A | 5082 | 10 | 0.196773% |
| B | 5082 | 124 | 2.439984% |
| C | 5082 | 645 | 12.691854% |
| D | 5082 | 938 | 18.457300% |
Noise dominated data is calculated using 1-second bins in cleaned event files. If a bin has >2000 counts, and if more than 50% of those come from <1% of pixels, then it is considered to be noise-dominated and hence unusable.
| Quadrant | # 1 sec bins | Bins with >0 counts | Bins with >2000 counts | High rate bins dominated by noise | Noise dominated (total time) | Noise dominated (detector-on time) | Marked lightcurve |
|---|---|---|---|---|---|---|---|
| A | 6996 | 5083 | 4 | 4 | 0.06% | 0.08% |  |
| B | 6996 | 5083 | 85 | 85 | 1.21% | 1.67% | 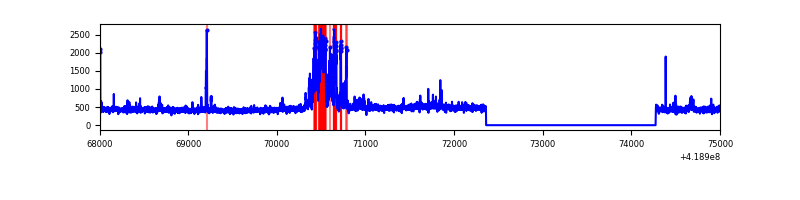 |
| C | 6995 | 5082 | 680 | 680 | 9.72% | 13.38% |  |
| D | 6996 | 5083 | 47 | 47 | 0.67% | 0.92% | 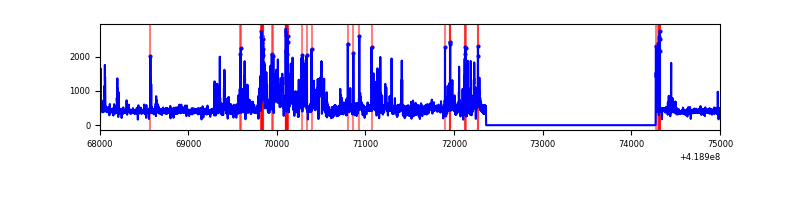 |
Top three noisy pixels from each quadrant. If the there are fewer than three noisy pixels in the level2.evt file, extra rows are filled as -1
| Pixel properties | Quadrant properties | ||||||
|---|---|---|---|---|---|---|---|
| Quadrant | DetID | PixID | Counts | Sigma | Mean | Median | Sigma |
| A | 10 | 83 | 461498 | 3966.85 | 564 | 552 | 116.2 |
| A | 6 | 10 | 58110 | 495.34 | 564 | 552 | 116.2 |
| A | 12 | 189 | 25267 | 212.69 | 564 | 552 | 116.2 |
| B | 0 | 229 | 423705 | 3880.86 | 556 | 540 | 109.0 |
| B | 4 | 171 | 32701 | 294.95 | 556 | 540 | 109.0 |
| B | 4 | 81 | 22190 | 198.55 | 556 | 540 | 109.0 |
| C | 9 | 187 | 2976183 | 24363.92 | 522 | 525 | 122.1 |
| C | 15 | 214 | 212142 | 1732.67 | 522 | 525 | 122.1 |
| C | 0 | 10 | 120203 | 979.89 | 522 | 525 | 122.1 |
| D | 13 | 249 | 261911 | 2156.73 | 490 | 476 | 121.2 |
| D | 12 | 191 | 205295 | 1689.67 | 490 | 476 | 121.2 |
| D | 2 | 249 | 117635 | 966.51 | 490 | 476 | 121.2 |
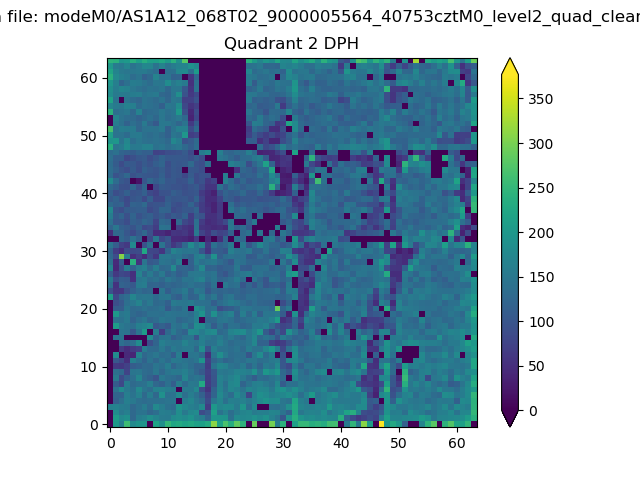
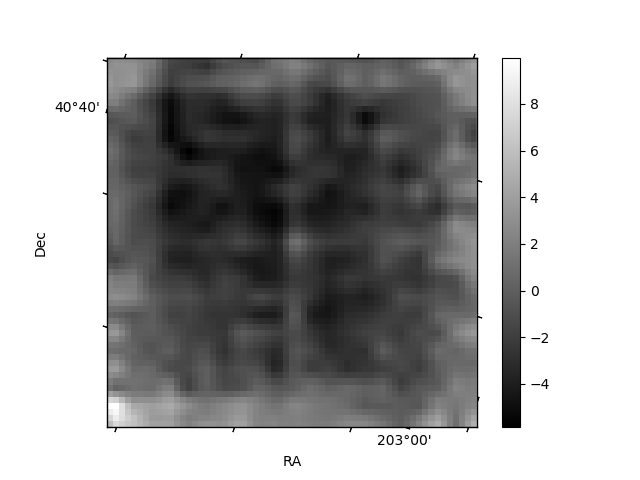
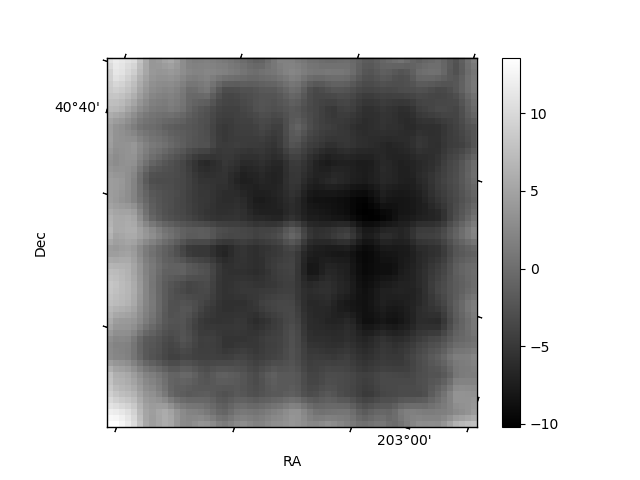
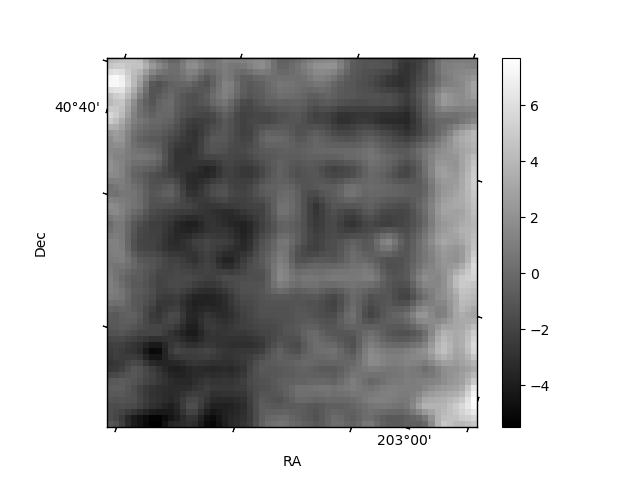
Histogram calculated using DETX and DETY for each event in the final _common_clean file
| Quadrant A | 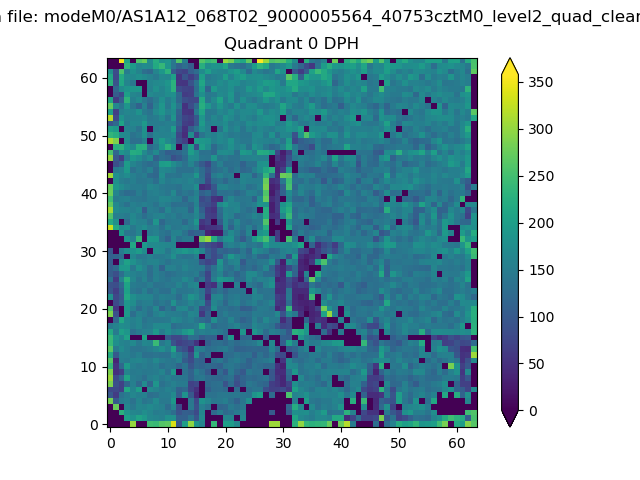 |
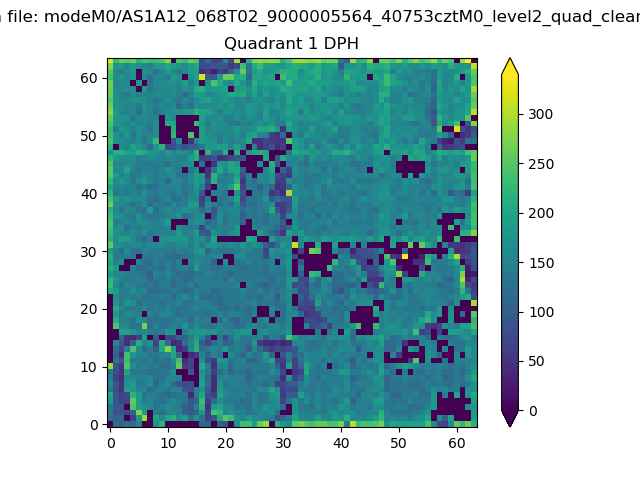 |
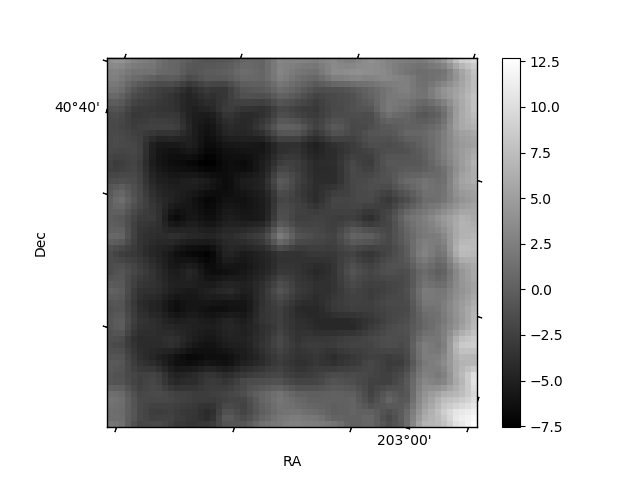
Quadrant B |
|---|---|---|---|
| Quadrant D | 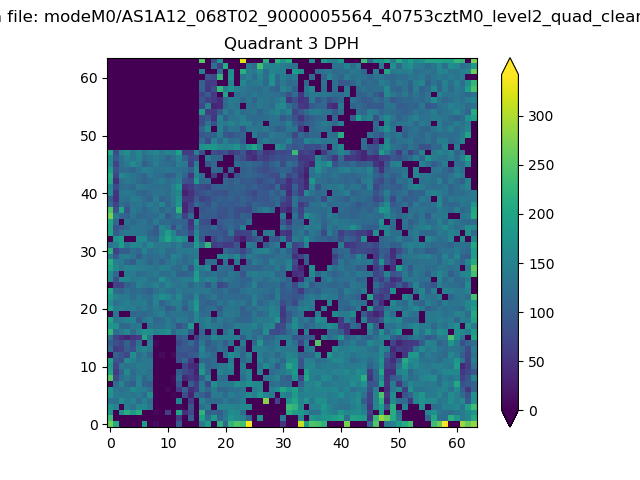 |
 |
Quadrant C |
| Plot type | Count rate plots | Images |
|---|---|---|
| Comparison with Poisson distribution Blue bars denote a histogram of data divided into 1 sec bins. Red curve is a Poisson curve with rate = median count rate of data. |
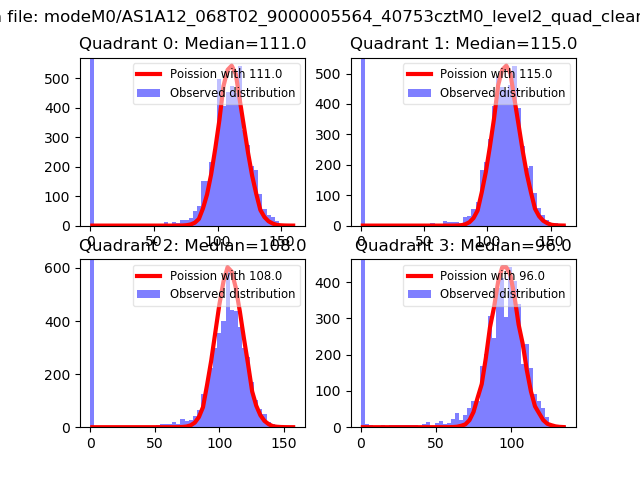 |
 |
| Quadrant-wise count rates Data is divided into 100 sec bins |
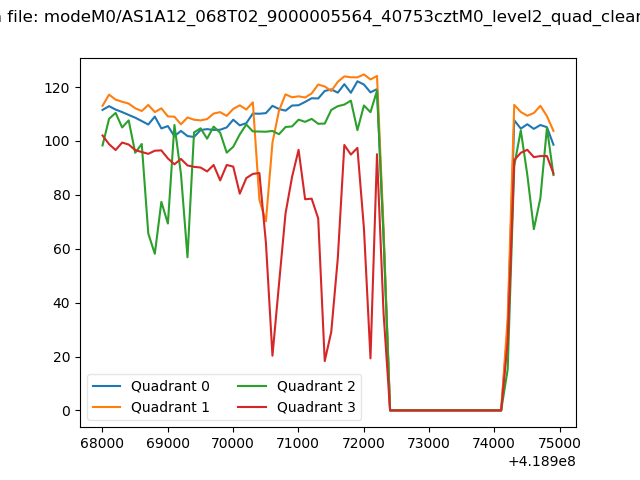 |
|
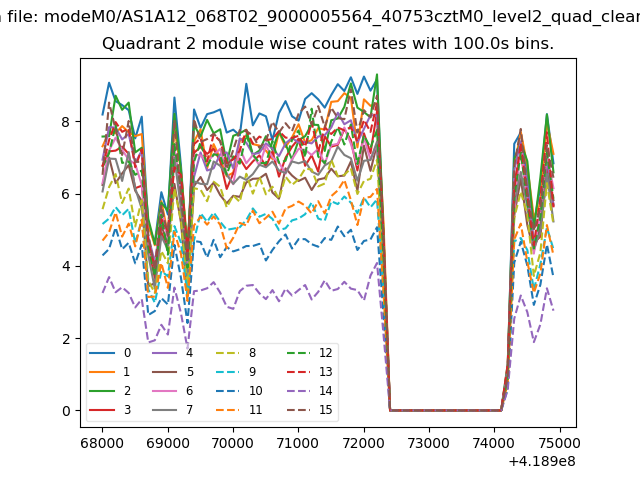
| Module-wise count rates for Quadrant A Data is divided into 100 sec bins |
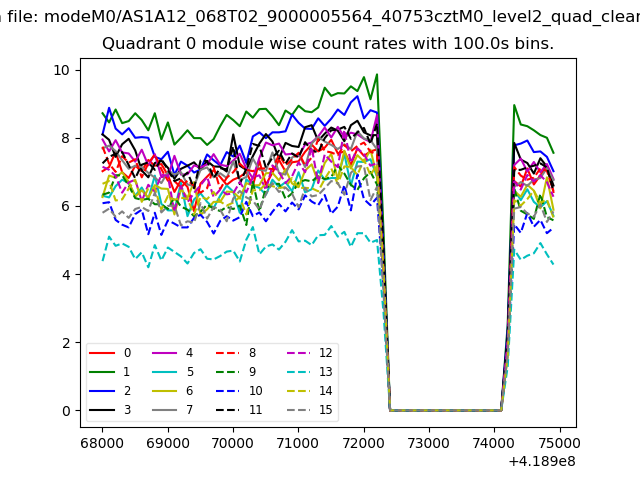 |
 |
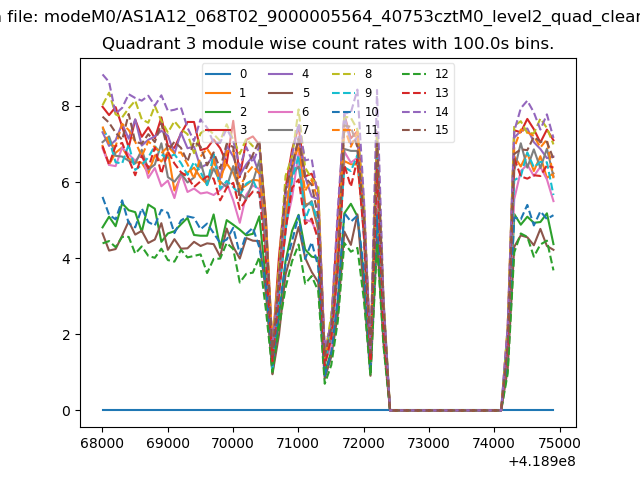
| Module-wise count rates for Quadrant B Data is divided into 100 sec bins |
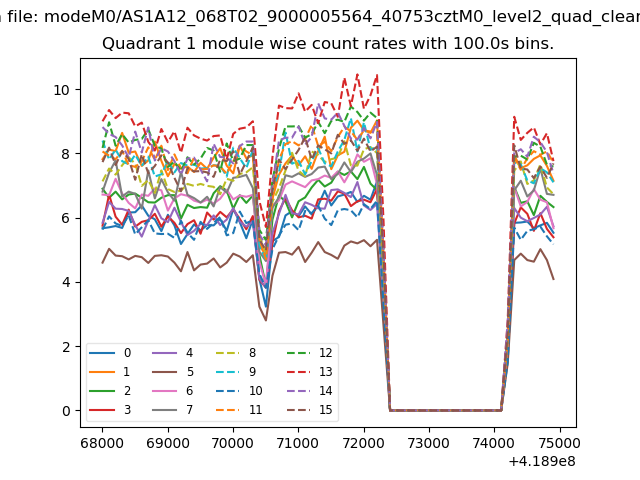 |
 |
| Module-wise count rates for Quadrant C Data is divided into 100 sec bins |
 |
 |
| Module-wise count rates for Quadrant D Data is divided into 100 sec bins |
 |
 |
| Parameter | Plot |
|---|---|
| CZT HV Monitor | 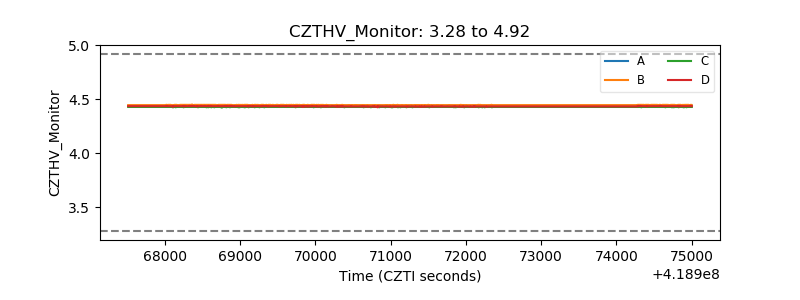 |
| D_VDD | 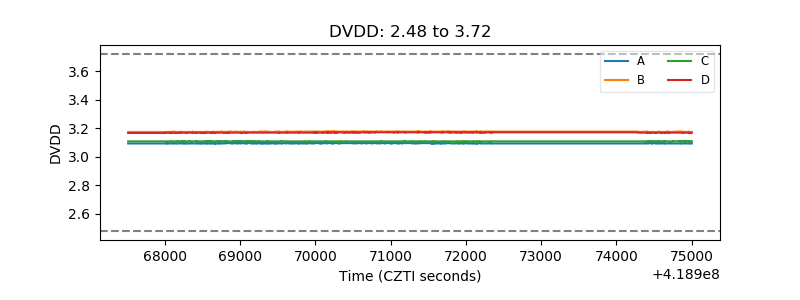 |
| Temperature 1 | 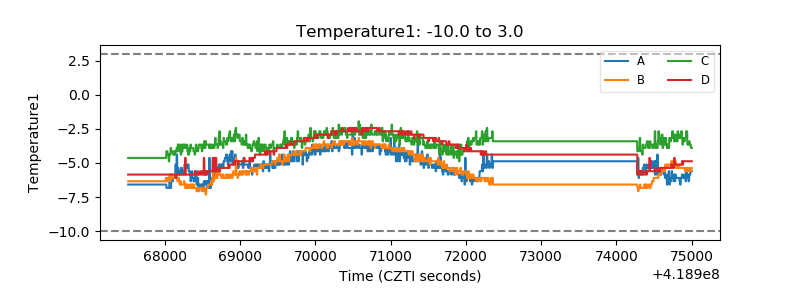 |
| Veto HV Monitor | 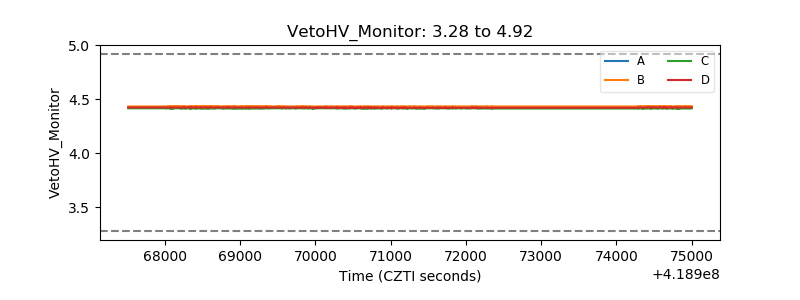 |
| Veto LLD | 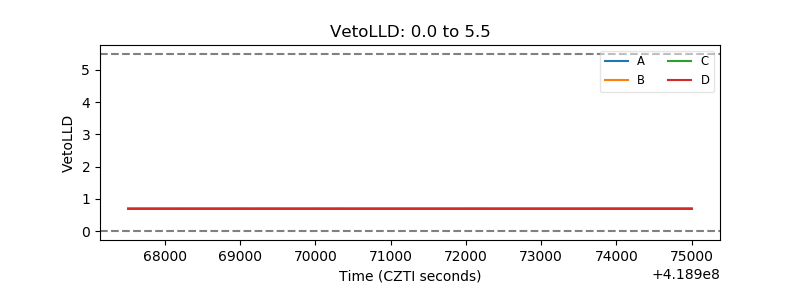 |
| Alpha Counter | 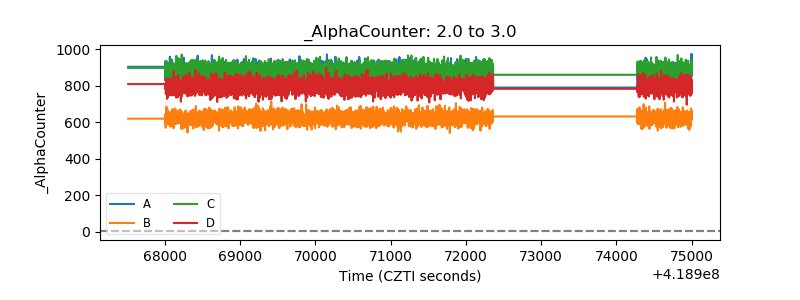 |
| _CPM_Rate | 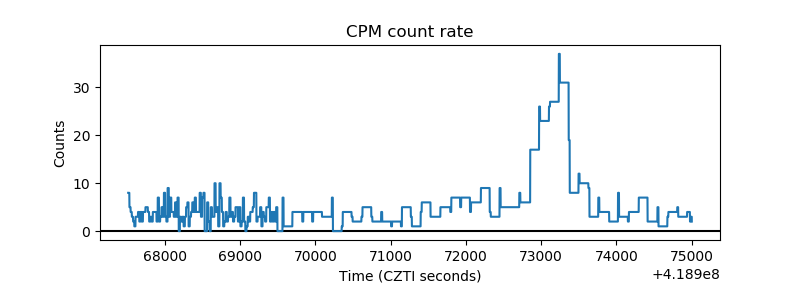 |
| CZT Counter | 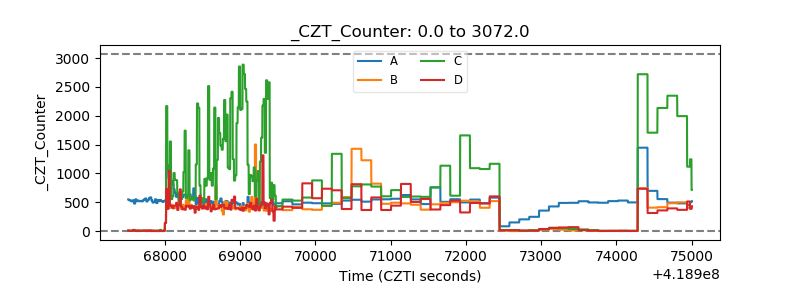 |
| +2.5 Volts monitor | 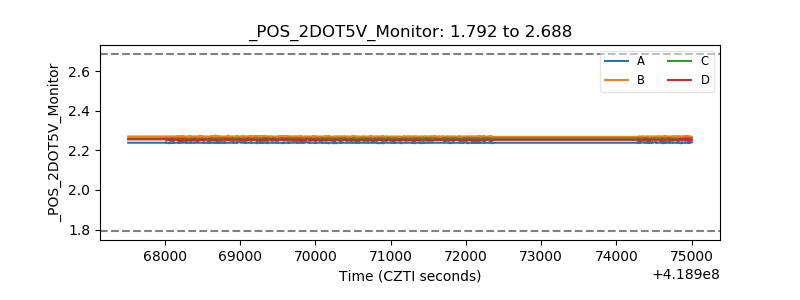 |
| +5 Volts monitor | 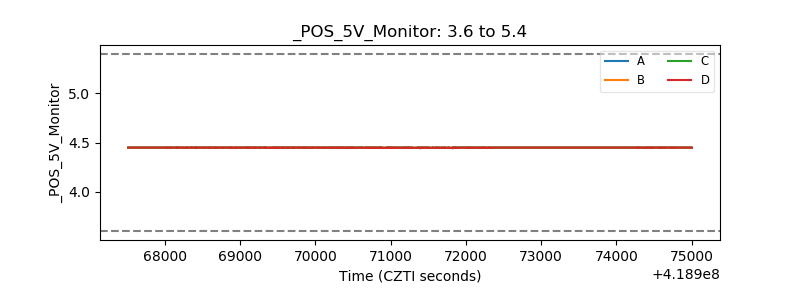 |
| _ROLL_ROT | 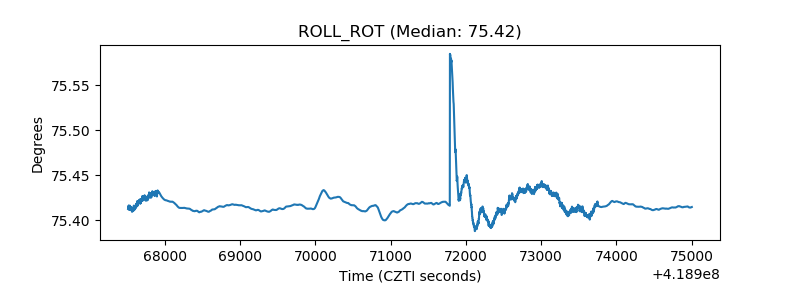 |
| _Roll_DEC | 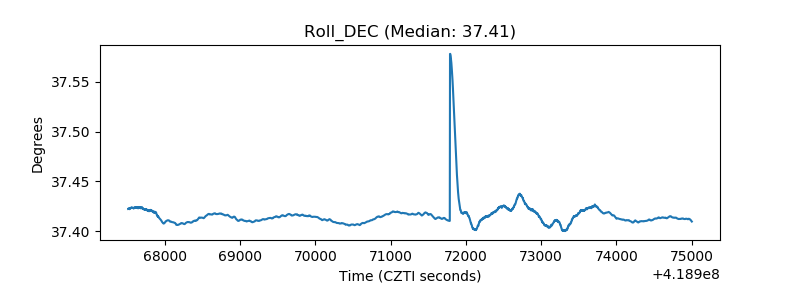 |
| _Roll_RA | 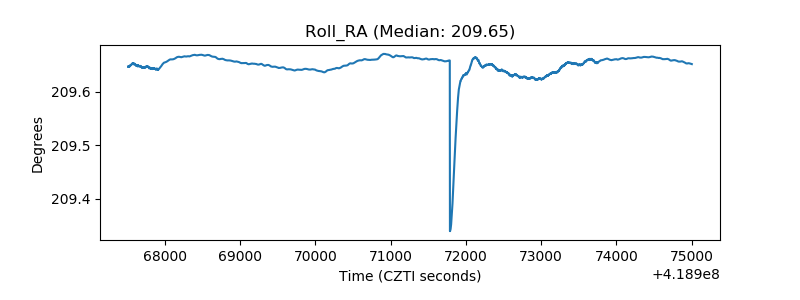 |
| Veto Counter | 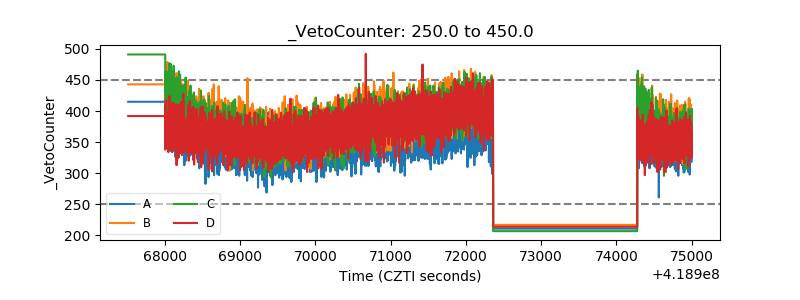 |