| Param | Original file | Final file |
|---|---|---|
| Filename | modeM0/AS1A12_068T02_9000005564_40754cztM0_level2.fits | modeM0/AS1A12_068T02_9000005564_40754cztM0_level2_quad_clean.evt |
| Size (bytes) | 410,564,160 | 86,520,960 |
| Size | 391.5 MB | 82.5 MB |
| Events in quadrant A | 2,891,248 | 599,298 |
| Events in quadrant B | 2,484,935 | 622,877 |
| Events in quadrant C | 6,664,931 | 502,549 |
| Events in quadrant D | 2,726,698 | 508,663 |
| Mode M0 | |||
|---|---|---|---|
| Quadrant | BADHDUFLAG | Total packets | Discarded packets |
| A | 0 | 11784 | 3 |
| B | 0 | 11175 | 2 |
| C | 0 | 23510 | 2 |
| D | 0 | 11991 | 2 |
| Mode SS | |||
|---|---|---|---|
| Quadrant | BADHDUFLAG | Total packets | Discarded packets |
| A | 0 | 112 | 0 |
| B | 0 | 112 | 0 |
| C | 0 | 112 | 0 |
| D | 0 | 112 | 0 |
| Mode M9 | |||
|---|---|---|---|
| Quadrant | BADHDUFLAG | Total packets | Discarded packets |
| A | 0 | 31 | 0 |
| B | 0 | 31 | 0 |
| C | 0 | 31 | 0 |
| D | 0 | 32 | 0 |
| Quadrant | Total seconds | Saturated seconds | Saturation percentage |
|---|---|---|---|
| A | 5520 | 8 | 0.144928% |
| B | 5520 | 6 | 0.108696% |
| C | 5520 | 1109 | 20.090580% |
| D | 5520 | 405 | 7.336957% |
Noise dominated data is calculated using 1-second bins in cleaned event files. If a bin has >2000 counts, and if more than 50% of those come from <1% of pixels, then it is considered to be noise-dominated and hence unusable.
| Quadrant | # 1 sec bins | Bins with >0 counts | Bins with >2000 counts | High rate bins dominated by noise | Noise dominated (total time) | Noise dominated (detector-on time) | Marked lightcurve |
|---|---|---|---|---|---|---|---|
| A | 7104 | 5521 | 4 | 4 | 0.06% | 0.07% | 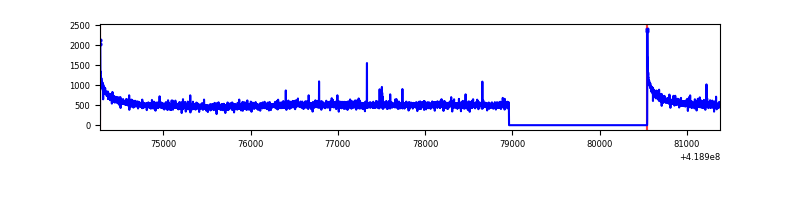 |
| B | 7104 | 5521 | 0 | 0 | 0.00% | 0.00% | 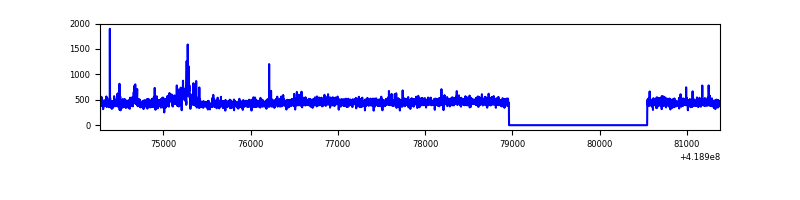 |
| C | 7104 | 5521 | 1172 | 1172 | 16.50% | 21.23% | 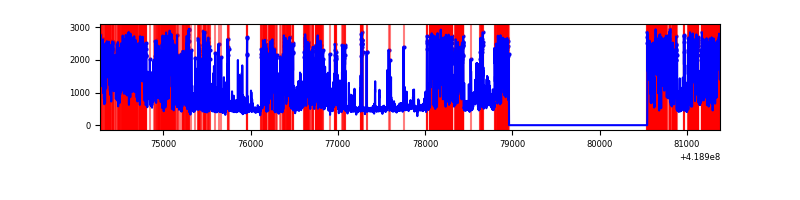 |
| D | 7104 | 5521 | 33 | 33 | 0.46% | 0.60% | 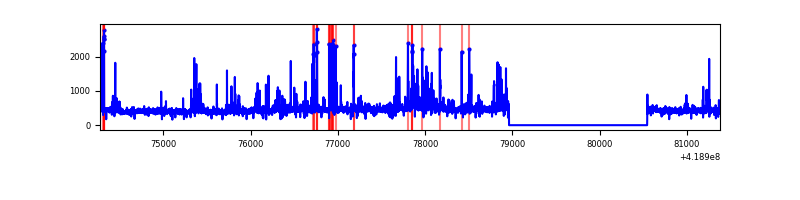 |
Top three noisy pixels from each quadrant. If the there are fewer than three noisy pixels in the level2.evt file, extra rows are filled as -1
| Pixel properties | Quadrant properties | ||||||
|---|---|---|---|---|---|---|---|
| Quadrant | DetID | PixID | Counts | Sigma | Mean | Median | Sigma |
| A | 10 | 83 | 479251 | 3832.06 | 610 | 599 | 124.9 |
| A | 6 | 10 | 23570 | 183.9 | 610 | 599 | 124.9 |
| A | 12 | 189 | 21965 | 171.05 | 610 | 599 | 124.9 |
| B | 0 | 229 | 65121 | 539.11 | 607 | 589 | 119.7 |
| B | 12 | 111 | 15488 | 124.47 | 607 | 589 | 119.7 |
| B | 11 | 111 | 14378 | 115.2 | 607 | 589 | 119.7 |
| C | 9 | 187 | 4110254 | 31609.28 | 556 | 559 | 130.0 |
| C | 15 | 214 | 225625 | 1731.07 | 556 | 559 | 130.0 |
| C | 0 | 10 | 102270 | 782.3 | 556 | 559 | 130.0 |
| D | 2 | 249 | 200188 | 1412.39 | 570 | 555 | 141.3 |
| D | 12 | 191 | 151664 | 1069.09 | 570 | 555 | 141.3 |
| D | 2 | 250 | 79194 | 556.36 | 570 | 555 | 141.3 |
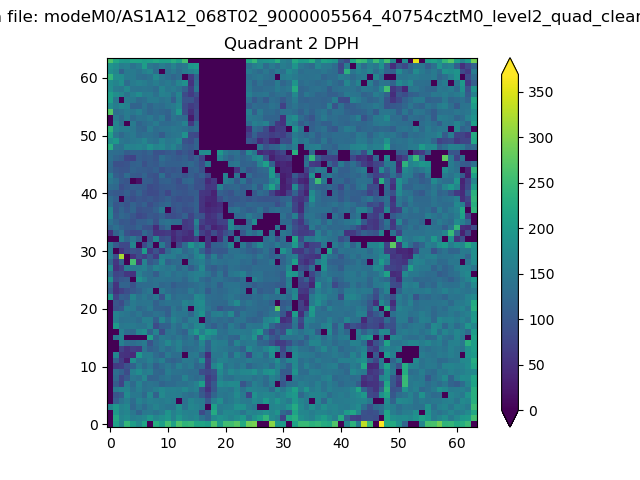
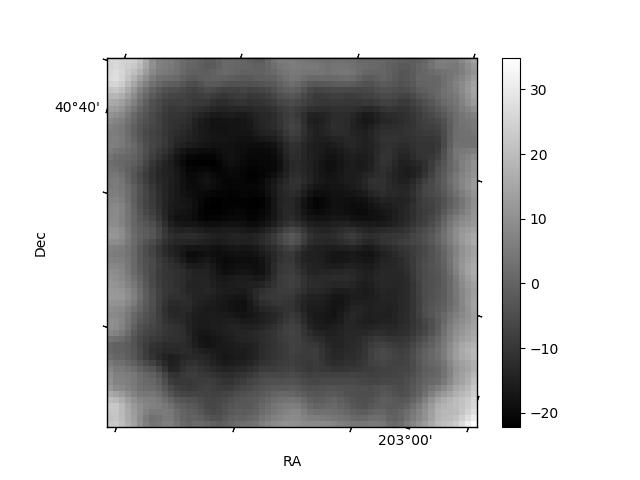
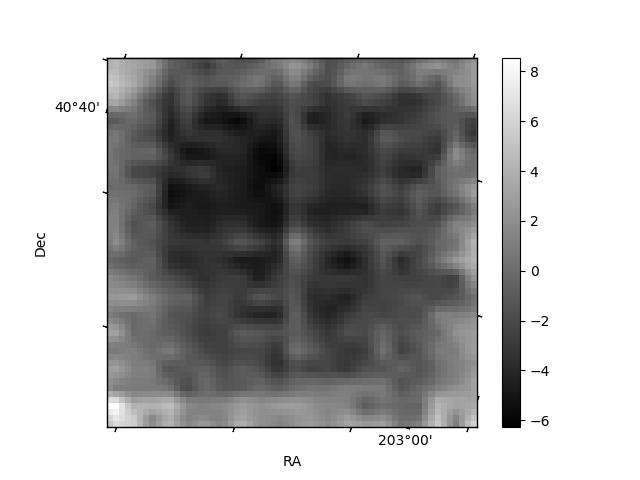
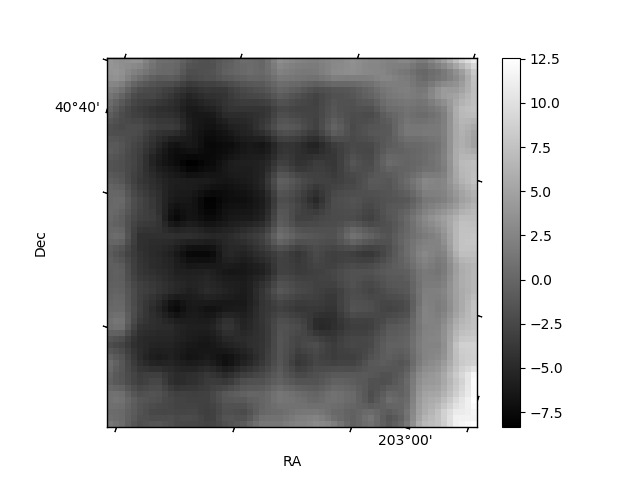
Histogram calculated using DETX and DETY for each event in the final _common_clean file
| Quadrant A | 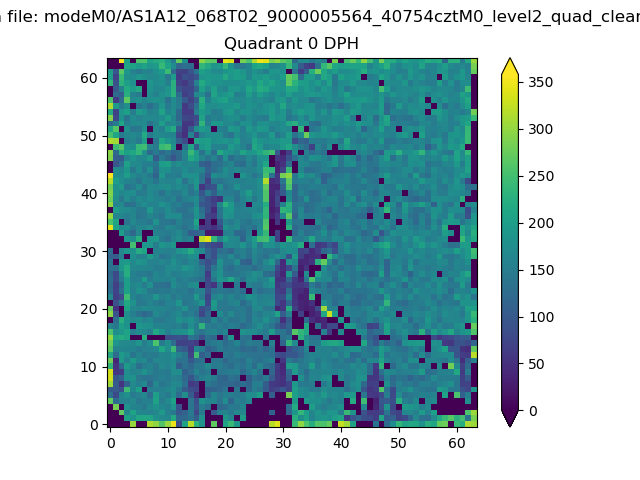 |
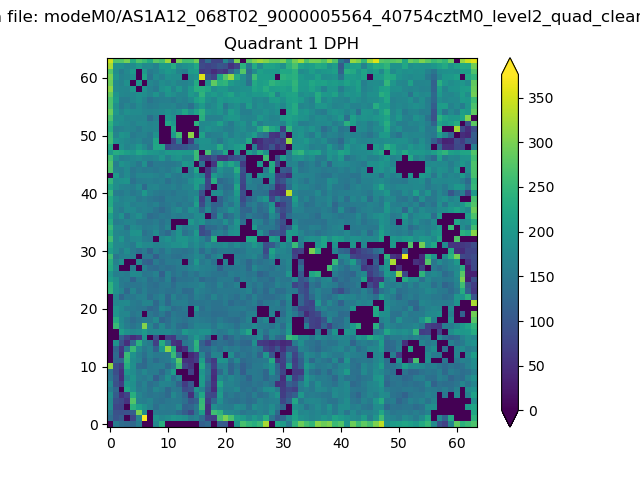 |
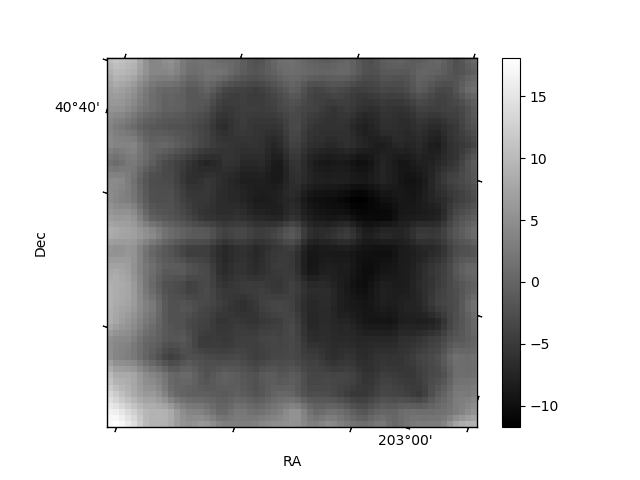
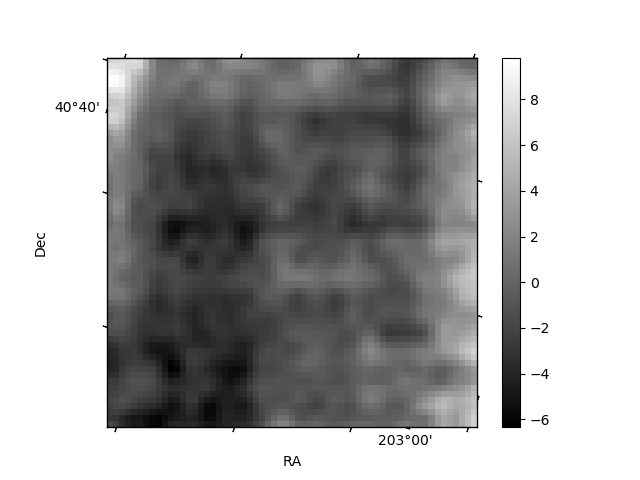
Quadrant B |
|---|---|---|---|
| Quadrant D | 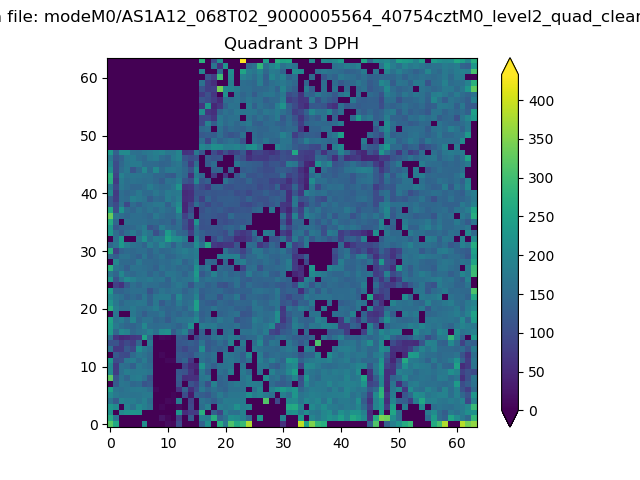 |
 |
Quadrant C |
| Plot type | Count rate plots | Images |
|---|---|---|
| Comparison with Poisson distribution Blue bars denote a histogram of data divided into 1 sec bins. Red curve is a Poisson curve with rate = median count rate of data. |
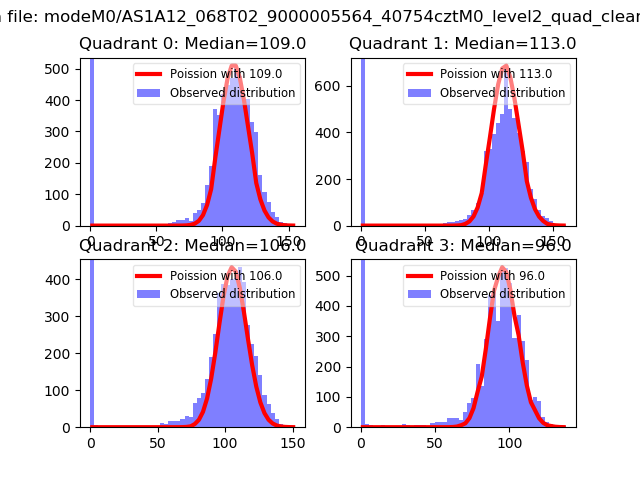 |
 |
| Quadrant-wise count rates Data is divided into 100 sec bins |
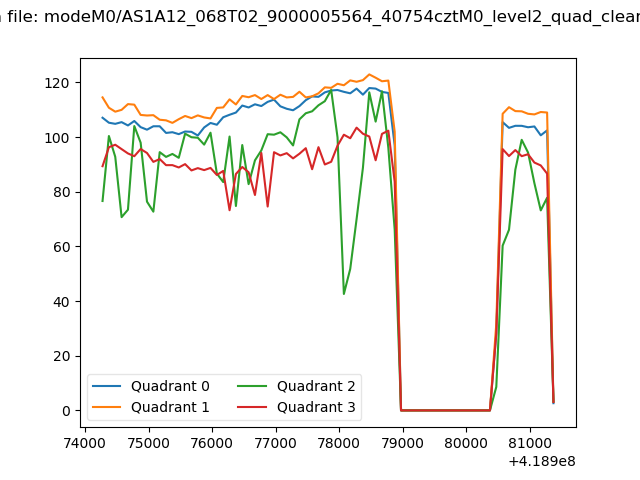 |
|
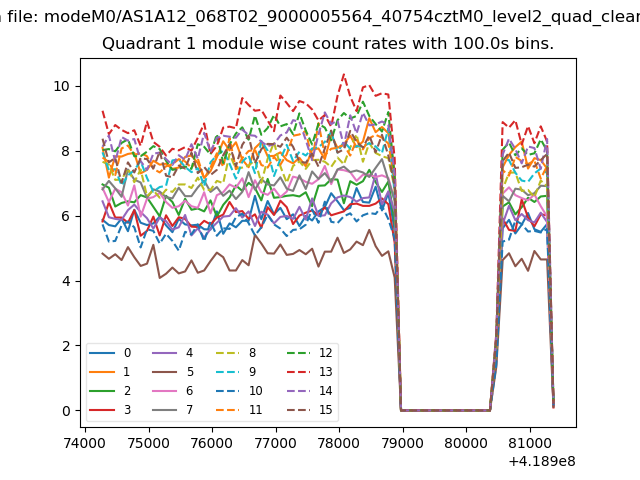
| Module-wise count rates for Quadrant A Data is divided into 100 sec bins |
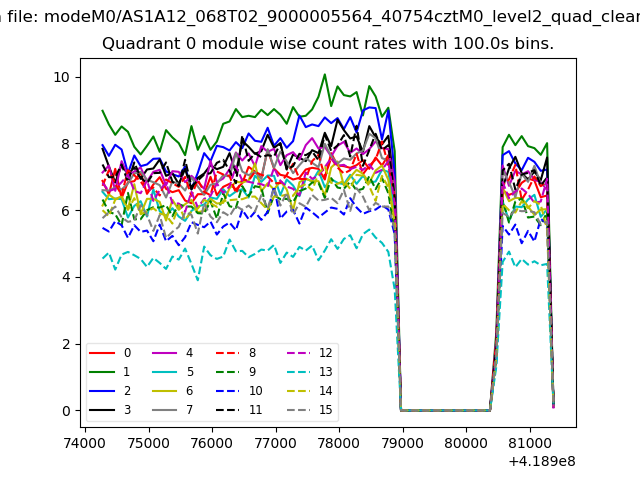 |
 |
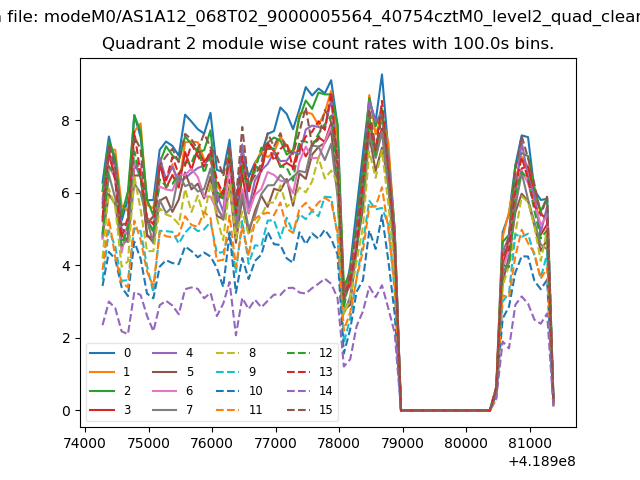
| Module-wise count rates for Quadrant B Data is divided into 100 sec bins |
 |
 |
| Module-wise count rates for Quadrant C Data is divided into 100 sec bins |
 |
 |
| Module-wise count rates for Quadrant D Data is divided into 100 sec bins |
 |
 |
| Parameter | Plot |
|---|---|
| CZT HV Monitor | 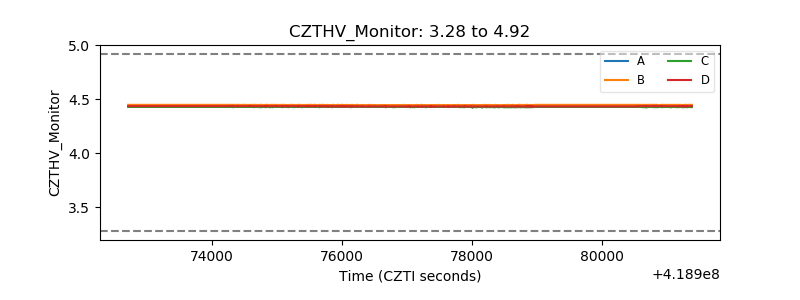 |
| D_VDD | 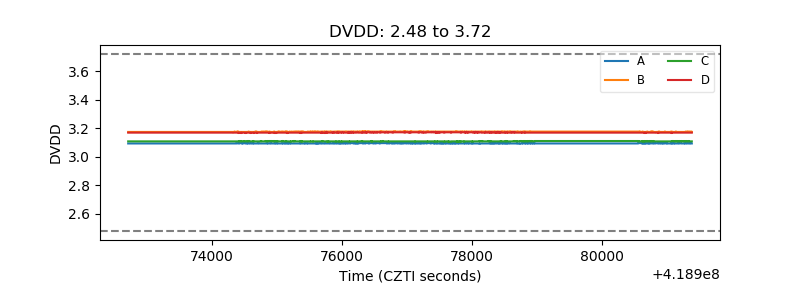 |
| Temperature 1 |  |
| Veto HV Monitor |  |
| Veto LLD | 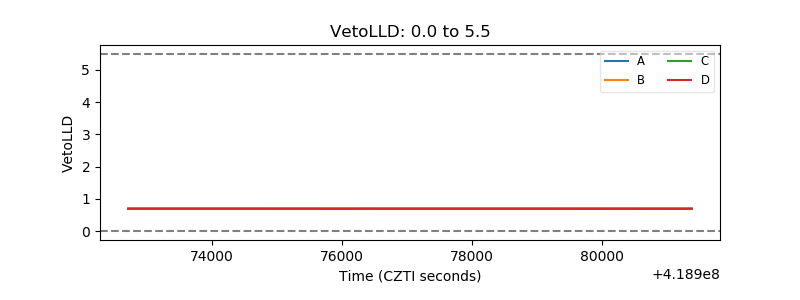 |
| Alpha Counter | 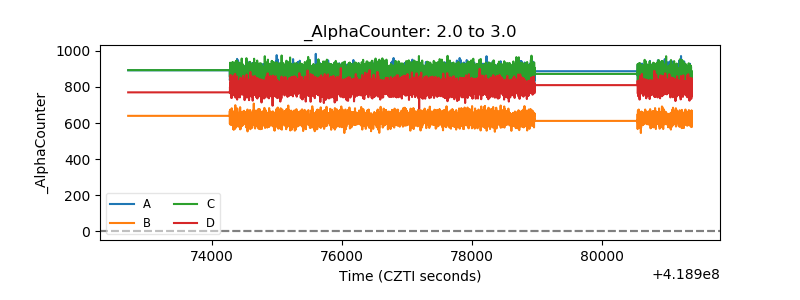 |
| _CPM_Rate | 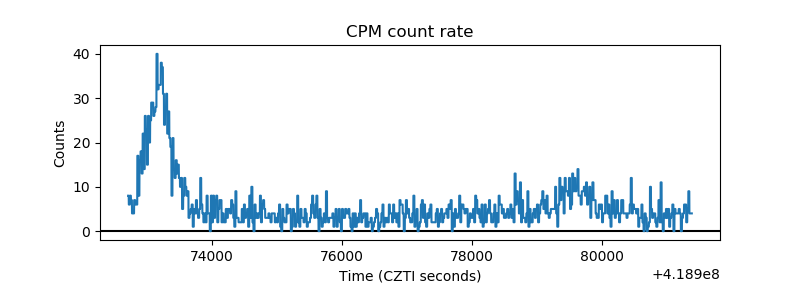 |
| CZT Counter | 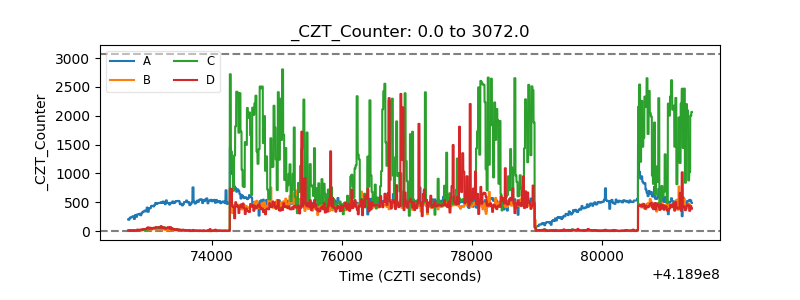 |
| +2.5 Volts monitor | 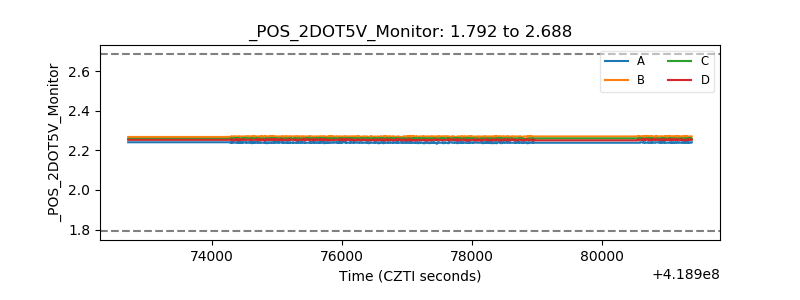 |
| +5 Volts monitor | 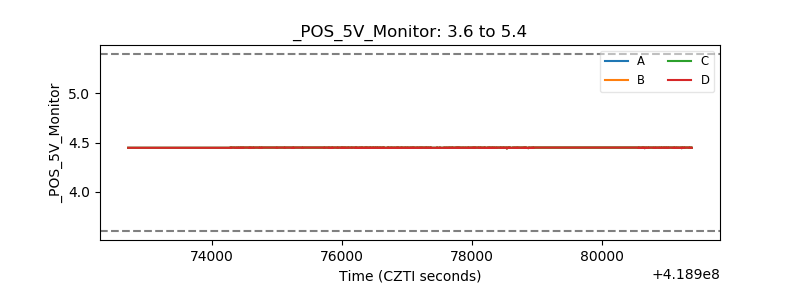 |
| _ROLL_ROT | 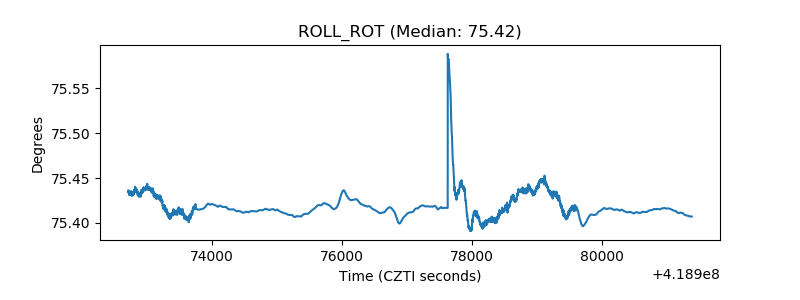 |
| _Roll_DEC | 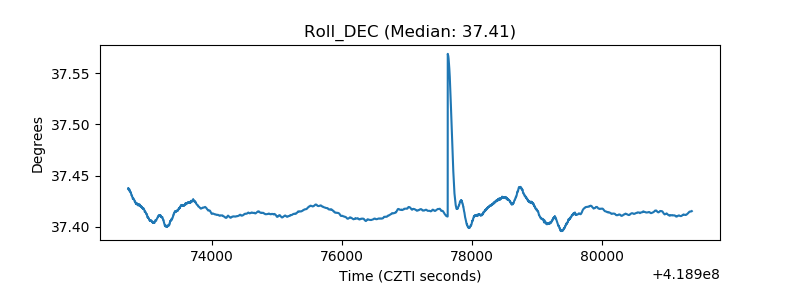 |
| _Roll_RA | 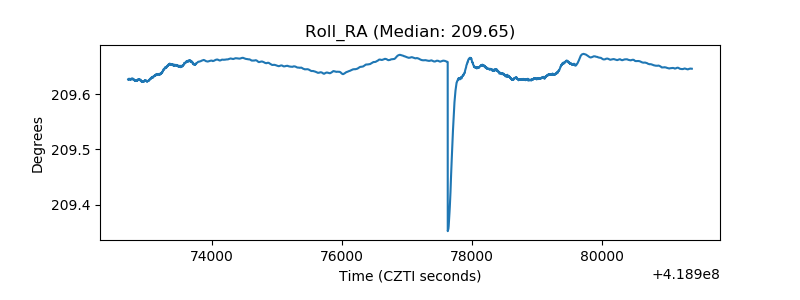 |
| Veto Counter | 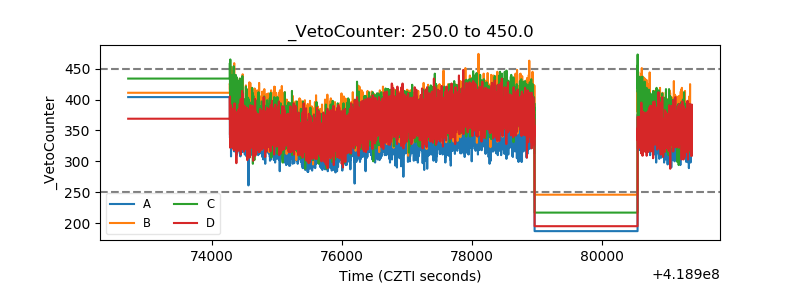 |