| Param | Original file | Final file |
|---|---|---|
| Filename | modeM0/AS1A12_068T02_9000005564_40755cztM0_level2.fits | modeM0/AS1A12_068T02_9000005564_40755cztM0_level2_quad_clean.evt |
| Size (bytes) | 449,406,720 | 90,532,800 |
| Size | 428.6 MB | 86.3 MB |
| Events in quadrant A | 3,044,672 | 630,761 |
| Events in quadrant B | 2,725,167 | 652,469 |
| Events in quadrant C | 7,155,253 | 532,567 |
| Events in quadrant D | 3,258,184 | 518,919 |
| Mode M0 | |||
|---|---|---|---|
| Quadrant | BADHDUFLAG | Total packets | Discarded packets |
| A | 0 | 12432 | 3 |
| B | 0 | 12043 | 2 |
| C | 0 | 25251 | 2 |
| D | 0 | 13722 | 2 |
| Mode SS | |||
|---|---|---|---|
| Quadrant | BADHDUFLAG | Total packets | Discarded packets |
| A | 0 | 118 | 0 |
| B | 0 | 118 | 0 |
| C | 0 | 118 | 0 |
| D | 0 | 118 | 0 |
| Mode M9 | |||
|---|---|---|---|
| Quadrant | BADHDUFLAG | Total packets | Discarded packets |
| A | 0 | 17 | 0 |
| B | 0 | 17 | 0 |
| C | 0 | 17 | 0 |
| D | 0 | 18 | 0 |
| Quadrant | Total seconds | Saturated seconds | Saturation percentage |
|---|---|---|---|
| A | 5812 | 11 | 0.189264% |
| B | 5812 | 6 | 0.103235% |
| C | 5812 | 1103 | 18.977977% |
| D | 5812 | 623 | 10.719202% |
Noise dominated data is calculated using 1-second bins in cleaned event files. If a bin has >2000 counts, and if more than 50% of those come from <1% of pixels, then it is considered to be noise-dominated and hence unusable.
| Quadrant | # 1 sec bins | Bins with >0 counts | Bins with >2000 counts | High rate bins dominated by noise | Noise dominated (total time) | Noise dominated (detector-on time) | Marked lightcurve |
|---|---|---|---|---|---|---|---|
| A | 7155 | 5813 | 3 | 3 | 0.04% | 0.05% | 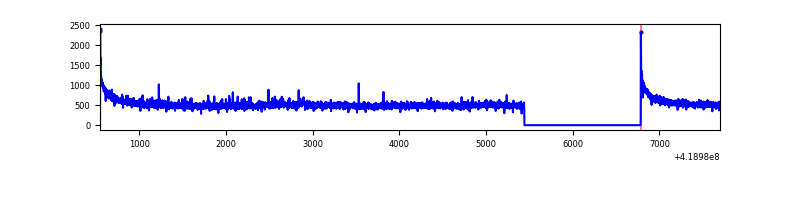 |
| B | 7155 | 5813 | 0 | 0 | 0.00% | 0.00% | 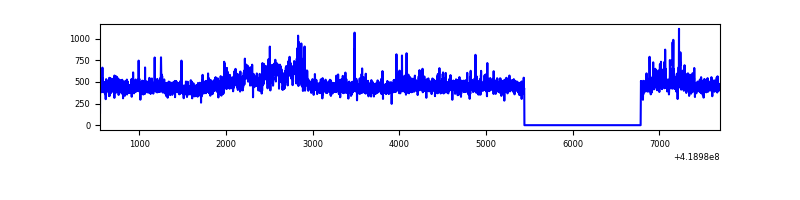 |
| C | 7155 | 5813 | 1104 | 1104 | 15.43% | 18.99% | 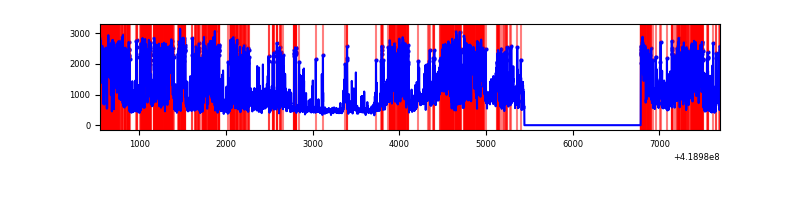 |
| D | 7154 | 5812 | 89 | 89 | 1.24% | 1.53% | 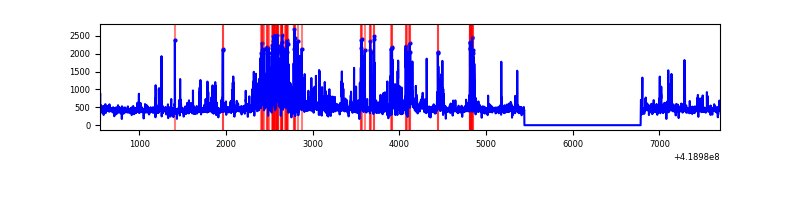 |
Top three noisy pixels from each quadrant. If the there are fewer than three noisy pixels in the level2.evt file, extra rows are filled as -1
| Pixel properties | Quadrant properties | ||||||
|---|---|---|---|---|---|---|---|
| Quadrant | DetID | PixID | Counts | Sigma | Mean | Median | Sigma |
| A | 10 | 83 | 508747 | 3837.88 | 642 | 630 | 132.4 |
| A | 6 | 10 | 31423 | 232.58 | 642 | 630 | 132.4 |
| A | 12 | 189 | 14523 | 104.94 | 642 | 630 | 132.4 |
| B | 0 | 229 | 144305 | 1141.31 | 639 | 619 | 125.9 |
| B | 4 | 81 | 23503 | 181.77 | 639 | 619 | 125.9 |
| B | 4 | 171 | 20804 | 160.33 | 639 | 619 | 125.9 |
| C | 9 | 187 | 4498713 | 32549.49 | 589 | 591 | 138.2 |
| C | 15 | 214 | 236324 | 1705.82 | 589 | 591 | 138.2 |
| C | 0 | 10 | 71331 | 511.89 | 589 | 591 | 138.2 |
| D | 2 | 249 | 438036 | 2936.4 | 595 | 576 | 149.0 |
| D | 2 | 250 | 165333 | 1105.91 | 595 | 576 | 149.0 |
| D | 12 | 191 | 162711 | 1088.31 | 595 | 576 | 149.0 |
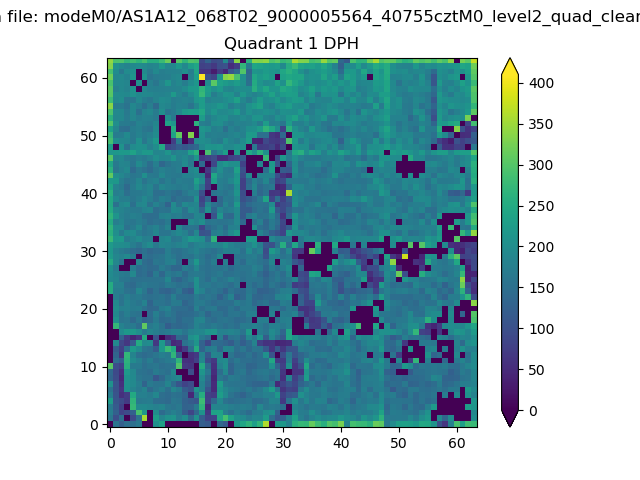
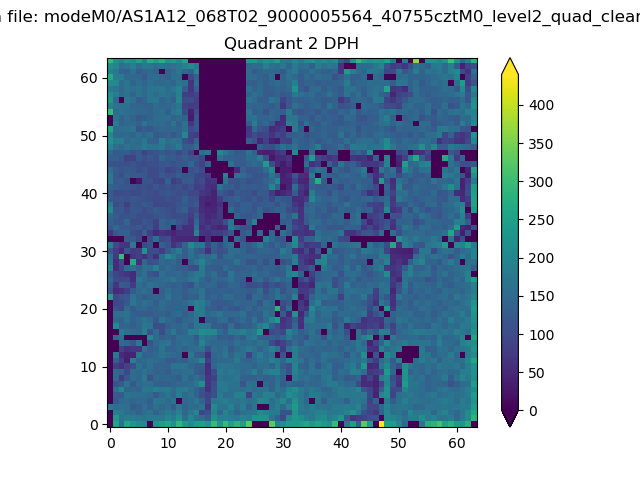
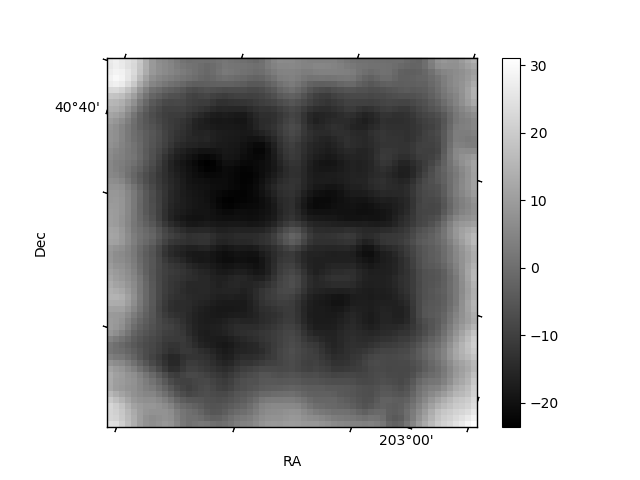
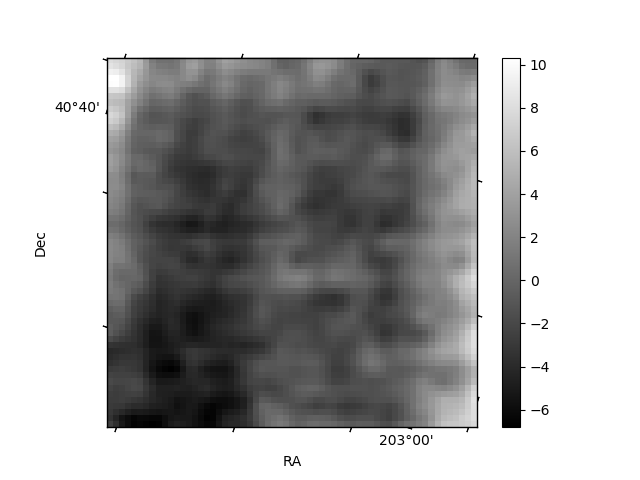
Histogram calculated using DETX and DETY for each event in the final _common_clean file
| Quadrant A |  |
 |
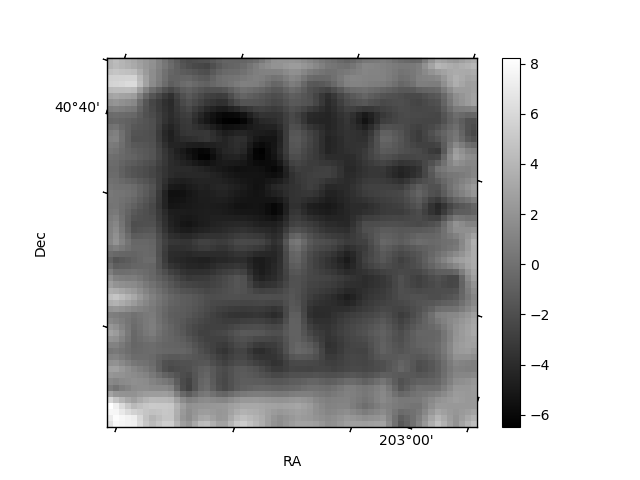
Quadrant B |
|---|---|---|---|
| Quadrant D | 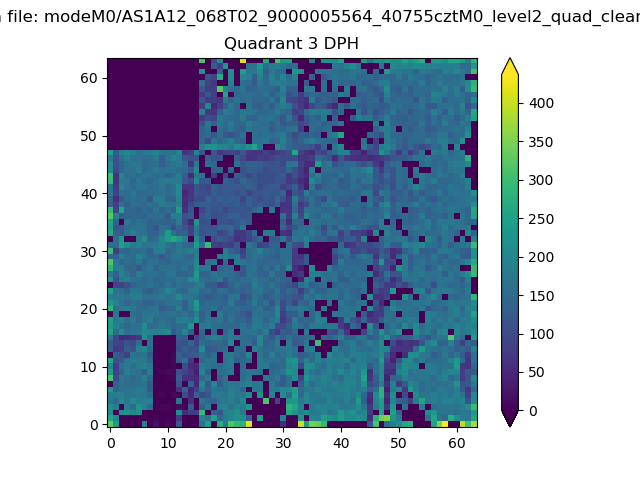 |
 |
Quadrant C |
| Plot type | Count rate plots | Images |
|---|---|---|
| Comparison with Poisson distribution Blue bars denote a histogram of data divided into 1 sec bins. Red curve is a Poisson curve with rate = median count rate of data. |
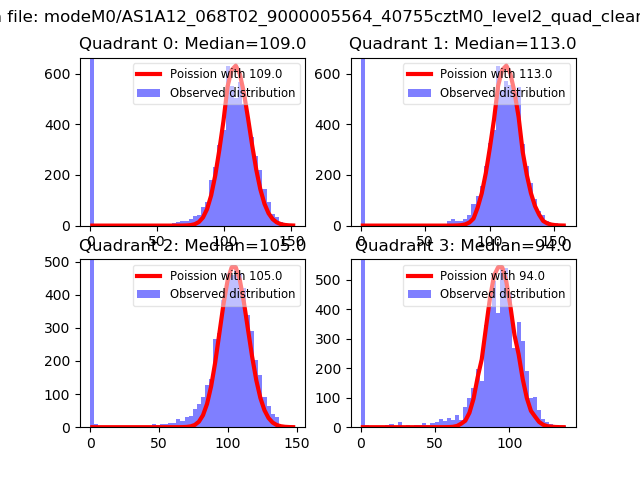 |
 |
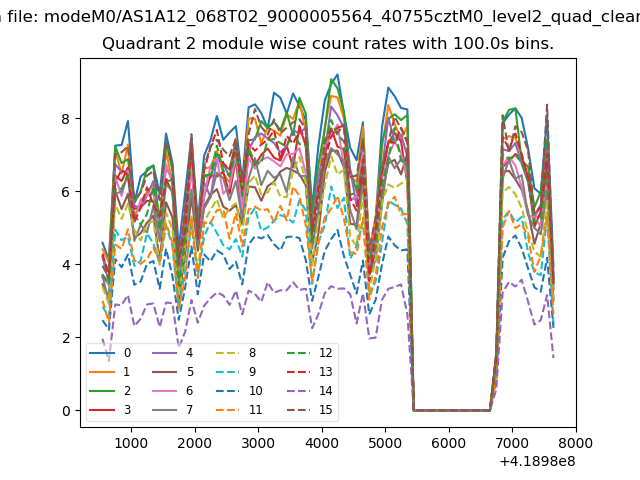
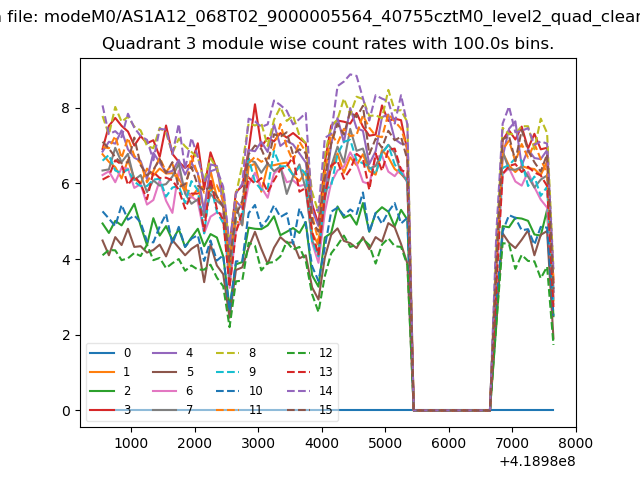
| Quadrant-wise count rates Data is divided into 100 sec bins |
 |
|
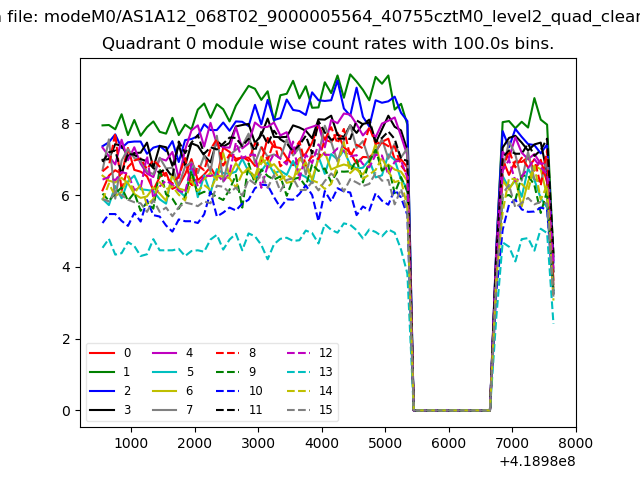
| Module-wise count rates for Quadrant A Data is divided into 100 sec bins |
 |
 |
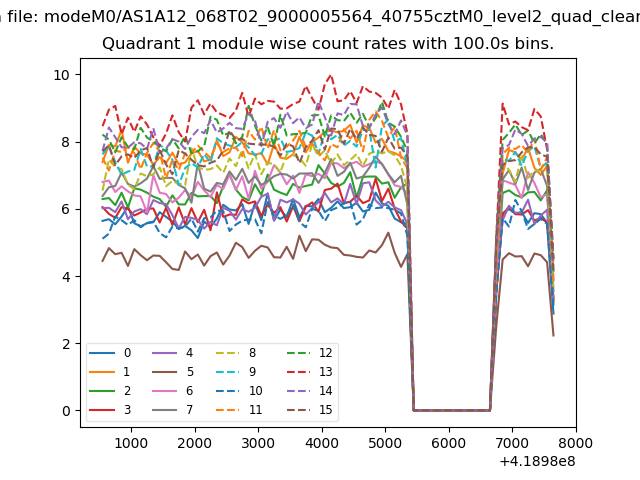
| Module-wise count rates for Quadrant B Data is divided into 100 sec bins |
 |
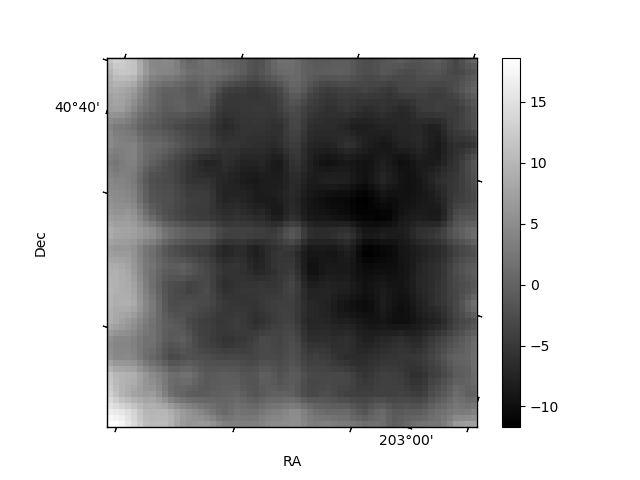 |
| Module-wise count rates for Quadrant C Data is divided into 100 sec bins |
 |
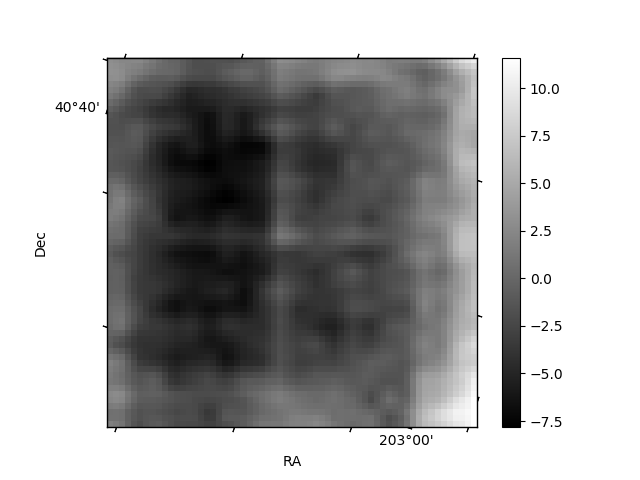 |
| Module-wise count rates for Quadrant D Data is divided into 100 sec bins |
 |
 |
| Parameter | Plot |
|---|---|
| CZT HV Monitor |  |
| D_VDD | 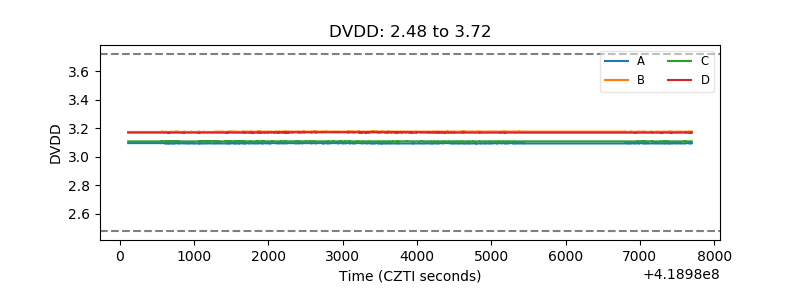 |
| Temperature 1 | 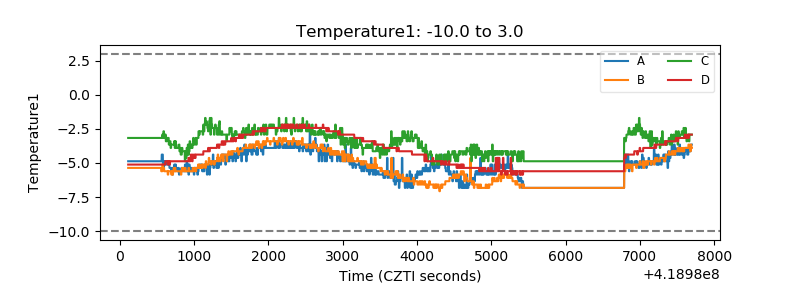 |
| Veto HV Monitor | 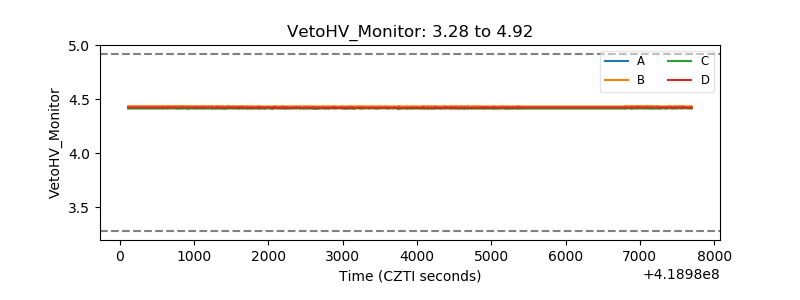 |
| Veto LLD | 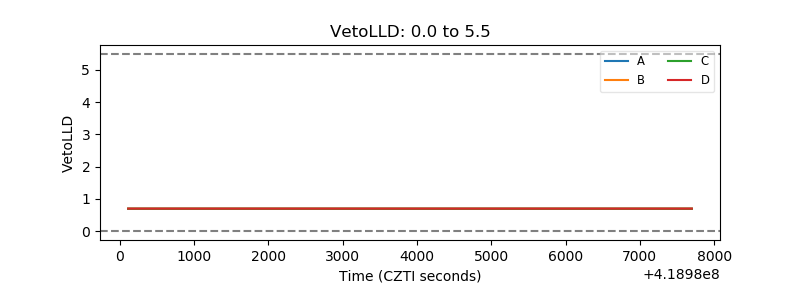 |
| Alpha Counter | 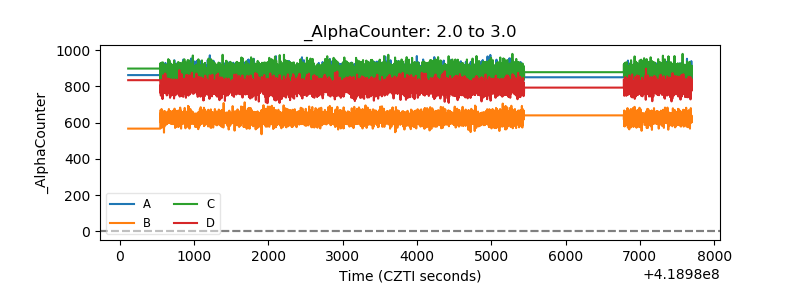 |
| _CPM_Rate | 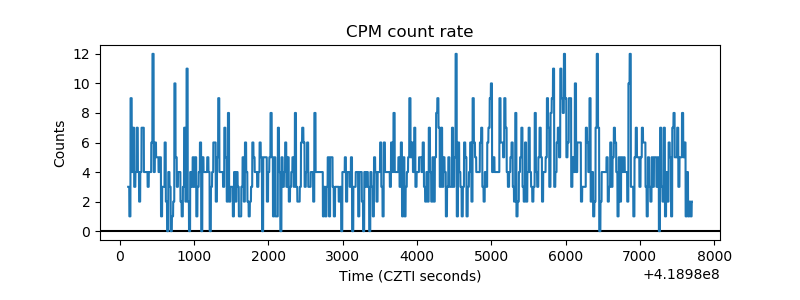 |
| CZT Counter | 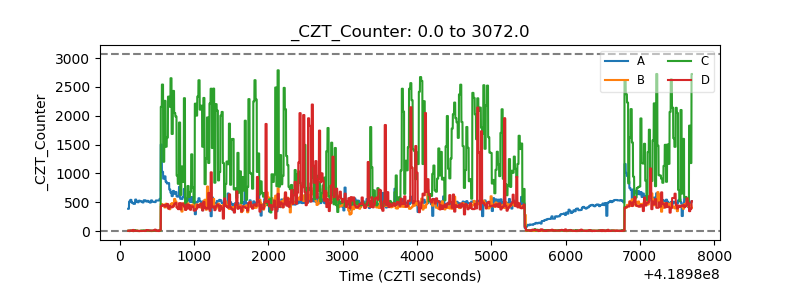 |
| +2.5 Volts monitor | 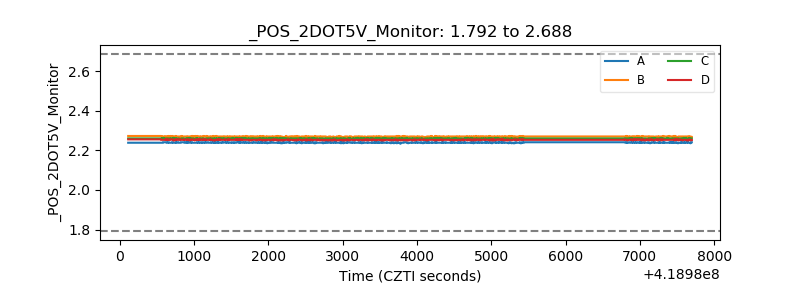 |
| +5 Volts monitor |  |
| _ROLL_ROT | 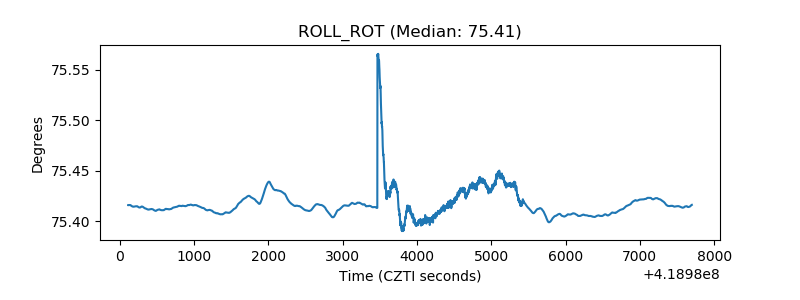 |
| _Roll_DEC | 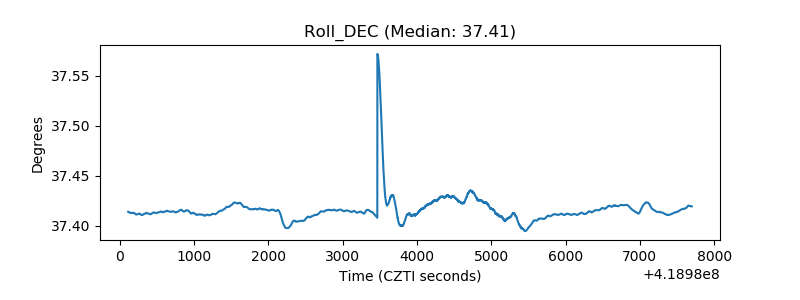 |
| _Roll_RA | 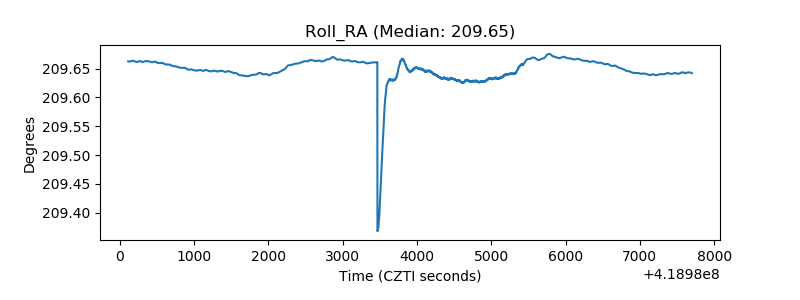 |
| Veto Counter | 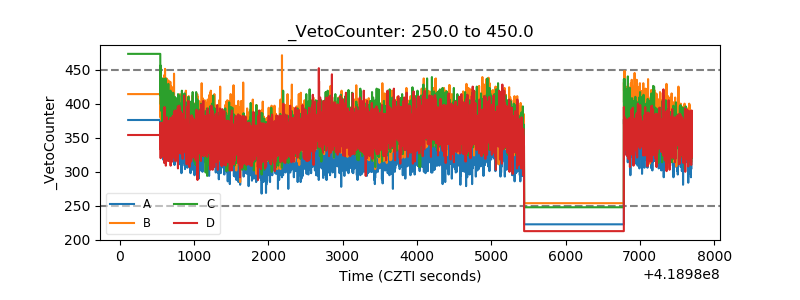 |