| Param | Original file | Final file |
|---|---|---|
| Filename | modeM0/AS1A12_068T02_9000005564_40756cztM0_level2.fits | modeM0/AS1A12_068T02_9000005564_40756cztM0_level2_quad_clean.evt |
| Size (bytes) | 461,865,600 | 98,968,320 |
| Size | 440.5 MB | 94.4 MB |
| Events in quadrant A | 3,286,450 | 688,016 |
| Events in quadrant B | 2,933,401 | 703,247 |
| Events in quadrant C | 6,537,141 | 619,468 |
| Events in quadrant D | 3,846,952 | 543,542 |
| Mode M0 | |||
|---|---|---|---|
| Quadrant | BADHDUFLAG | Total packets | Discarded packets |
| A | 0 | 13475 | 3 |
| B | 0 | 12999 | 2 |
| C | 0 | 23703 | 2 |
| D | 0 | 15822 | 2 |
| Mode SS | |||
|---|---|---|---|
| Quadrant | BADHDUFLAG | Total packets | Discarded packets |
| A | 0 | 130 | 0 |
| B | 0 | 130 | 0 |
| C | 0 | 130 | 0 |
| D | 0 | 130 | 0 |
| Mode M9 | |||
|---|---|---|---|
| Quadrant | BADHDUFLAG | Total packets | Discarded packets |
| A | 0 | 26 | 0 |
| B | 0 | 26 | 0 |
| C | 0 | 26 | 0 |
| D | 0 | 26 | 0 |
| Quadrant | Total seconds | Saturated seconds | Saturation percentage |
|---|---|---|---|
| A | 6335 | 17 | 0.268350% |
| B | 6335 | 19 | 0.299921% |
| C | 6335 | 719 | 11.349645% |
| D | 6335 | 793 | 12.517758% |
Noise dominated data is calculated using 1-second bins in cleaned event files. If a bin has >2000 counts, and if more than 50% of those come from <1% of pixels, then it is considered to be noise-dominated and hence unusable.
| Quadrant | # 1 sec bins | Bins with >0 counts | Bins with >2000 counts | High rate bins dominated by noise | Noise dominated (total time) | Noise dominated (detector-on time) | Marked lightcurve |
|---|---|---|---|---|---|---|---|
| A | 8962 | 6337 | 3 | 3 | 0.03% | 0.05% | 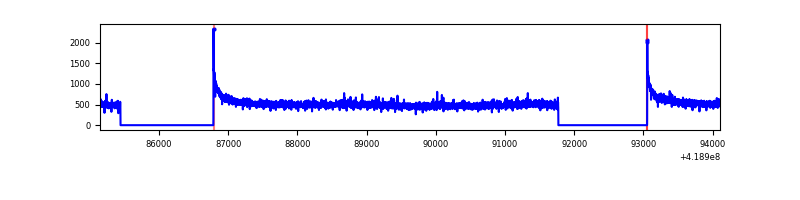 |
| B | 8962 | 6337 | 4 | 4 | 0.04% | 0.06% | 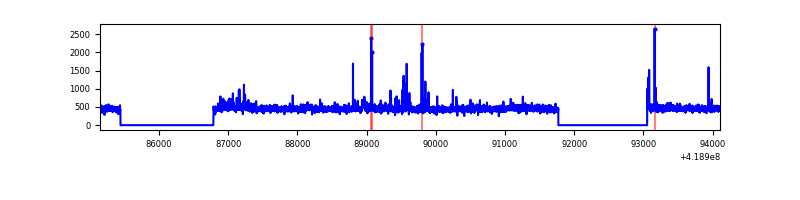 |
| C | 8962 | 6337 | 712 | 712 | 7.94% | 11.24% | 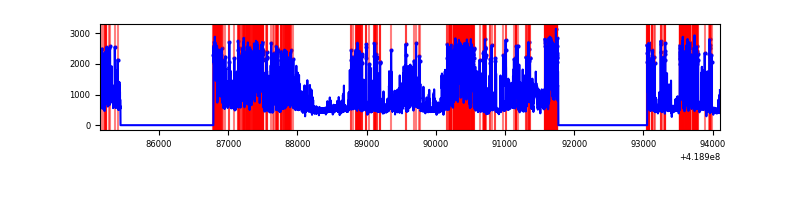 |
| D | 8962 | 6337 | 296 | 296 | 3.30% | 4.67% | 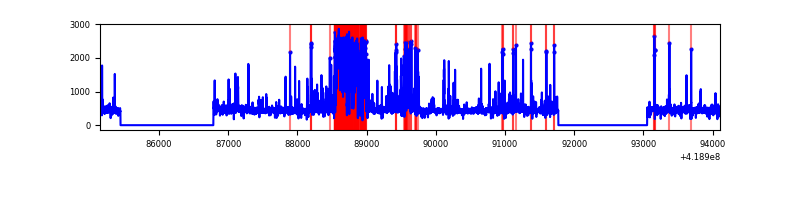 |
Top three noisy pixels from each quadrant. If the there are fewer than three noisy pixels in the level2.evt file, extra rows are filled as -1
| Pixel properties | Quadrant properties | ||||||
|---|---|---|---|---|---|---|---|
| Quadrant | DetID | PixID | Counts | Sigma | Mean | Median | Sigma |
| A | 10 | 83 | 532293 | 3695.67 | 703 | 689 | 143.8 |
| A | 6 | 10 | 27023 | 183.07 | 703 | 689 | 143.8 |
| A | 3 | 137 | 8124 | 51.69 | 703 | 689 | 143.8 |
| B | 0 | 229 | 77816 | 558.82 | 700 | 679 | 138.0 |
| B | 4 | 171 | 38967 | 277.38 | 700 | 679 | 138.0 |
| B | 4 | 81 | 38946 | 277.23 | 700 | 679 | 138.0 |
| C | 9 | 187 | 3615496 | 23390.77 | 663 | 667 | 154.5 |
| C | 15 | 214 | 265983 | 1716.8 | 663 | 667 | 154.5 |
| C | 14 | 254 | 32117 | 203.51 | 663 | 667 | 154.5 |
| D | 2 | 249 | 1064271 | 6641.15 | 639 | 620 | 160.2 |
| D | 12 | 191 | 165233 | 1027.8 | 639 | 620 | 160.2 |
| D | 2 | 250 | 71085 | 439.96 | 639 | 620 | 160.2 |
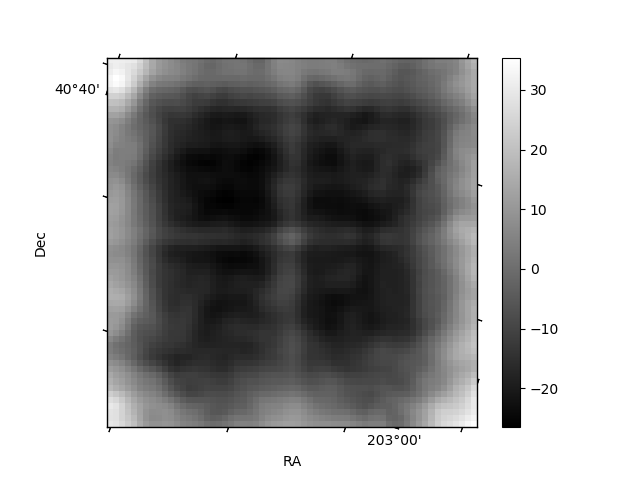
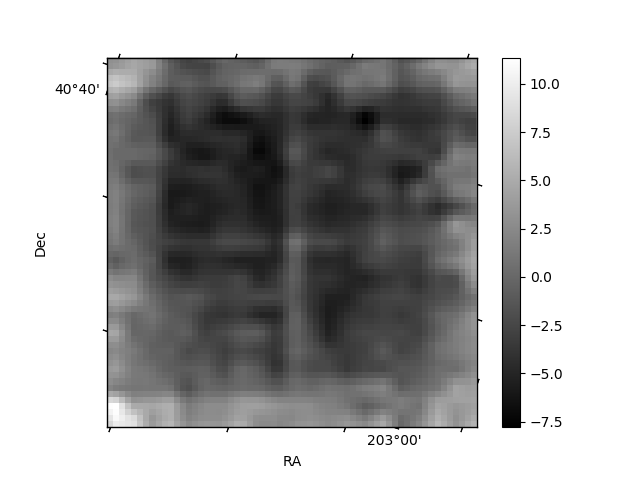
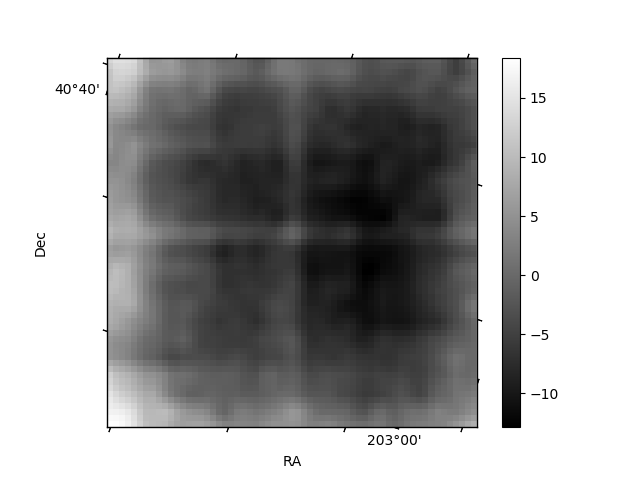
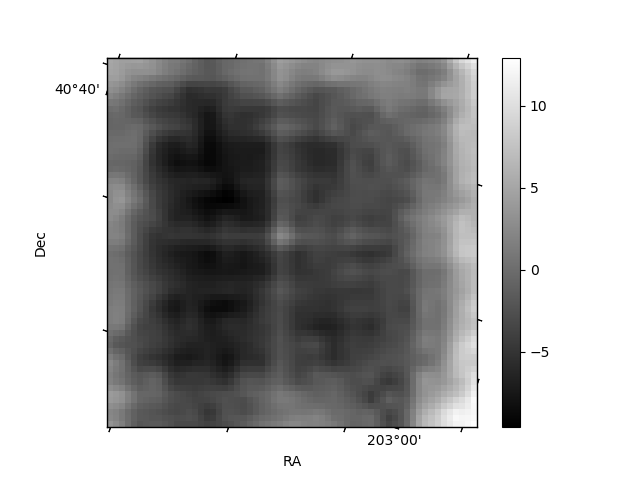
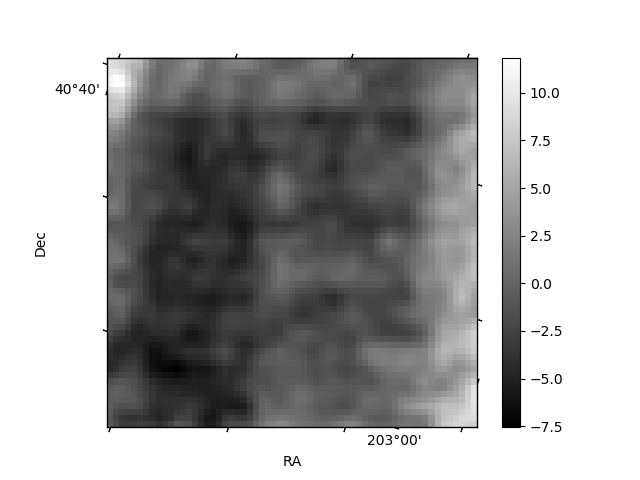
Histogram calculated using DETX and DETY for each event in the final _common_clean file
| Quadrant A | 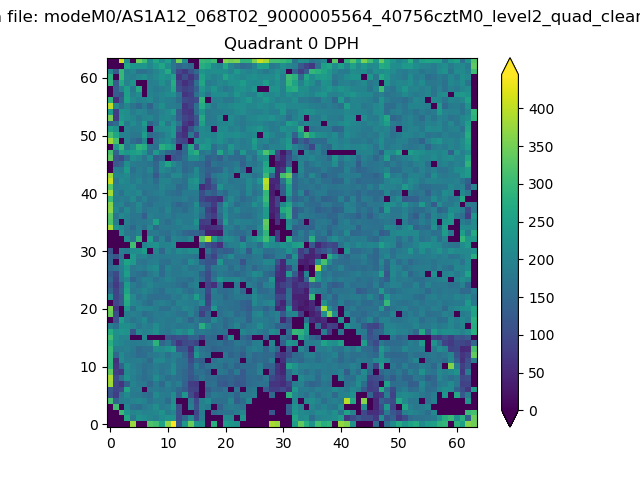 |
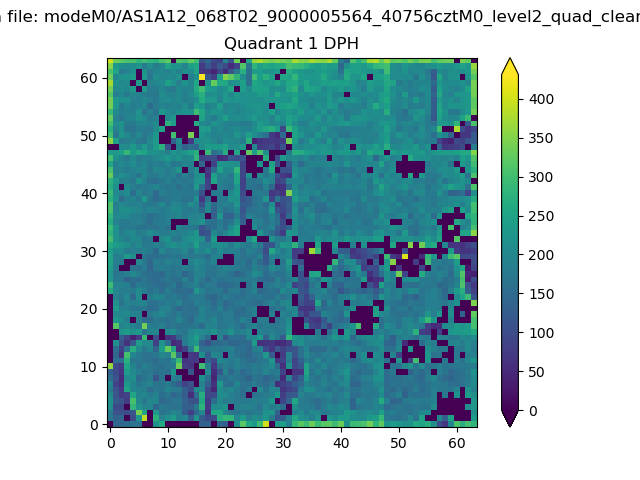 |
Quadrant B |
|---|---|---|---|
| Quadrant D | 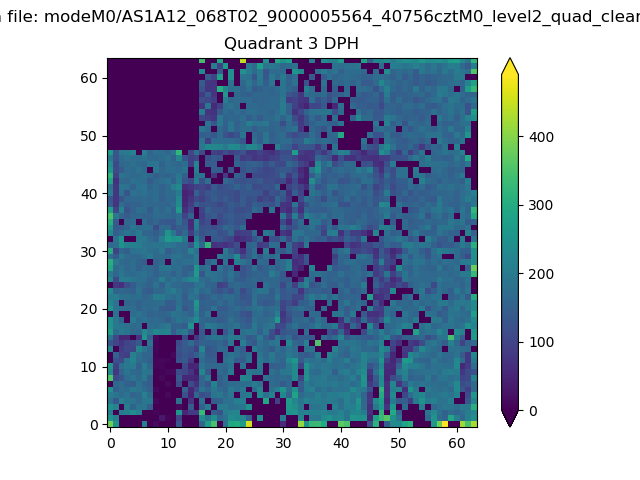 |
 |
Quadrant C |
| Plot type | Count rate plots | Images |
|---|---|---|
| Comparison with Poisson distribution Blue bars denote a histogram of data divided into 1 sec bins. Red curve is a Poisson curve with rate = median count rate of data. |
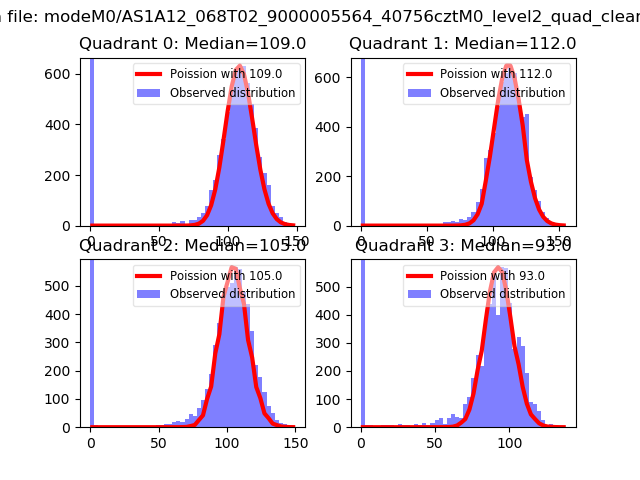 |
 |
| Quadrant-wise count rates Data is divided into 100 sec bins |
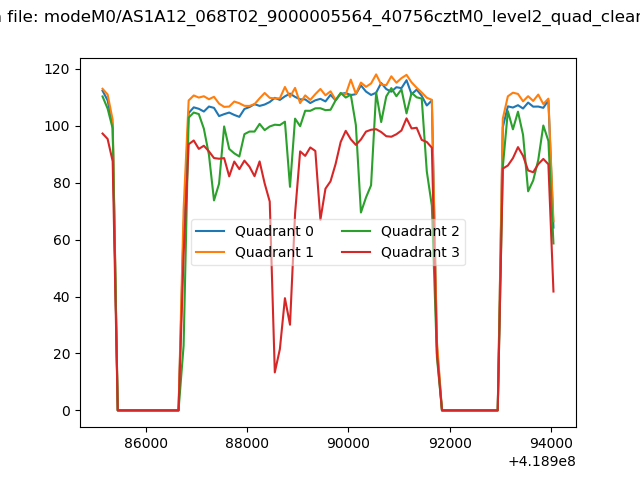 |
|
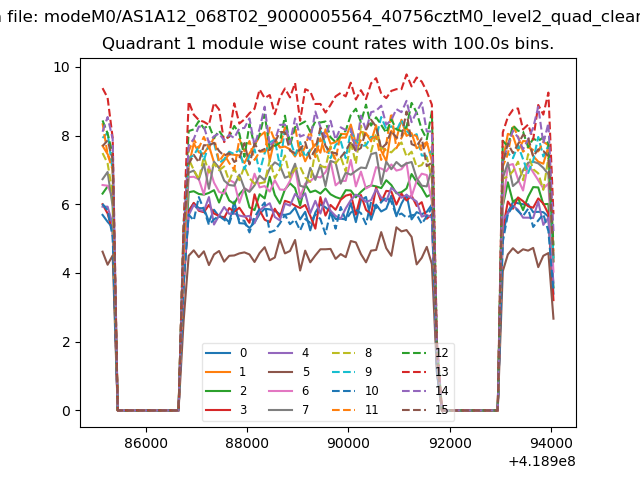
| Module-wise count rates for Quadrant A Data is divided into 100 sec bins |
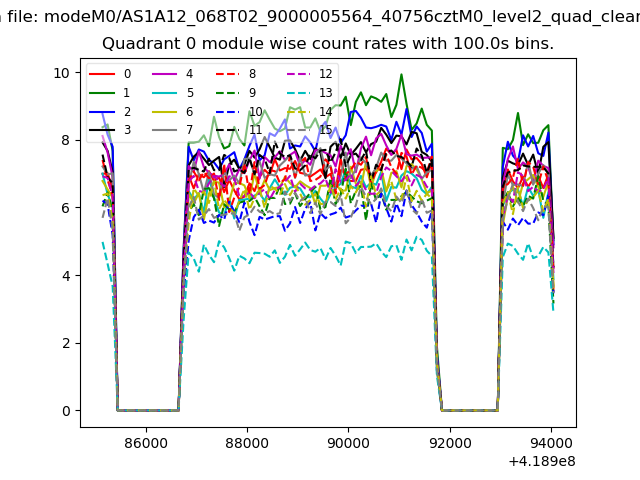 |
 |
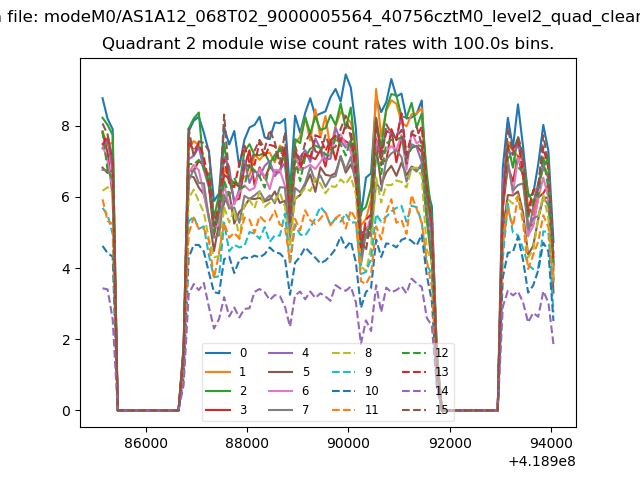
| Module-wise count rates for Quadrant B Data is divided into 100 sec bins |
 |
 |
| Module-wise count rates for Quadrant C Data is divided into 100 sec bins |
 |
 |
| Module-wise count rates for Quadrant D Data is divided into 100 sec bins |
 |
 |
| Parameter | Plot |
|---|---|
| CZT HV Monitor | 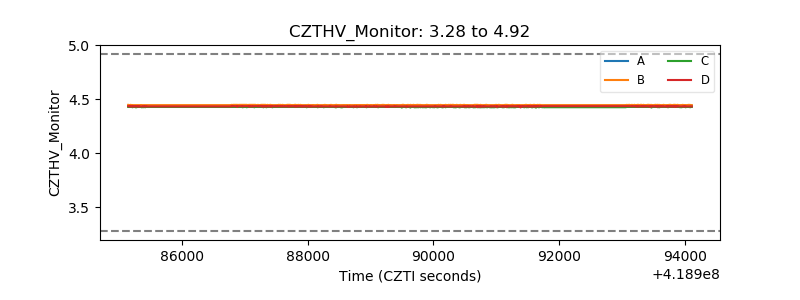 |
| D_VDD | 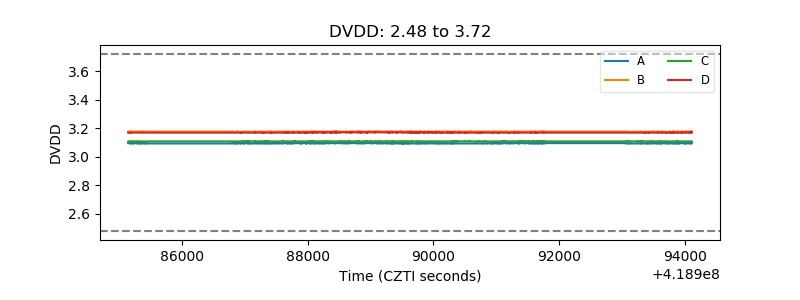 |
| Temperature 1 | 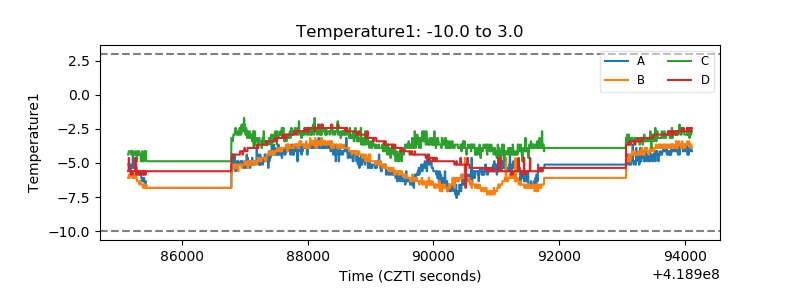 |
| Veto HV Monitor | 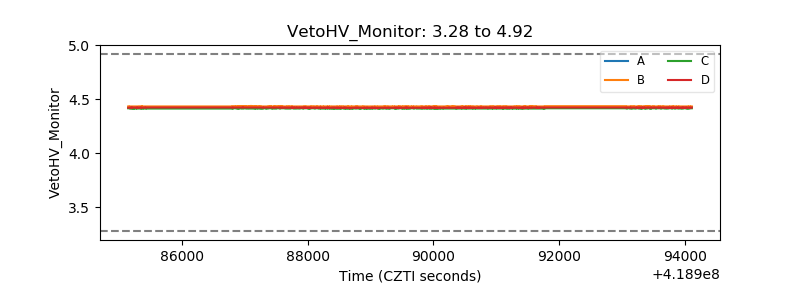 |
| Veto LLD | 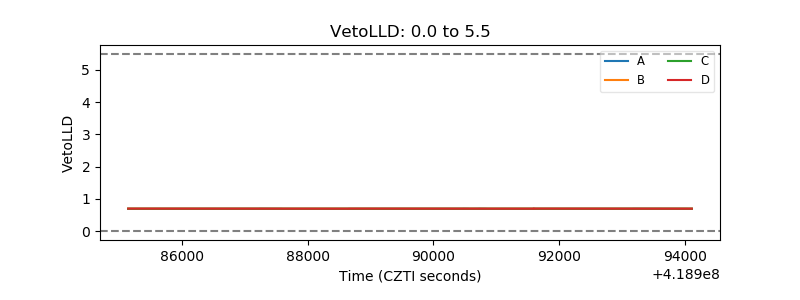 |
| Alpha Counter | 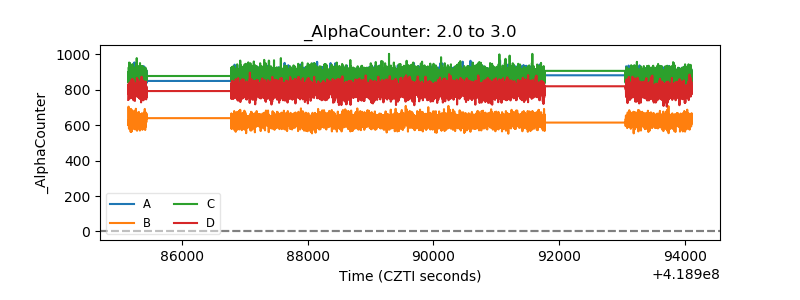 |
| _CPM_Rate | 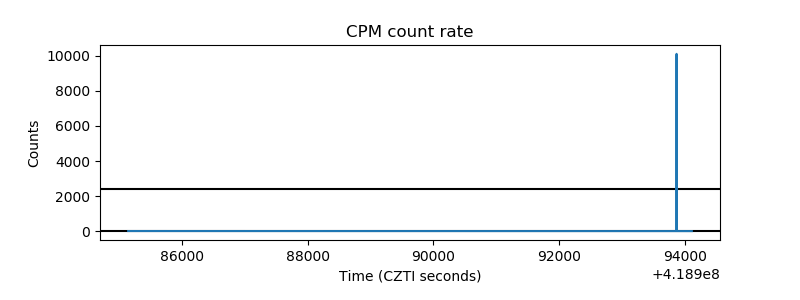 |
| CZT Counter | 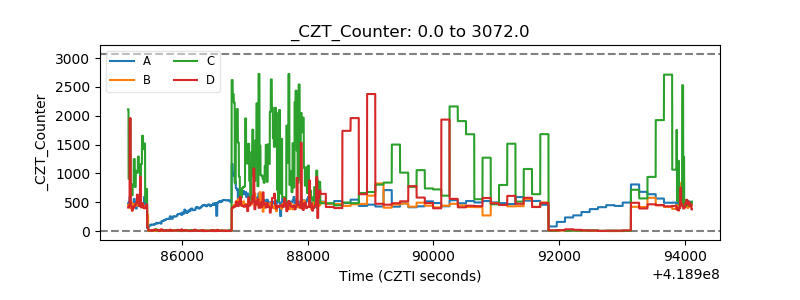 |
| +2.5 Volts monitor | 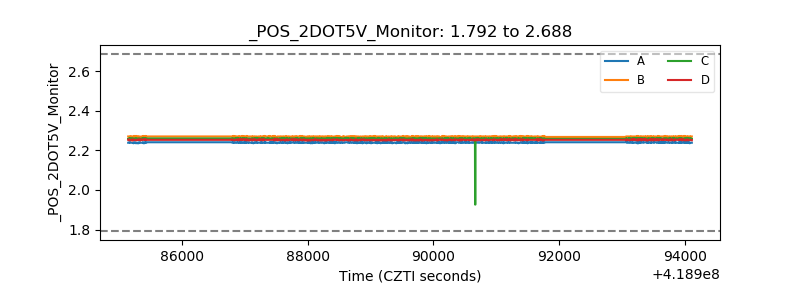 |
| +5 Volts monitor | 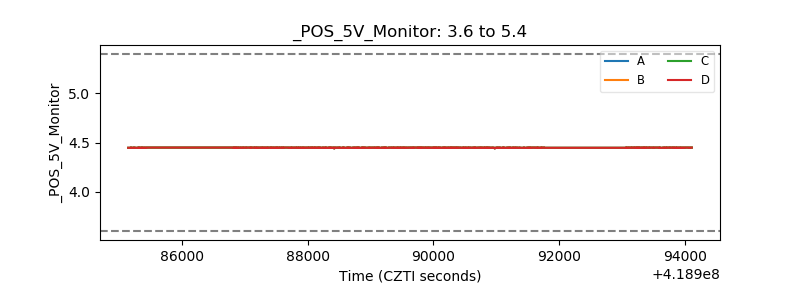 |
| _ROLL_ROT | 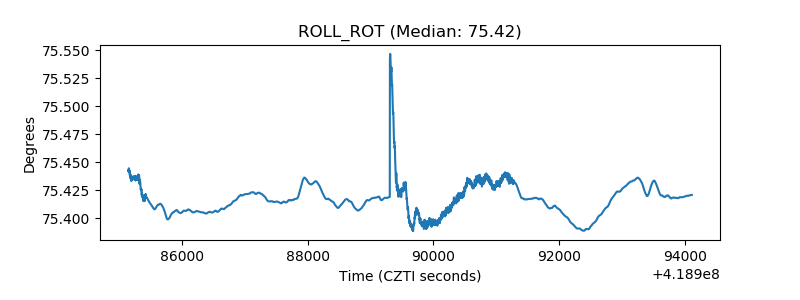 |
| _Roll_DEC | 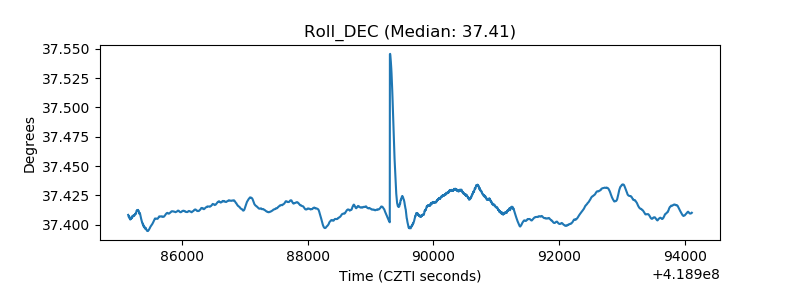 |
| _Roll_RA | 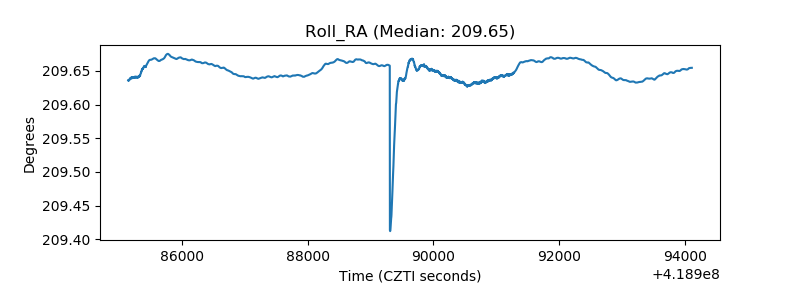 |
| Veto Counter | 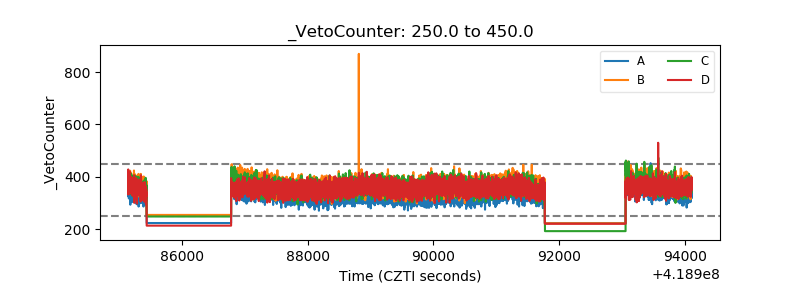 |