| Param | Original file | Final file |
|---|---|---|
| Filename | modeM0/AS1A12_068T02_9000005564_40758cztM0_level2.fits | modeM0/AS1A12_068T02_9000005564_40758cztM0_level2_quad_clean.evt |
| Size (bytes) | 235,287,360 | 51,048,000 |
| Size | 224.4 MB | 48.7 MB |
| Events in quadrant A | 1,691,282 | 361,032 |
| Events in quadrant B | 1,519,311 | 369,738 |
| Events in quadrant C | 3,484,953 | 308,456 |
| Events in quadrant D | 1,752,547 | 270,158 |
| Mode M0 | |||
|---|---|---|---|
| Quadrant | BADHDUFLAG | Total packets | Discarded packets |
| A | 0 | 7069 | 1 |
| B | 0 | 6823 | 1 |
| C | 0 | 12523 | 1 |
| D | 0 | 7513 | 1 |
| Mode SS | |||
|---|---|---|---|
| Quadrant | BADHDUFLAG | Total packets | Discarded packets |
| A | 0 | 68 | 0 |
| B | 0 | 68 | 0 |
| C | 0 | 68 | 0 |
| D | 0 | 68 | 0 |
| Mode M9 | |||
|---|---|---|---|
| Quadrant | BADHDUFLAG | Total packets | Discarded packets |
| A | 0 | 13 | 0 |
| B | 0 | 13 | 0 |
| C | 0 | 13 | 0 |
| D | 0 | 13 | 0 |
| Quadrant | Total seconds | Saturated seconds | Saturation percentage |
|---|---|---|---|
| A | 3331 | 6 | 0.180126% |
| B | 3331 | 8 | 0.240168% |
| C | 3331 | 497 | 14.920444% |
| D | 3331 | 636 | 19.093365% |
Noise dominated data is calculated using 1-second bins in cleaned event files. If a bin has >2000 counts, and if more than 50% of those come from <1% of pixels, then it is considered to be noise-dominated and hence unusable.
| Quadrant | # 1 sec bins | Bins with >0 counts | Bins with >2000 counts | High rate bins dominated by noise | Noise dominated (total time) | Noise dominated (detector-on time) | Marked lightcurve |
|---|---|---|---|---|---|---|---|
| A | 4615 | 3332 | 2 | 2 | 0.04% | 0.06% |  |
| B | 4615 | 3332 | 3 | 3 | 0.07% | 0.09% |  |
| C | 4615 | 3332 | 523 | 523 | 11.33% | 15.70% | 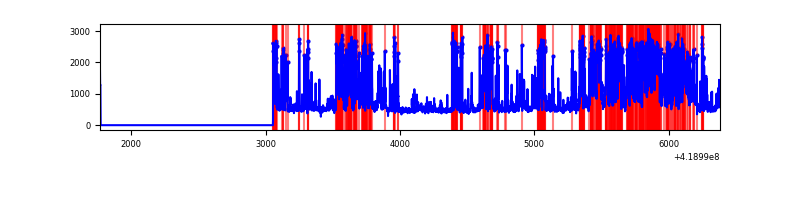 |
| D | 4615 | 3332 | 64 | 64 | 1.39% | 1.92% |  |
Top three noisy pixels from each quadrant. If the there are fewer than three noisy pixels in the level2.evt file, extra rows are filled as -1
| Pixel properties | Quadrant properties | ||||||
|---|---|---|---|---|---|---|---|
| Quadrant | DetID | PixID | Counts | Sigma | Mean | Median | Sigma |
| A | 10 | 83 | 268671 | 3518.82 | 365 | 359 | 76.3 |
| A | 12 | 189 | 6728 | 83.53 | 365 | 359 | 76.3 |
| A | 6 | 10 | 4359 | 52.46 | 365 | 359 | 76.3 |
| B | 0 | 229 | 32057 | 441.14 | 362 | 352 | 71.9 |
| B | 4 | 81 | 19894 | 271.9 | 362 | 352 | 71.9 |
| B | 5 | 252 | 14939 | 202.96 | 362 | 352 | 71.9 |
| C | 9 | 187 | 1990952 | 24787.74 | 340 | 342 | 80.3 |
| C | 15 | 214 | 136987 | 1701.55 | 340 | 342 | 80.3 |
| C | 14 | 254 | 12747 | 154.47 | 340 | 342 | 80.3 |
| D | 2 | 249 | 264632 | 3281.04 | 324 | 315 | 80.6 |
| D | 12 | 191 | 142790 | 1768.58 | 324 | 315 | 80.6 |
| D | 2 | 250 | 56579 | 698.42 | 324 | 315 | 80.6 |
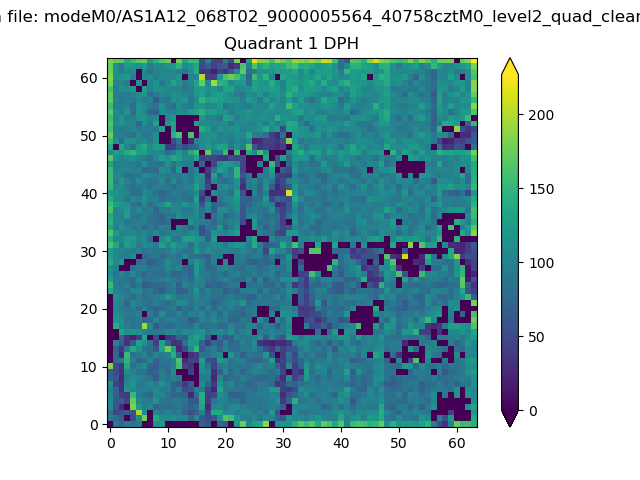
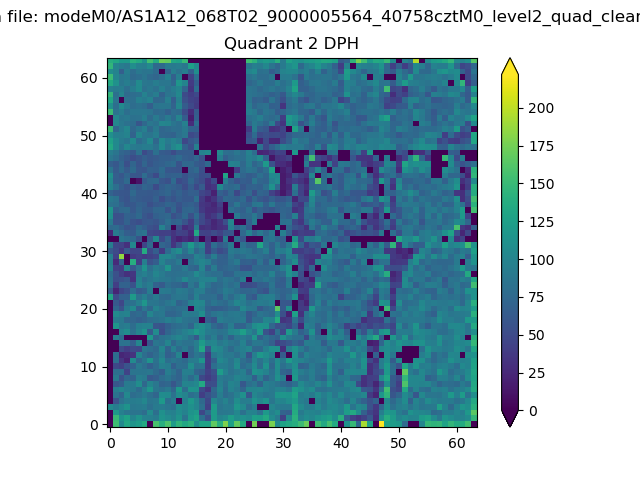
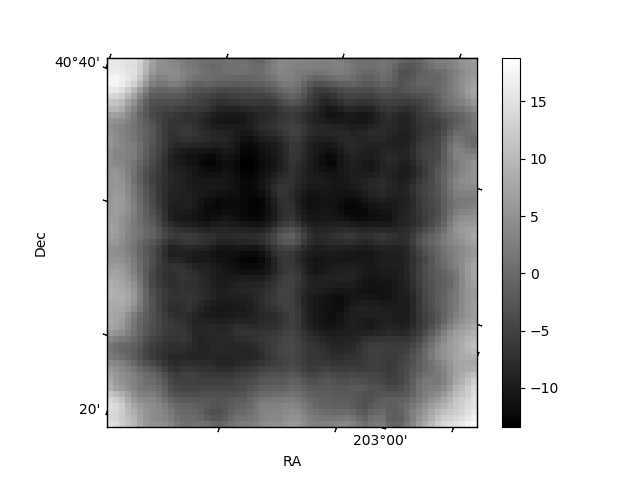
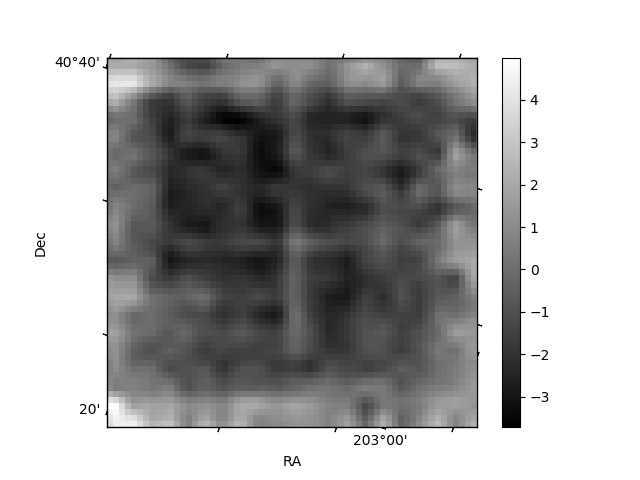
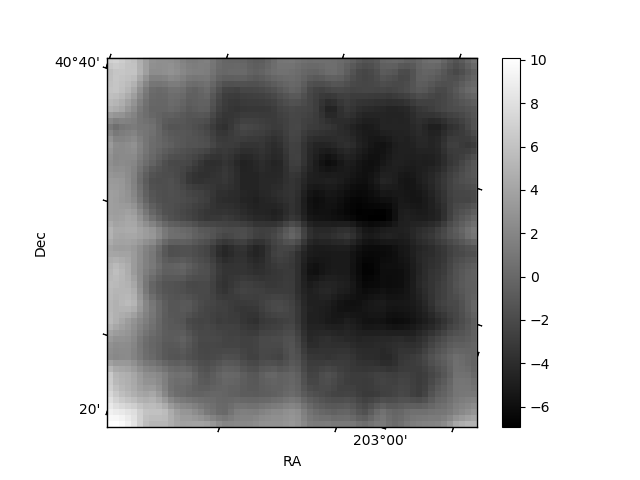
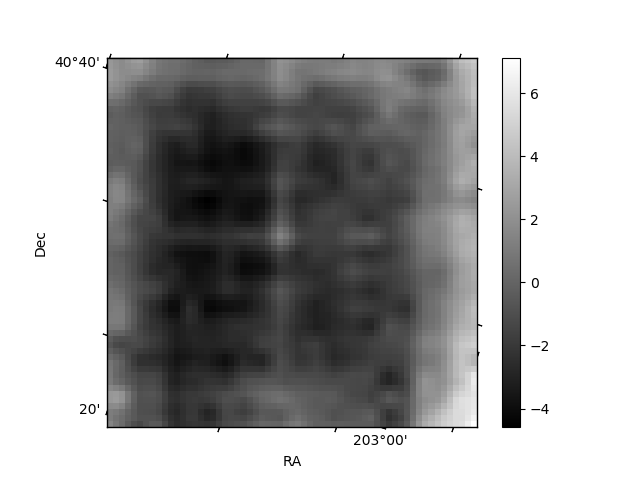
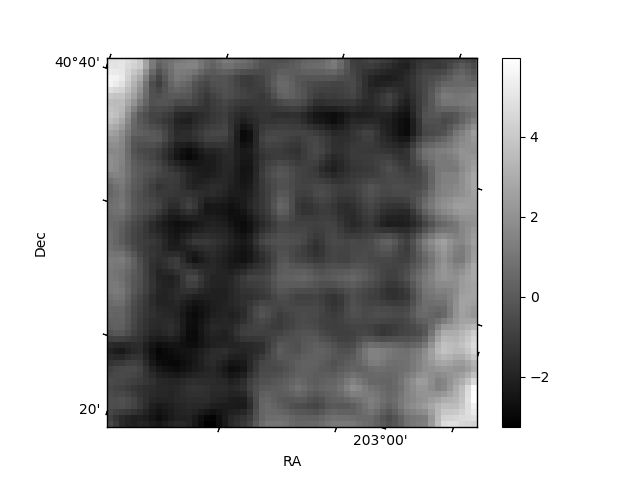
Histogram calculated using DETX and DETY for each event in the final _common_clean file
| Quadrant A |  |
 |
Quadrant B |
|---|---|---|---|
| Quadrant D | 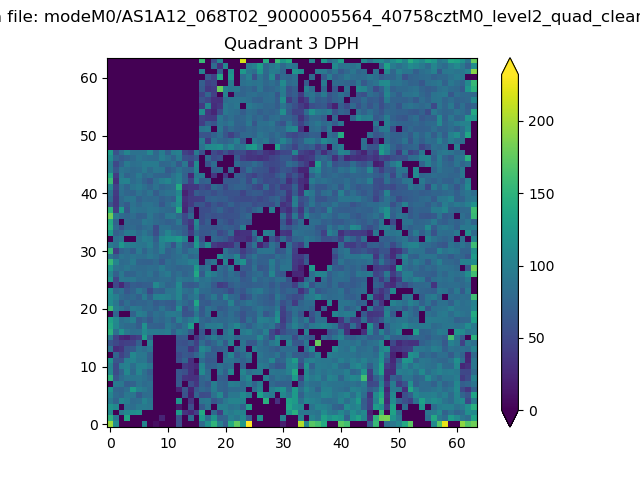 |
 |
Quadrant C |
| Plot type | Count rate plots | Images |
|---|---|---|
| Comparison with Poisson distribution Blue bars denote a histogram of data divided into 1 sec bins. Red curve is a Poisson curve with rate = median count rate of data. |
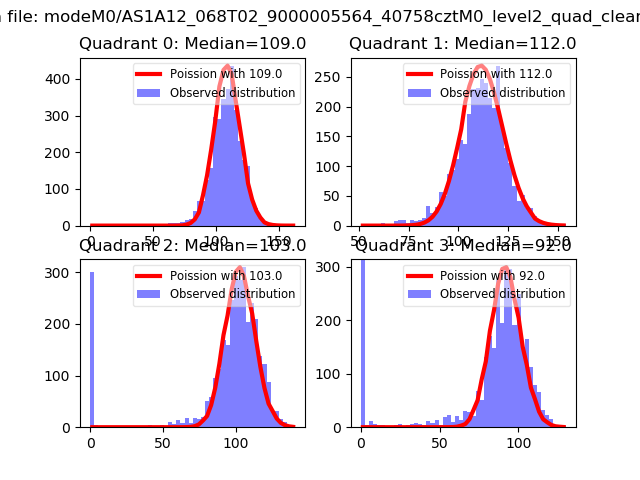 |
 |
| Quadrant-wise count rates Data is divided into 100 sec bins |
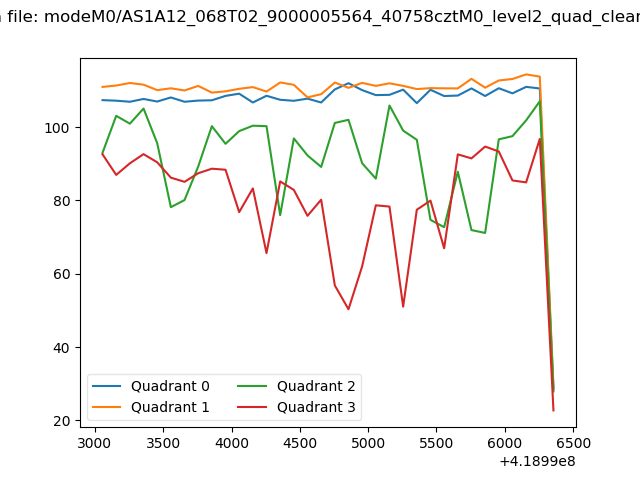 |
|
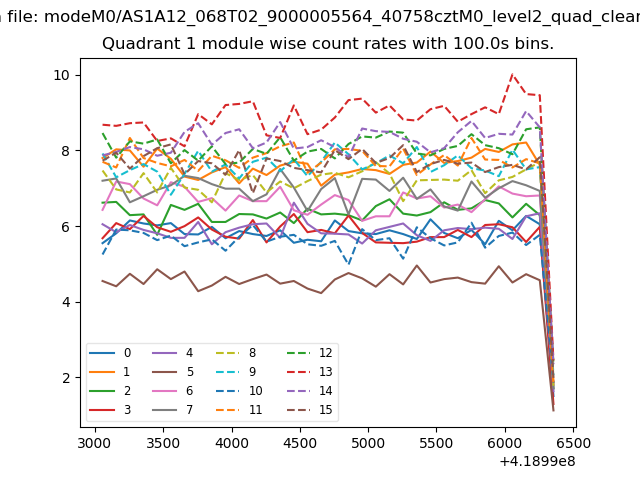
| Module-wise count rates for Quadrant A Data is divided into 100 sec bins |
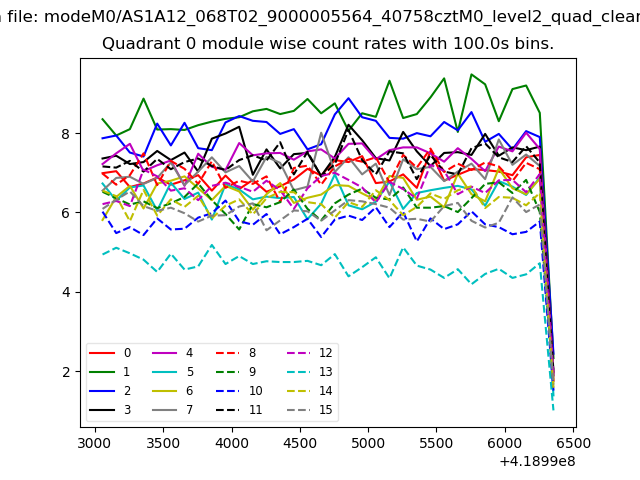 |
 |
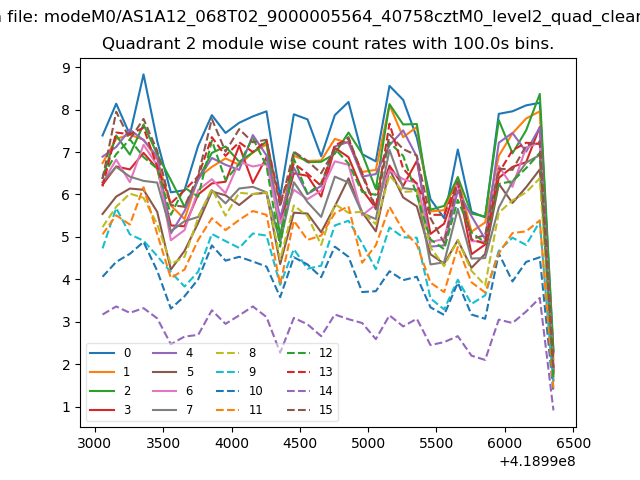
| Module-wise count rates for Quadrant B Data is divided into 100 sec bins |
 |
 |
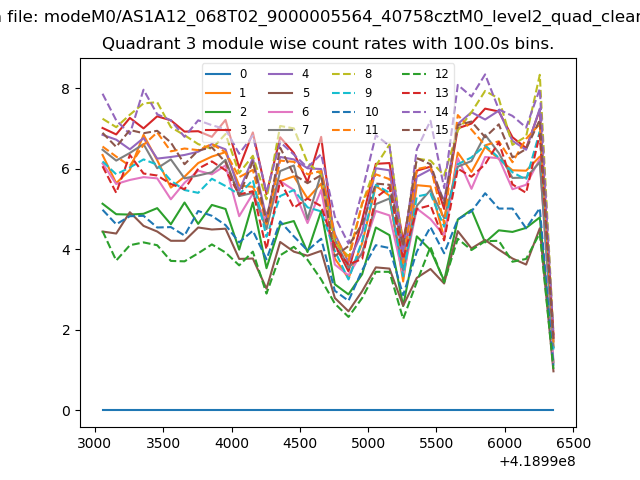
| Module-wise count rates for Quadrant C Data is divided into 100 sec bins |
 |
 |
| Module-wise count rates for Quadrant D Data is divided into 100 sec bins |
 |
 |
| Parameter | Plot |
|---|---|
| CZT HV Monitor | 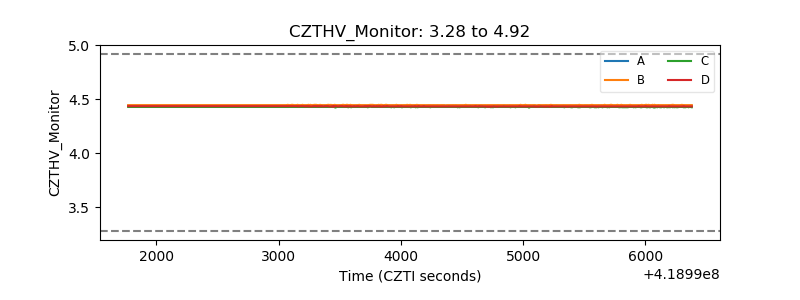 |
| D_VDD | 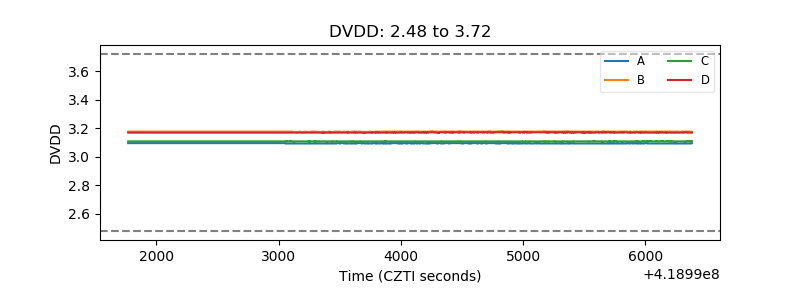 |
| Temperature 1 | 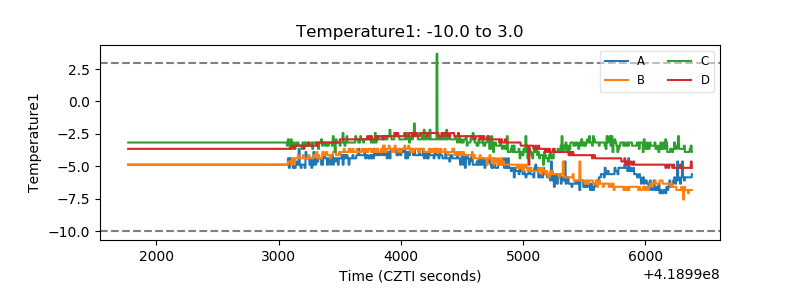 |
| Veto HV Monitor | 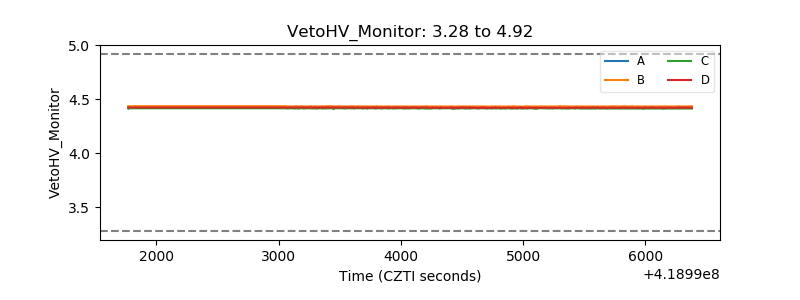 |
| Veto LLD | 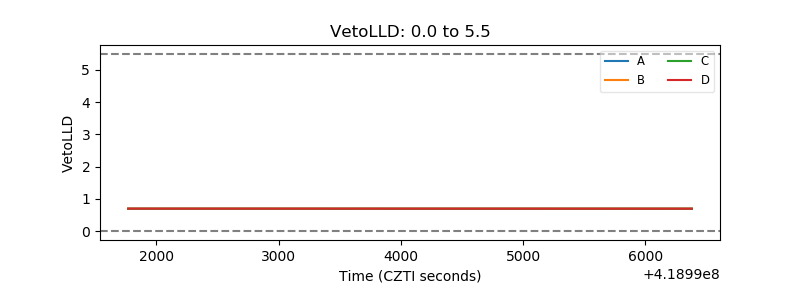 |
| Alpha Counter | 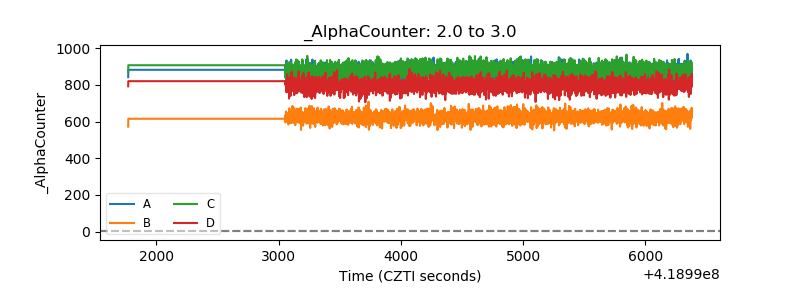 |
| _CPM_Rate |  |
| CZT Counter | 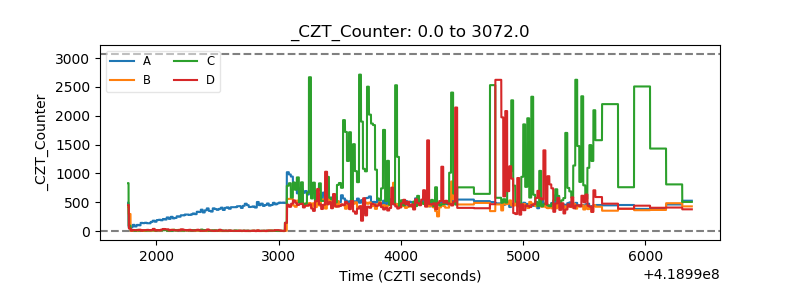 |
| +2.5 Volts monitor | 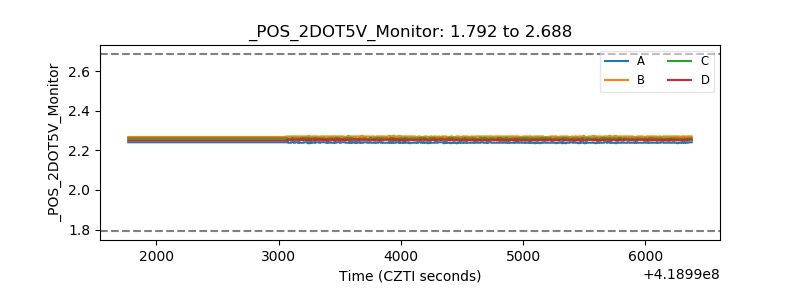 |
| +5 Volts monitor | 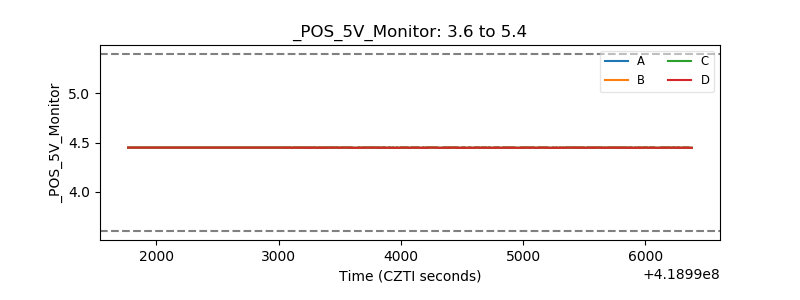 |
| _ROLL_ROT | 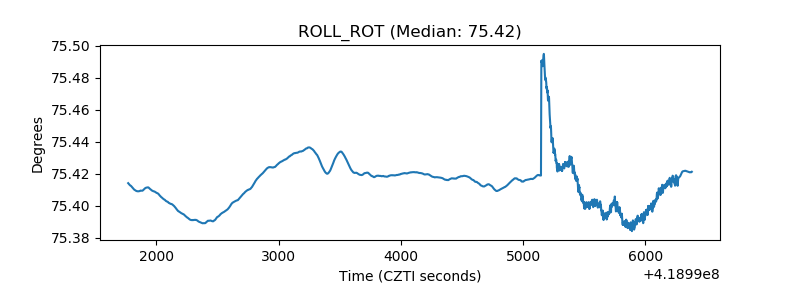 |
| _Roll_DEC | 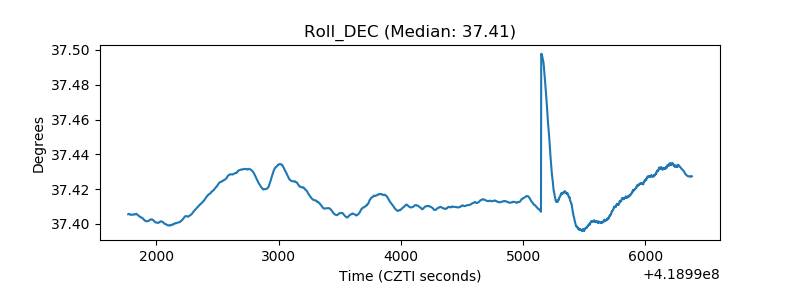 |
| _Roll_RA | 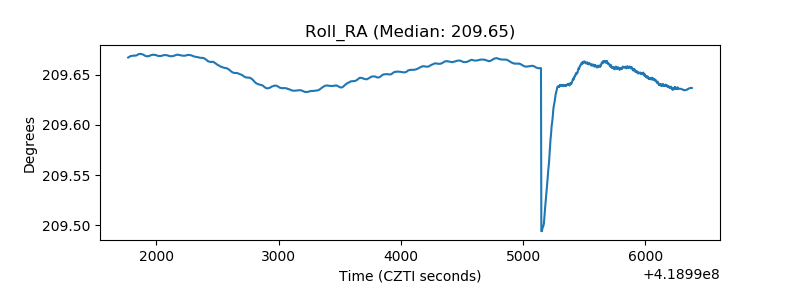 |
| Veto Counter | 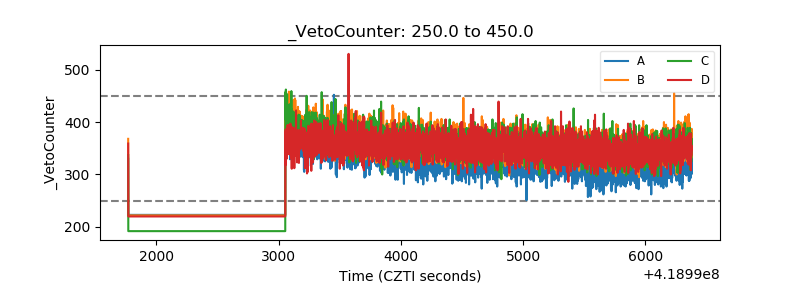 |