| Param | Original file | Final file |
|---|---|---|
| Filename | modeM0/AS1C07_001T10_9000005566_40758cztM0_level2.fits | modeM0/AS1C07_001T10_9000005566_40758cztM0_level2_quad_clean.evt |
| Size (bytes) | 573,448,320 | 102,265,920 |
| Size | 546.9 MB | 97.5 MB |
| Events in quadrant A | 3,705,058 | 757,224 |
| Events in quadrant B | 3,248,041 | 776,029 |
| Events in quadrant C | 9,795,191 | 517,391 |
| Events in quadrant D | 3,939,237 | 562,600 |
| Mode M9 | |||
|---|---|---|---|
| Quadrant | BADHDUFLAG | Total packets | Discarded packets |
| A | 0 | 28 | 0 |
| B | 0 | 28 | 0 |
| C | 0 | 28 | 0 |
| D | 0 | 28 | 0 |
| Mode M0 | |||
|---|---|---|---|
| Quadrant | BADHDUFLAG | Total packets | Discarded packets |
| A | 0 | 15262 | 3 |
| B | 0 | 14336 | 2 |
| C | 0 | 33852 | 2 |
| D | 0 | 16529 | 2 |
| Mode SS | |||
|---|---|---|---|
| Quadrant | BADHDUFLAG | Total packets | Discarded packets |
| A | 0 | 142 | 0 |
| B | 0 | 142 | 0 |
| C | 0 | 142 | 0 |
| D | 0 | 142 | 0 |
| Quadrant | Total seconds | Saturated seconds | Saturation percentage |
|---|---|---|---|
| A | 6930 | 20 | 0.288600% |
| B | 6930 | 25 | 0.360750% |
| C | 6930 | 2348 | 33.881674% |
| D | 6930 | 1420 | 20.490620% |
Noise dominated data is calculated using 1-second bins in cleaned event files. If a bin has >2000 counts, and if more than 50% of those come from <1% of pixels, then it is considered to be noise-dominated and hence unusable.
| Quadrant | # 1 sec bins | Bins with >0 counts | Bins with >2000 counts | High rate bins dominated by noise | Noise dominated (total time) | Noise dominated (detector-on time) | Marked lightcurve |
|---|---|---|---|---|---|---|---|
| A | 9708 | 6932 | 5 | 5 | 0.05% | 0.07% | 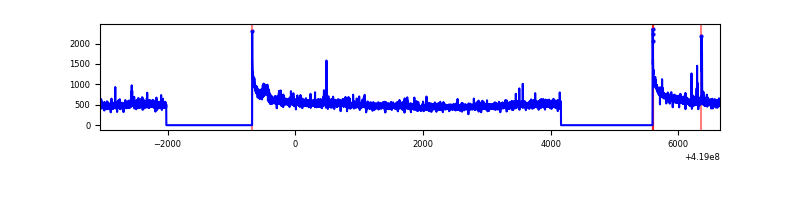 |
| B | 9708 | 6932 | 11 | 11 | 0.11% | 0.16% |  |
| C | 9708 | 6932 | 2205 | 2205 | 22.71% | 31.81% | 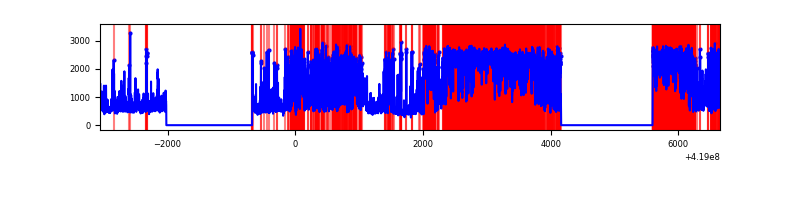 |
| D | 9708 | 6932 | 142 | 142 | 1.46% | 2.05% |  |
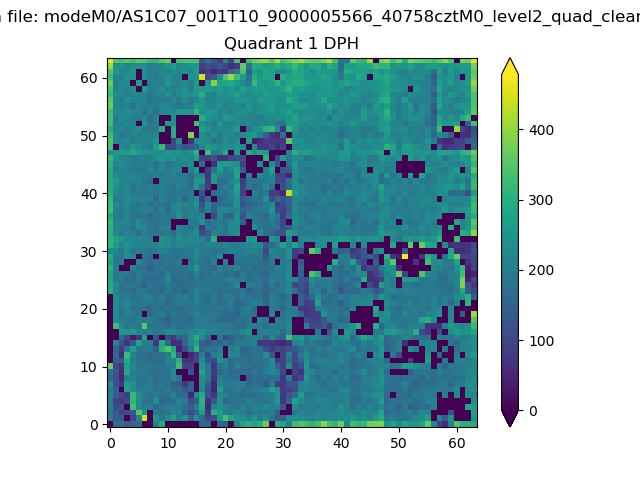
Top three noisy pixels from each quadrant. If the there are fewer than three noisy pixels in the level2.evt file, extra rows are filled as -1
| Pixel properties | Quadrant properties | ||||||
|---|---|---|---|---|---|---|---|
| Quadrant | DetID | PixID | Counts | Sigma | Mean | Median | Sigma |
| A | 10 | 83 | 601802 | 3831.32 | 768 | 750 | 156.9 |
| A | 6 | 10 | 65616 | 413.48 | 768 | 750 | 156.9 |
| A | 12 | 189 | 59026 | 371.47 | 768 | 750 | 156.9 |
| B | 0 | 229 | 124335 | 832.95 | 764 | 742 | 148.4 |
| B | 4 | 171 | 61546 | 409.79 | 764 | 742 | 148.4 |
| B | 0 | 190 | 35887 | 236.86 | 764 | 742 | 148.4 |
| C | 9 | 187 | 6954027 | 46855.7 | 642 | 646 | 148.4 |
| C | 15 | 214 | 253755 | 1705.59 | 642 | 646 | 148.4 |
| C | 0 | 10 | 42983 | 285.29 | 642 | 646 | 148.4 |
| D | 2 | 249 | 669718 | 4072.33 | 665 | 646 | 164.3 |
| D | 12 | 191 | 289880 | 1760.43 | 665 | 646 | 164.3 |
| D | 2 | 250 | 187257 | 1135.81 | 665 | 646 | 164.3 |
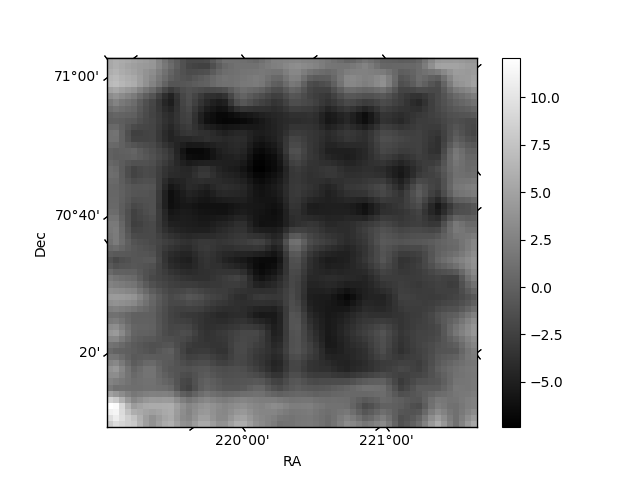
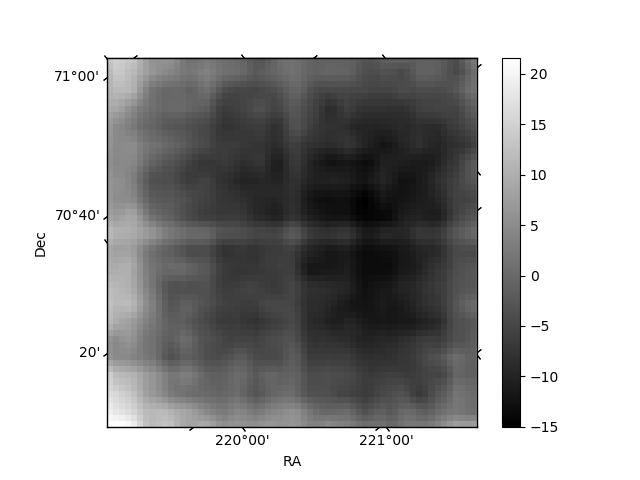
Histogram calculated using DETX and DETY for each event in the final _common_clean file
| Quadrant A | 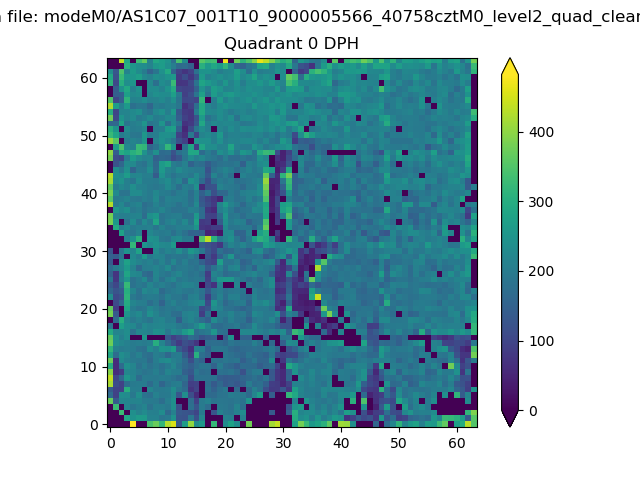 |
 |
Quadrant B |
|---|---|---|---|
| Quadrant D | 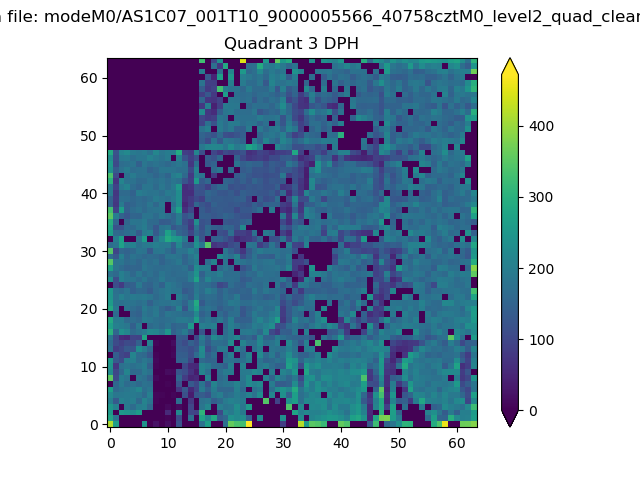 |
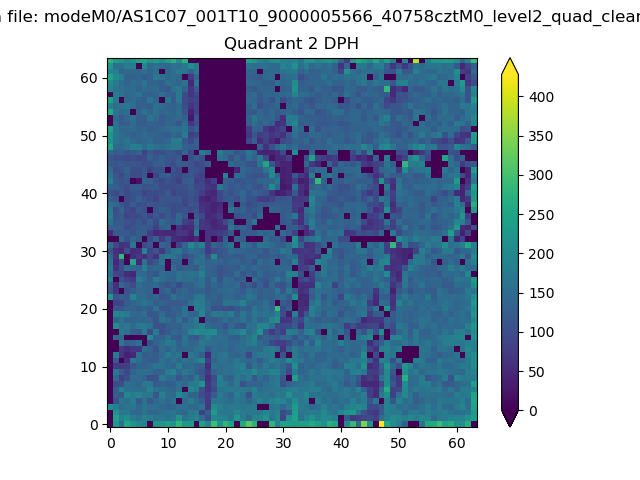 |
Quadrant C |
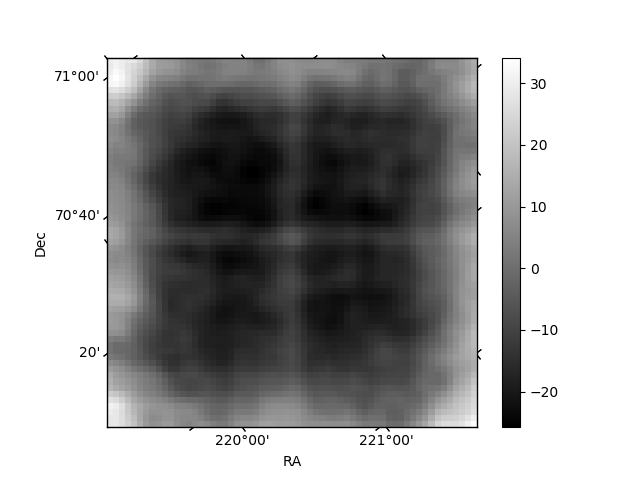
| Plot type | Count rate plots | Images |
|---|---|---|
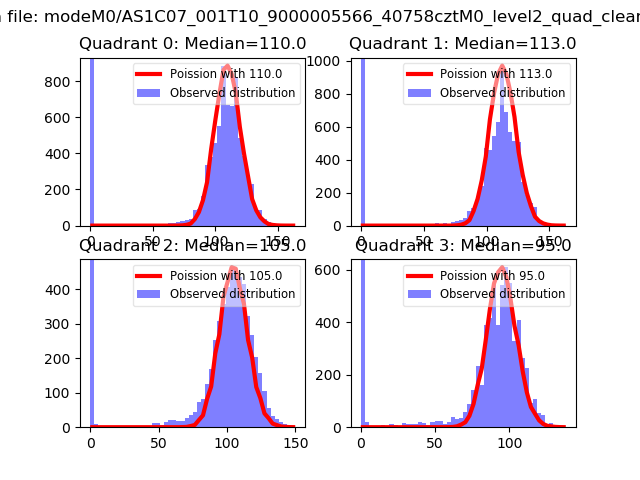
| Comparison with Poisson distribution Blue bars denote a histogram of data divided into 1 sec bins. Red curve is a Poisson curve with rate = median count rate of data. |
 |
 |
| Quadrant-wise count rates Data is divided into 100 sec bins |
 |
|
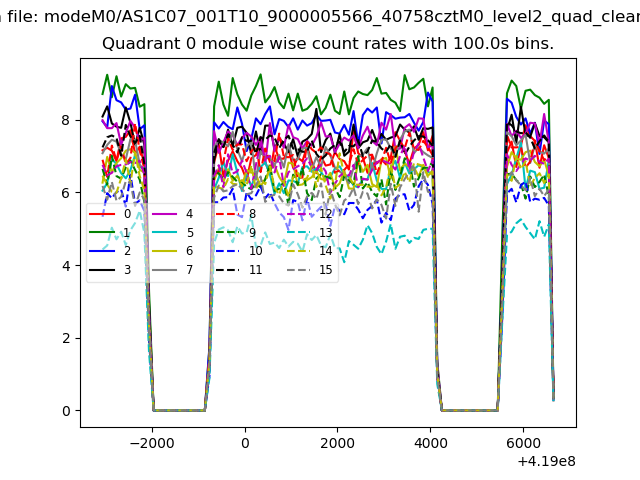
| Module-wise count rates for Quadrant A Data is divided into 100 sec bins |
 |
 |
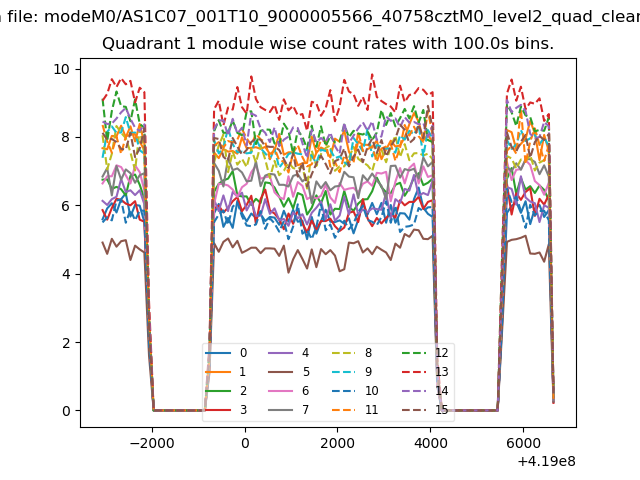
| Module-wise count rates for Quadrant B Data is divided into 100 sec bins |
 |
 |
| Module-wise count rates for Quadrant C Data is divided into 100 sec bins |
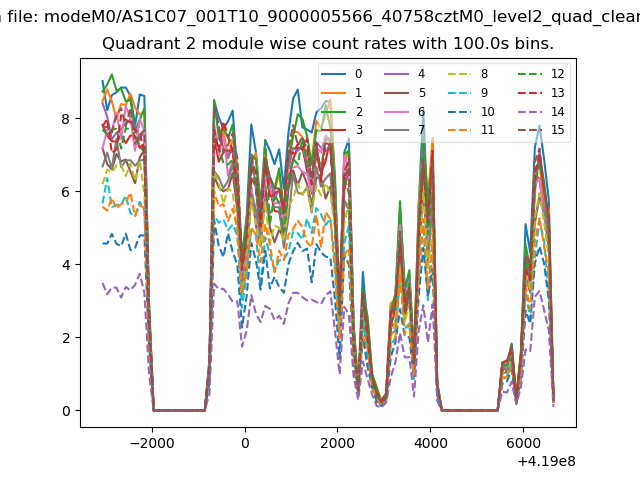 |
 |
| Module-wise count rates for Quadrant D Data is divided into 100 sec bins |
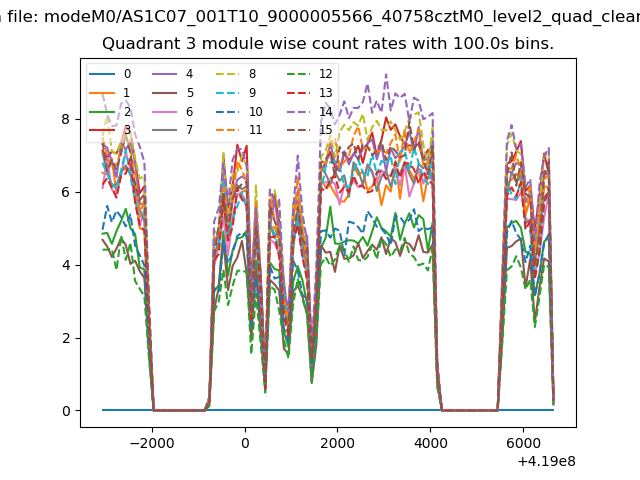 |
 |
| Parameter | Plot |
|---|---|
| CZT HV Monitor | 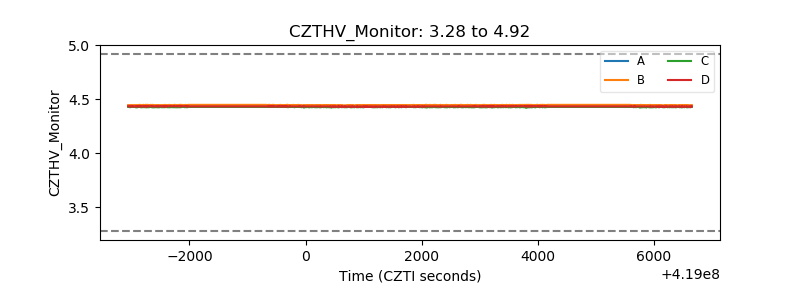 |
| D_VDD | 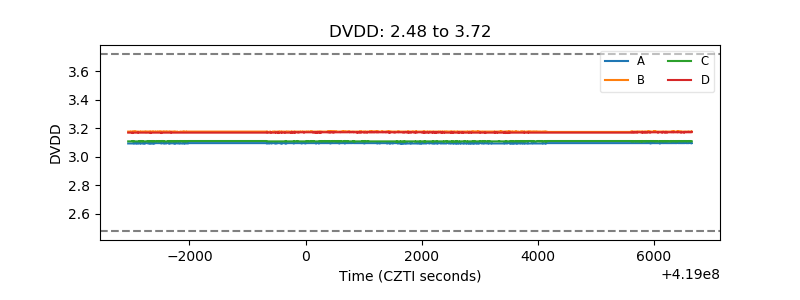 |
| Temperature 1 |  |
| Veto HV Monitor | 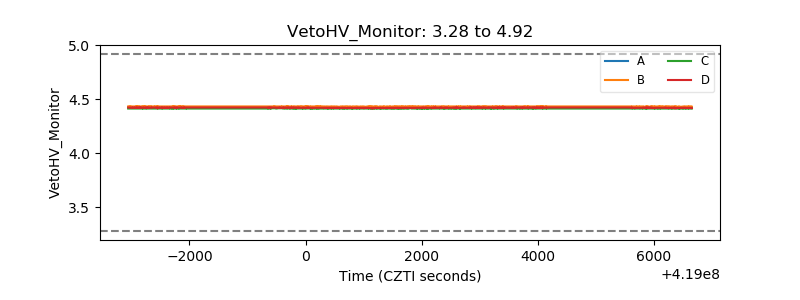 |
| Veto LLD | 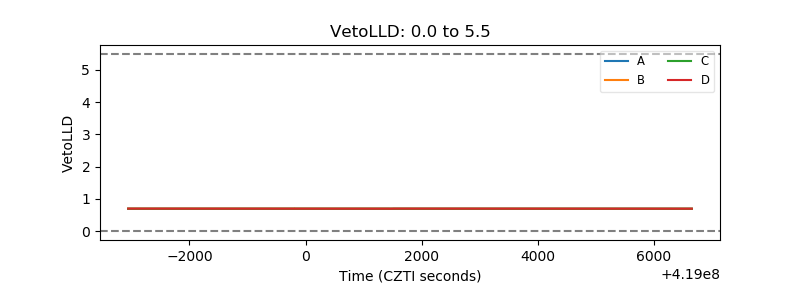 |
| Alpha Counter |  |
| _CPM_Rate |  |
| CZT Counter | 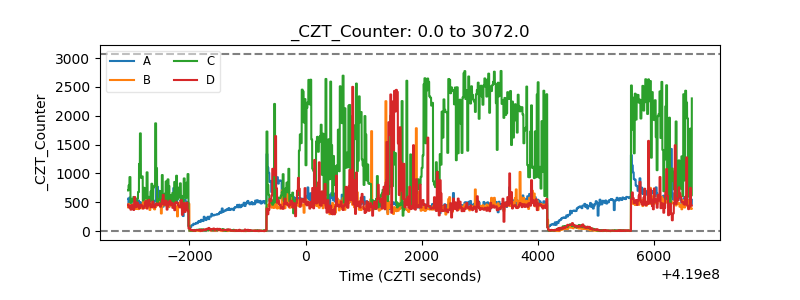 |
| +2.5 Volts monitor | 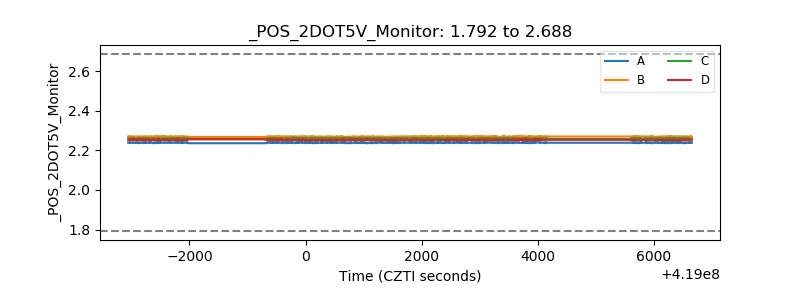 |
| +5 Volts monitor |  |
| _ROLL_ROT | 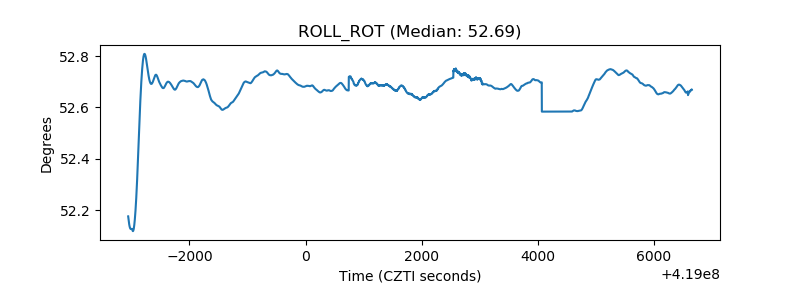 |
| _Roll_DEC | 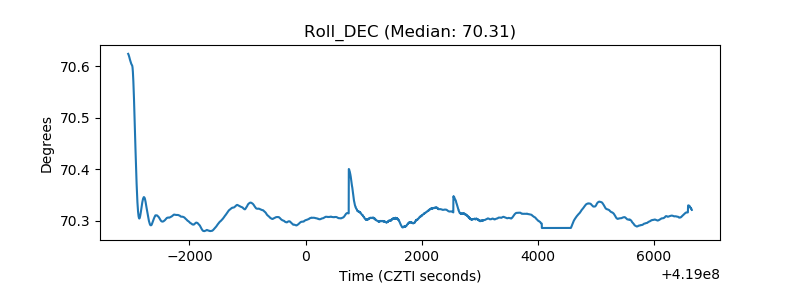 |
| _Roll_RA | 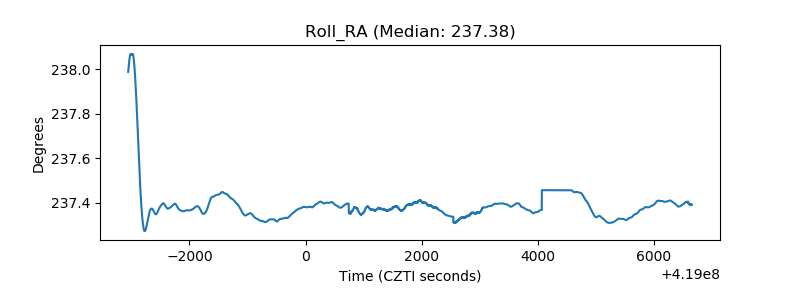 |
| Veto Counter | 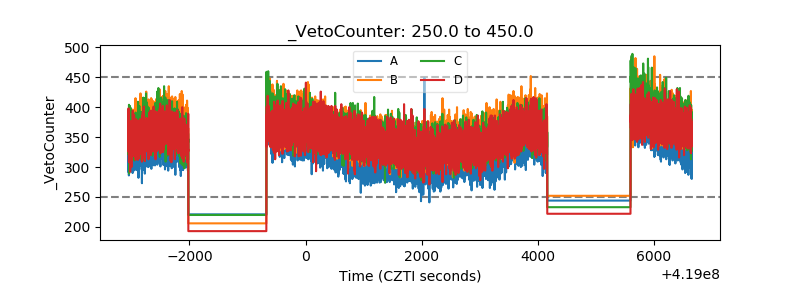 |