| Param | Original file | Final file |
|---|---|---|
| Filename | modeM0/AS1C07_001T10_9000005566_40759cztM0_level2.fits | modeM0/AS1C07_001T10_9000005566_40759cztM0_level2_quad_clean.evt |
| Size (bytes) | 491,224,320 | 86,184,000 |
| Size | 468.5 MB | 82.2 MB |
| Events in quadrant A | 3,506,648 | 621,977 |
| Events in quadrant B | 2,632,045 | 642,546 |
| Events in quadrant C | 8,612,500 | 430,874 |
| Events in quadrant D | 2,987,107 | 513,524 |
| Mode M9 | |||
|---|---|---|---|
| Quadrant | BADHDUFLAG | Total packets | Discarded packets |
| A | 0 | 18 | 0 |
| B | 0 | 18 | 0 |
| C | 0 | 18 | 0 |
| D | 0 | 19 | 0 |
| Mode M0 | |||
|---|---|---|---|
| Quadrant | BADHDUFLAG | Total packets | Discarded packets |
| A | 0 | 14100 | 3 |
| B | 0 | 11817 | 2 |
| C | 0 | 29507 | 2 |
| D | 0 | 12850 | 2 |
| Mode SS | |||
|---|---|---|---|
| Quadrant | BADHDUFLAG | Total packets | Discarded packets |
| A | 0 | 118 | 0 |
| B | 0 | 118 | 0 |
| C | 0 | 118 | 0 |
| D | 0 | 118 | 0 |
| Quadrant | Total seconds | Saturated seconds | Saturation percentage |
|---|---|---|---|
| A | 5718 | 80 | 1.399091% |
| B | 5718 | 22 | 0.384750% |
| C | 5718 | 2080 | 36.376355% |
| D | 5718 | 652 | 11.402588% |
Noise dominated data is calculated using 1-second bins in cleaned event files. If a bin has >2000 counts, and if more than 50% of those come from <1% of pixels, then it is considered to be noise-dominated and hence unusable.
| Quadrant | # 1 sec bins | Bins with >0 counts | Bins with >2000 counts | High rate bins dominated by noise | Noise dominated (total time) | Noise dominated (detector-on time) | Marked lightcurve |
|---|---|---|---|---|---|---|---|
| A | 7270 | 5719 | 43 | 43 | 0.59% | 0.75% | 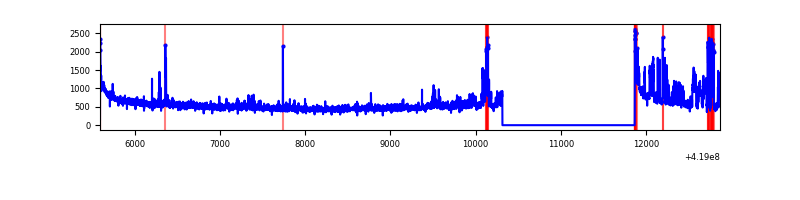 |
| B | 7270 | 5719 | 6 | 6 | 0.08% | 0.10% | 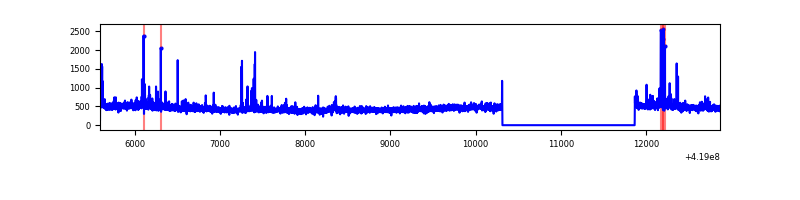 |
| C | 7270 | 5719 | 1926 | 1926 | 26.49% | 33.68% | 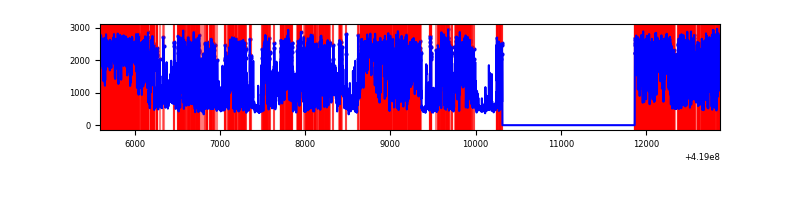 |
| D | 7270 | 5719 | 64 | 64 | 0.88% | 1.12% | 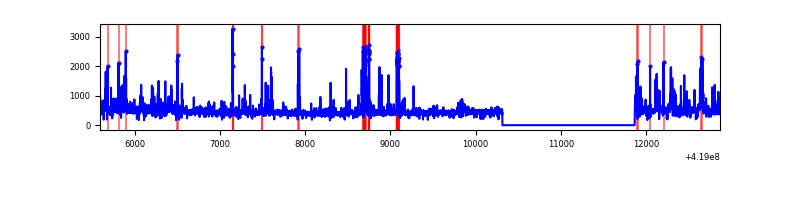 |
Top three noisy pixels from each quadrant. If the there are fewer than three noisy pixels in the level2.evt file, extra rows are filled as -1
| Pixel properties | Quadrant properties | ||||||
|---|---|---|---|---|---|---|---|
| Quadrant | DetID | PixID | Counts | Sigma | Mean | Median | Sigma |
| A | 10 | 83 | 538243 | 4156.61 | 627 | 614 | 129.3 |
| A | 6 | 10 | 428020 | 3304.44 | 627 | 614 | 129.3 |
| A | 12 | 189 | 77331 | 593.13 | 627 | 614 | 129.3 |
| B | 0 | 229 | 98511 | 805.04 | 626 | 609 | 121.6 |
| B | 4 | 171 | 31015 | 250.03 | 626 | 609 | 121.6 |
| B | 0 | 190 | 27900 | 224.41 | 626 | 609 | 121.6 |
| C | 9 | 187 | 6263884 | 51215.79 | 525 | 526 | 122.3 |
| C | 15 | 214 | 209398 | 1707.96 | 525 | 526 | 122.3 |
| C | 0 | 10 | 67104 | 544.41 | 525 | 526 | 122.3 |
| D | 12 | 191 | 187678 | 1311.0 | 578 | 561 | 142.7 |
| D | 2 | 249 | 148903 | 1039.33 | 578 | 561 | 142.7 |
| D | 9 | 19 | 105677 | 736.48 | 578 | 561 | 142.7 |
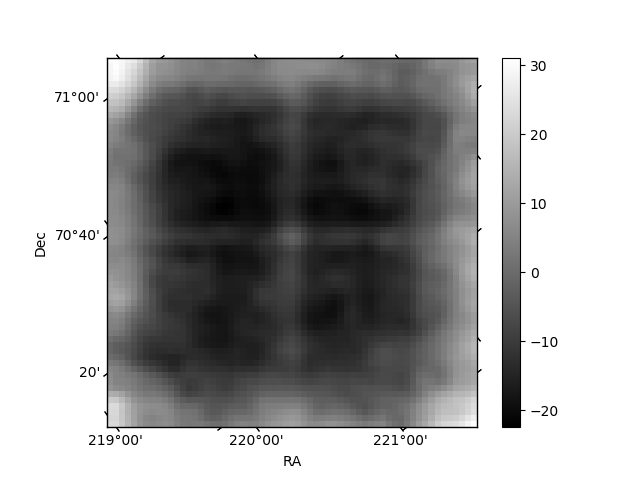
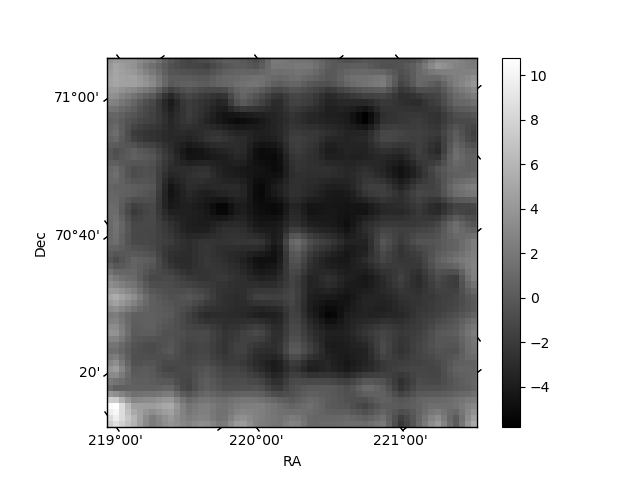
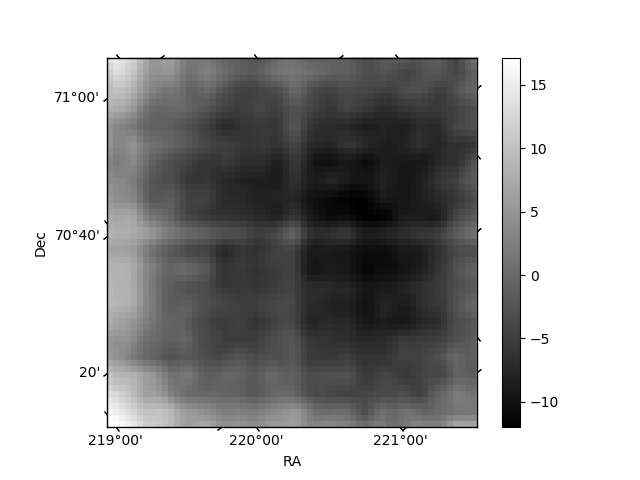
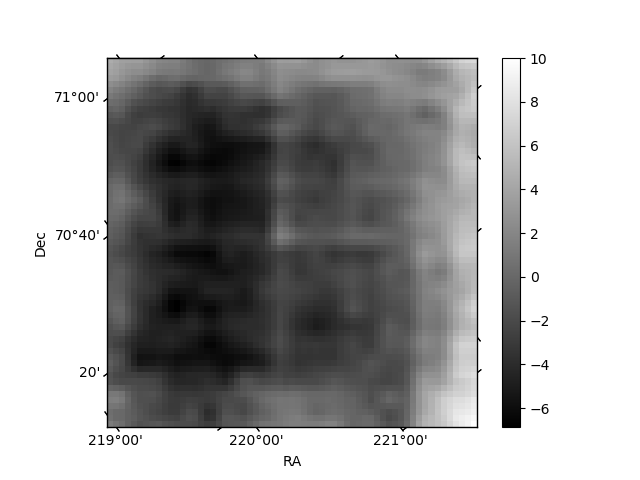
Histogram calculated using DETX and DETY for each event in the final _common_clean file
| Quadrant A | 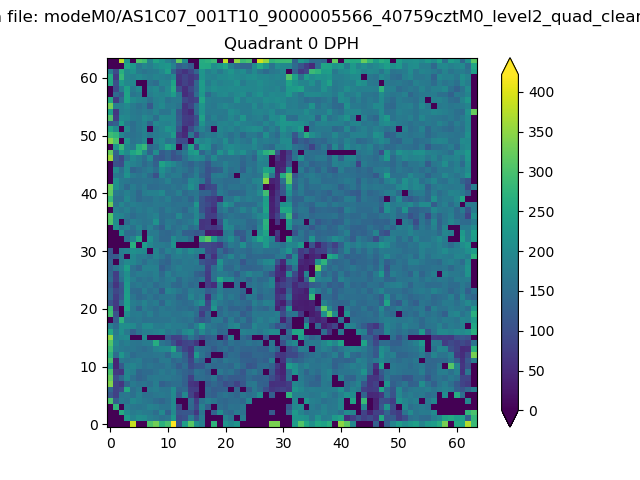 |
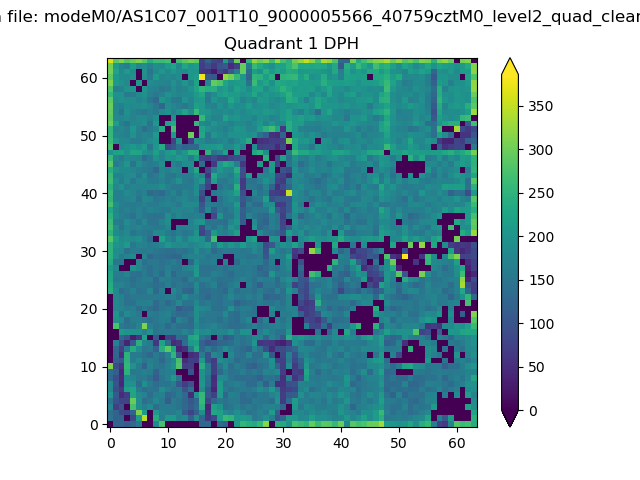 |
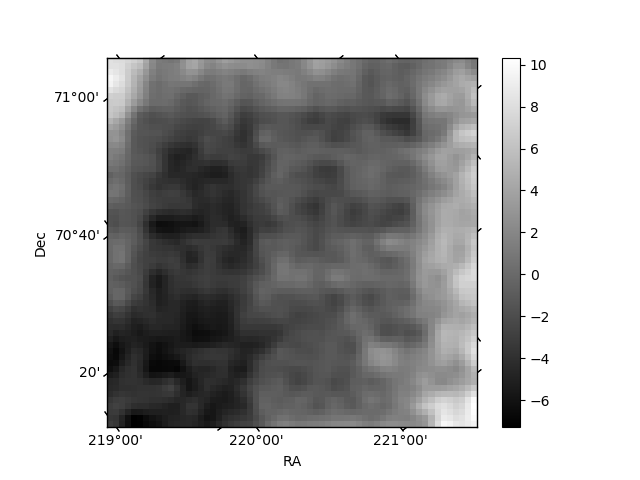
Quadrant B |
|---|---|---|---|
| Quadrant D | 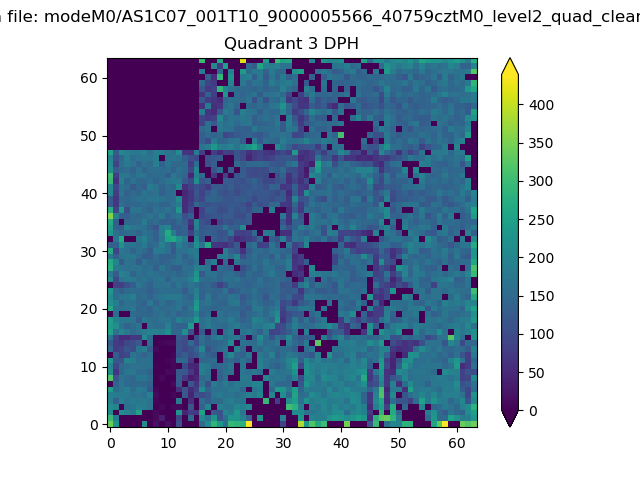 |
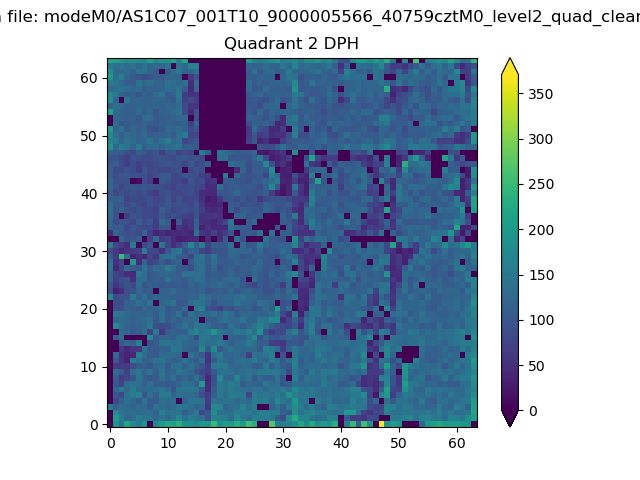 |
Quadrant C |
| Plot type | Count rate plots | Images |
|---|---|---|
| Comparison with Poisson distribution Blue bars denote a histogram of data divided into 1 sec bins. Red curve is a Poisson curve with rate = median count rate of data. |
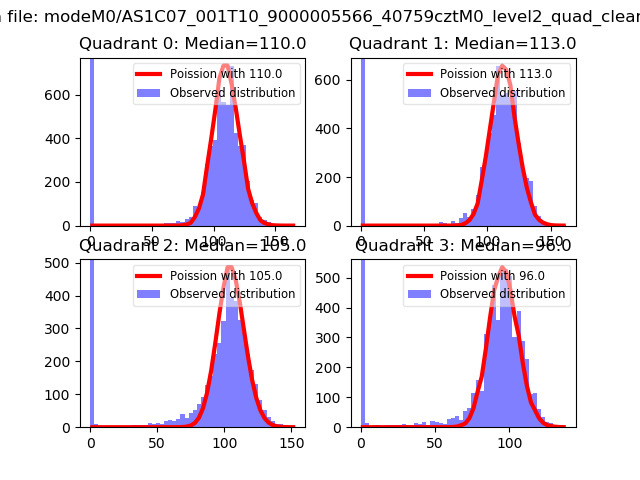 |
 |
| Quadrant-wise count rates Data is divided into 100 sec bins |
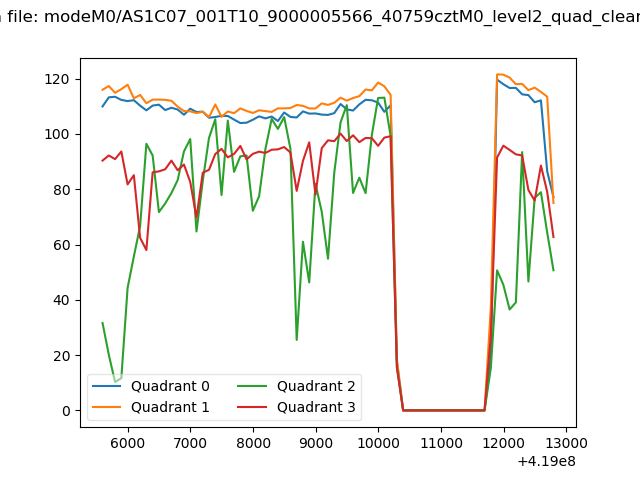 |
|
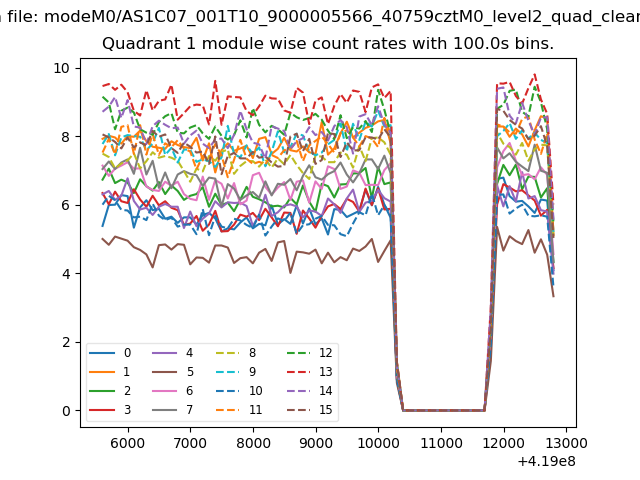
| Module-wise count rates for Quadrant A Data is divided into 100 sec bins |
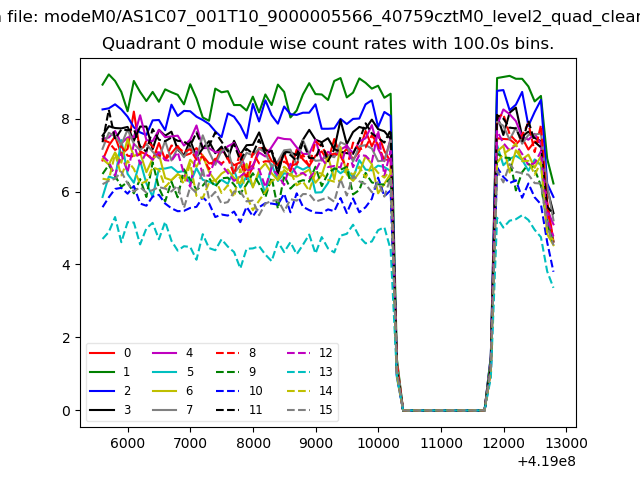 |
 |
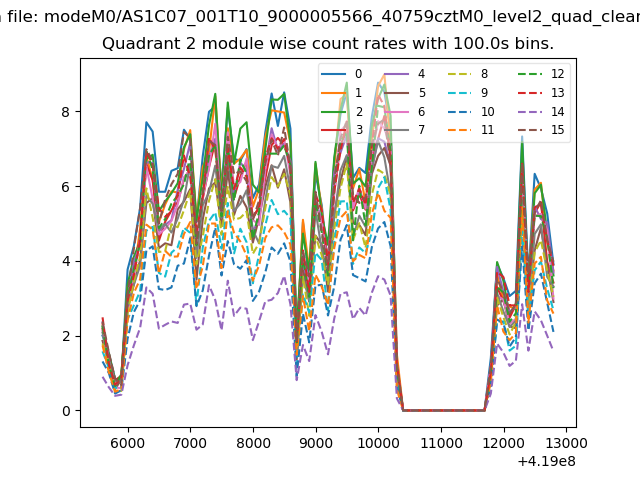
| Module-wise count rates for Quadrant B Data is divided into 100 sec bins |
 |
 |
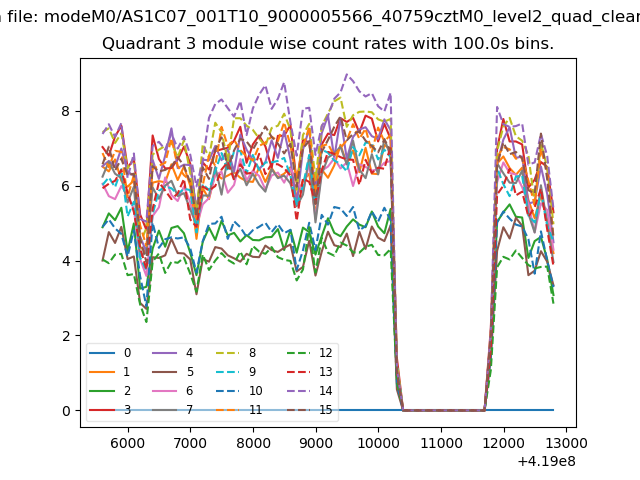
| Module-wise count rates for Quadrant C Data is divided into 100 sec bins |
 |
 |
| Module-wise count rates for Quadrant D Data is divided into 100 sec bins |
 |
 |
| Parameter | Plot |
|---|---|
| CZT HV Monitor | 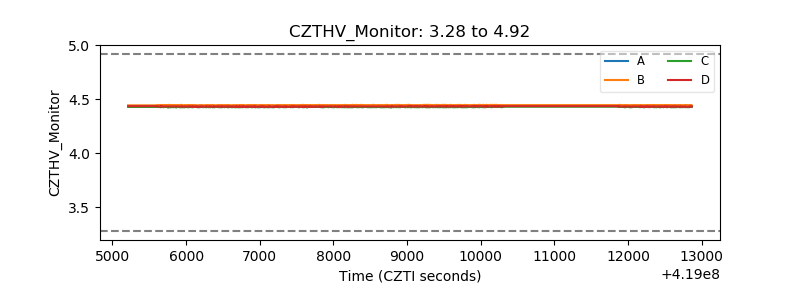 |
| D_VDD | 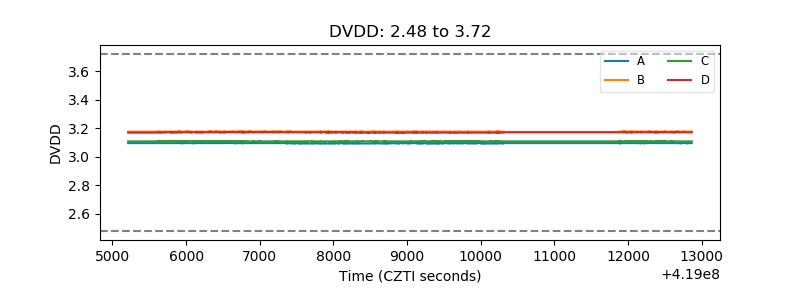 |
| Temperature 1 | 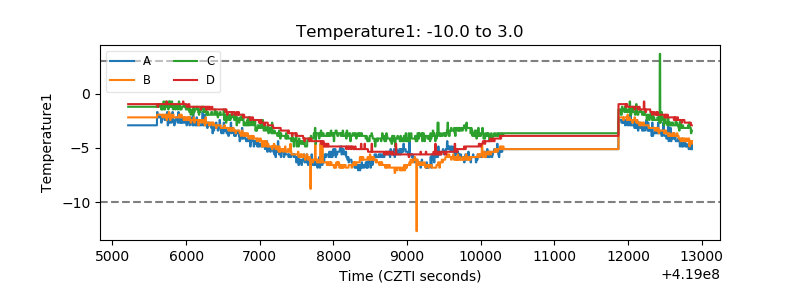 |
| Veto HV Monitor | 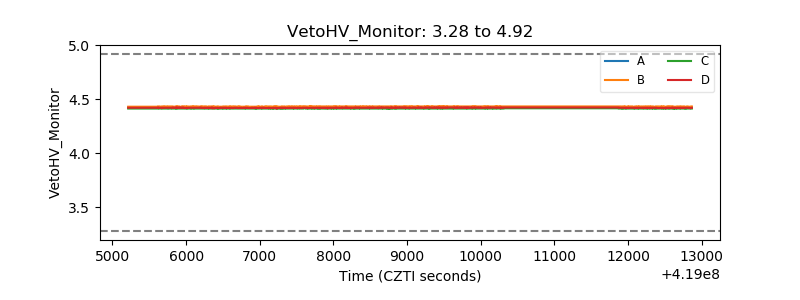 |
| Veto LLD | 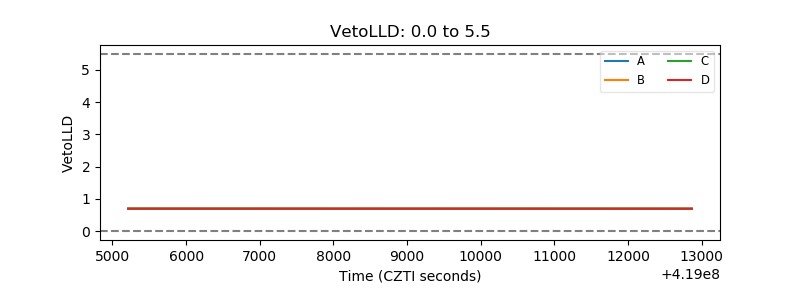 |
| Alpha Counter | 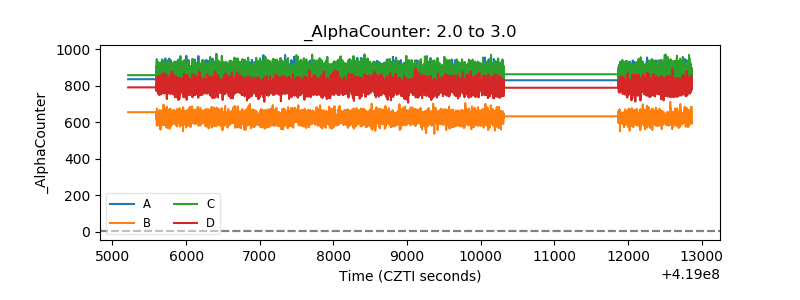 |
| _CPM_Rate | 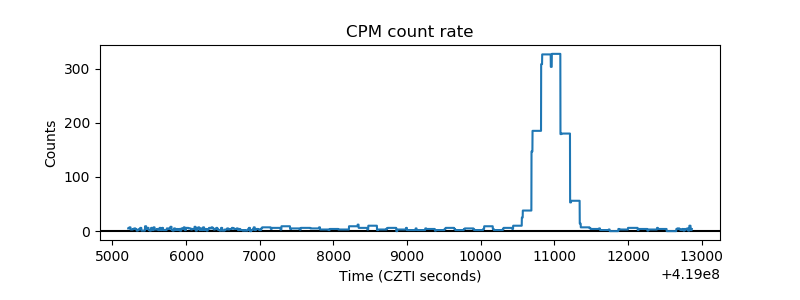 |
| CZT Counter | 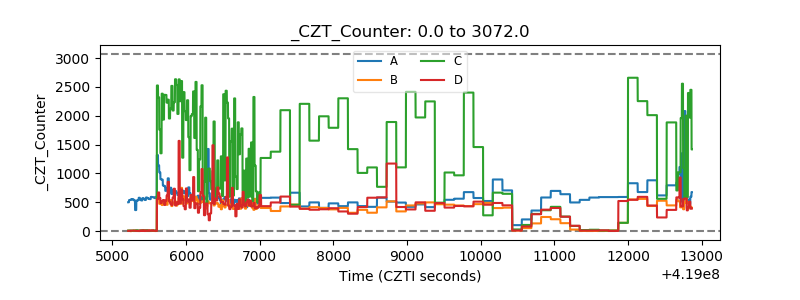 |
| +2.5 Volts monitor | 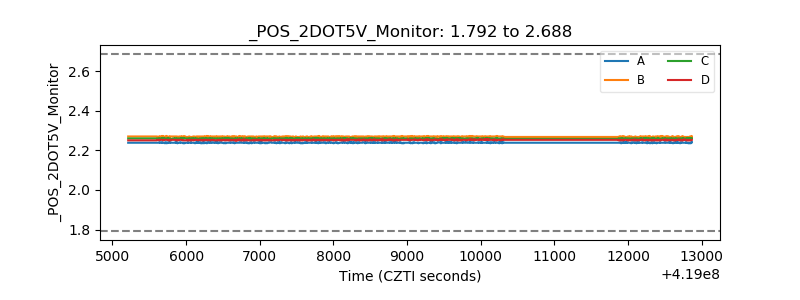 |
| +5 Volts monitor | 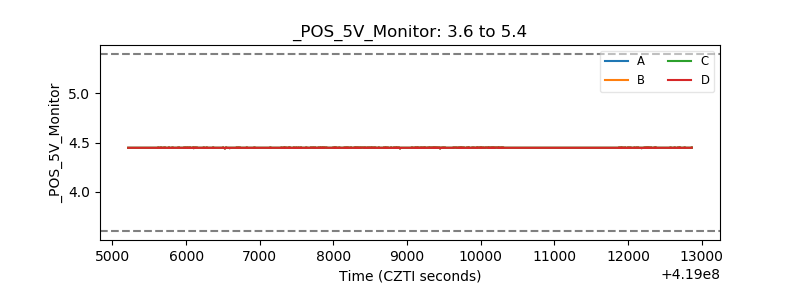 |
| _ROLL_ROT | 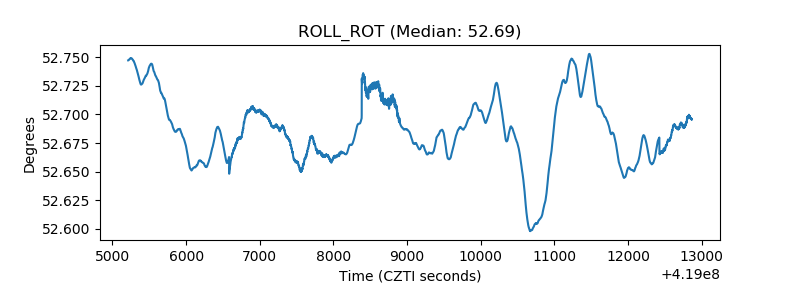 |
| _Roll_DEC | 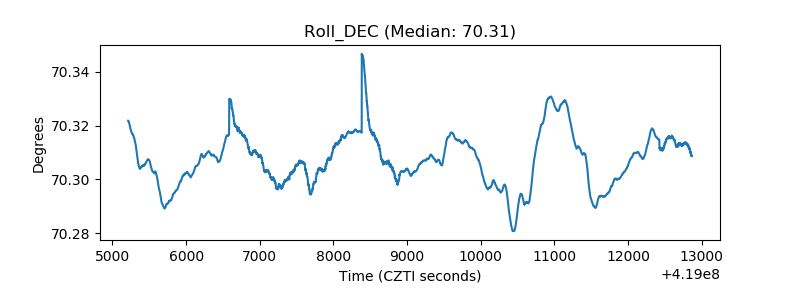 |
| _Roll_RA | 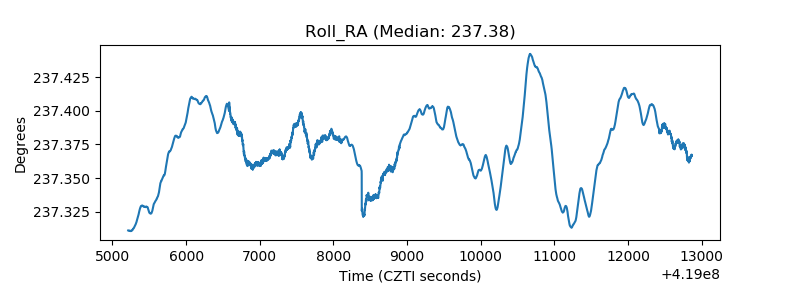 |
| Veto Counter | 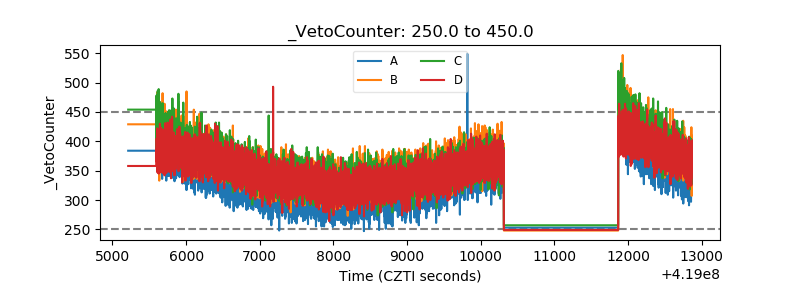 |