| Param | Original file | Final file |
|---|---|---|
| Filename | modeM0/AS1C07_001T10_9000005566_40760cztM0_level2.fits | modeM0/AS1C07_001T10_9000005566_40760cztM0_level2_quad_clean.evt |
| Size (bytes) | 517,991,040 | 78,082,560 |
| Size | 494.0 MB | 74.5 MB |
| Events in quadrant A | 3,107,476 | 586,410 |
| Events in quadrant B | 2,578,127 | 606,577 |
| Events in quadrant C | 9,938,693 | 317,124 |
| Events in quadrant D | 3,134,773 | 480,597 |
| Mode M9 | |||
|---|---|---|---|
| Quadrant | BADHDUFLAG | Total packets | Discarded packets |
| A | 0 | 22 | 0 |
| B | 0 | 22 | 0 |
| C | 0 | 22 | 0 |
| D | 0 | 23 | 0 |
| Mode M0 | |||
|---|---|---|---|
| Quadrant | BADHDUFLAG | Total packets | Discarded packets |
| A | 0 | 12720 | 3 |
| B | 0 | 11283 | 2 |
| C | 0 | 33215 | 2 |
| D | 0 | 13132 | 2 |
| Mode SS | |||
|---|---|---|---|
| Quadrant | BADHDUFLAG | Total packets | Discarded packets |
| A | 0 | 108 | 0 |
| B | 0 | 108 | 0 |
| C | 0 | 108 | 0 |
| D | 0 | 108 | 0 |
| Quadrant | Total seconds | Saturated seconds | Saturation percentage |
|---|---|---|---|
| A | 5330 | 68 | 1.275797% |
| B | 5330 | 42 | 0.787992% |
| C | 5330 | 2864 | 53.733583% |
| D | 5330 | 727 | 13.639775% |
Noise dominated data is calculated using 1-second bins in cleaned event files. If a bin has >2000 counts, and if more than 50% of those come from <1% of pixels, then it is considered to be noise-dominated and hence unusable.
| Quadrant | # 1 sec bins | Bins with >0 counts | Bins with >2000 counts | High rate bins dominated by noise | Noise dominated (total time) | Noise dominated (detector-on time) | Marked lightcurve |
|---|---|---|---|---|---|---|---|
| A | 7032 | 5331 | 37 | 37 | 0.53% | 0.69% | 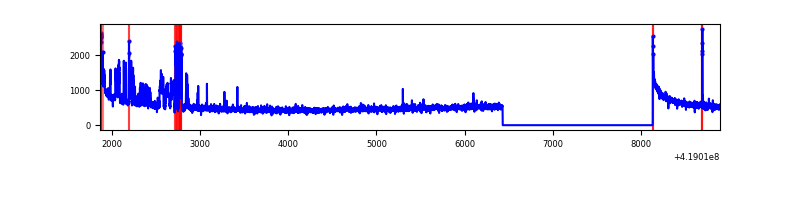 |
| B | 7032 | 5331 | 19 | 19 | 0.27% | 0.36% | 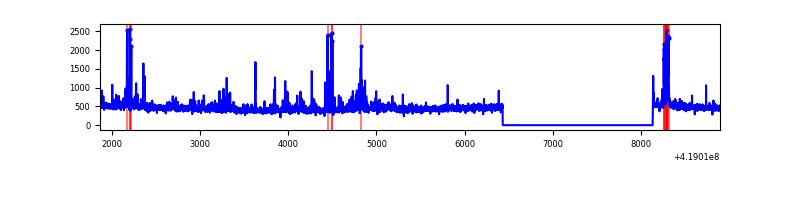 |
| C | 7032 | 5330 | 2752 | 2752 | 39.14% | 51.63% | 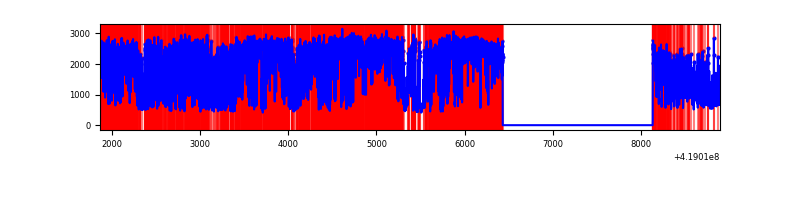 |
| D | 7031 | 5330 | 47 | 47 | 0.67% | 0.88% | 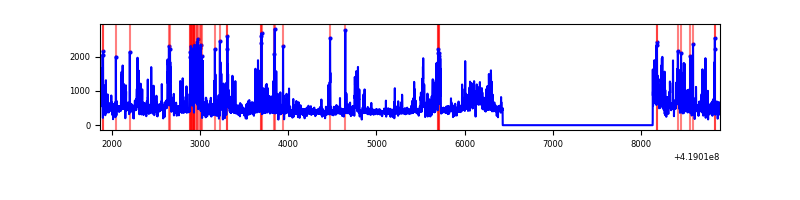 |
Top three noisy pixels from each quadrant. If the there are fewer than three noisy pixels in the level2.evt file, extra rows are filled as -1
| Pixel properties | Quadrant properties | ||||||
|---|---|---|---|---|---|---|---|
| Quadrant | DetID | PixID | Counts | Sigma | Mean | Median | Sigma |
| A | 10 | 83 | 504594 | 4226.01 | 580 | 568 | 119.3 |
| A | 6 | 10 | 313085 | 2620.3 | 580 | 568 | 119.3 |
| A | 12 | 189 | 23130 | 189.17 | 580 | 568 | 119.3 |
| B | 0 | 190 | 151629 | 1337.34 | 580 | 563 | 113.0 |
| B | 0 | 229 | 70347 | 617.78 | 580 | 563 | 113.0 |
| B | 15 | 85 | 51830 | 453.85 | 580 | 563 | 113.0 |
| C | 9 | 187 | 7852455 | 76795.54 | 444 | 447 | 102.2 |
| C | 15 | 214 | 179197 | 1748.24 | 444 | 447 | 102.2 |
| C | 0 | 10 | 74233 | 721.65 | 444 | 447 | 102.2 |
| D | 2 | 249 | 320126 | 2417.37 | 533 | 517 | 132.2 |
| D | 13 | 249 | 304719 | 2300.84 | 533 | 517 | 132.2 |
| D | 12 | 191 | 181890 | 1371.82 | 533 | 517 | 132.2 |
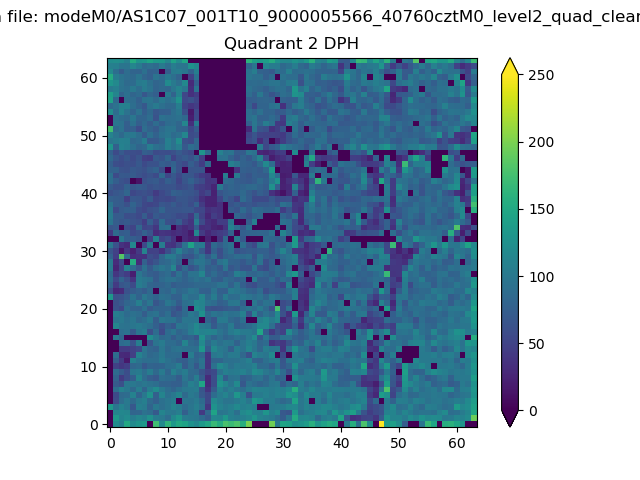
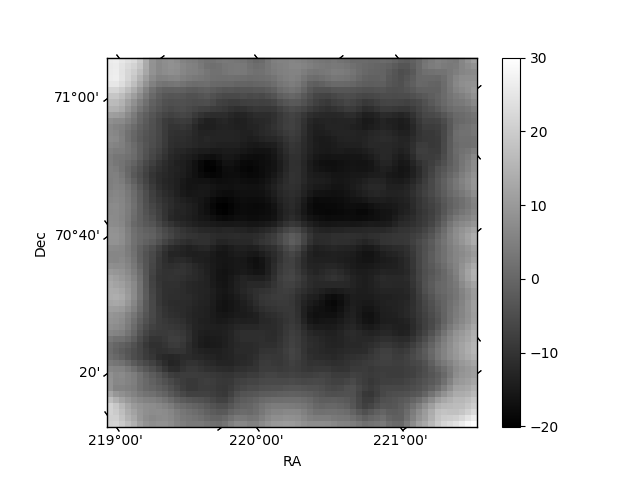
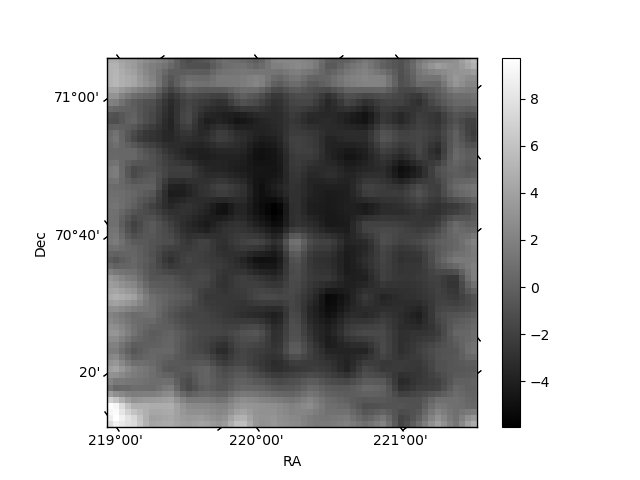
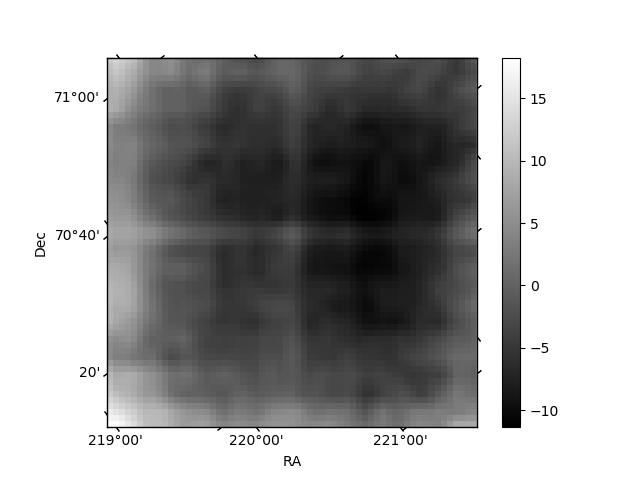
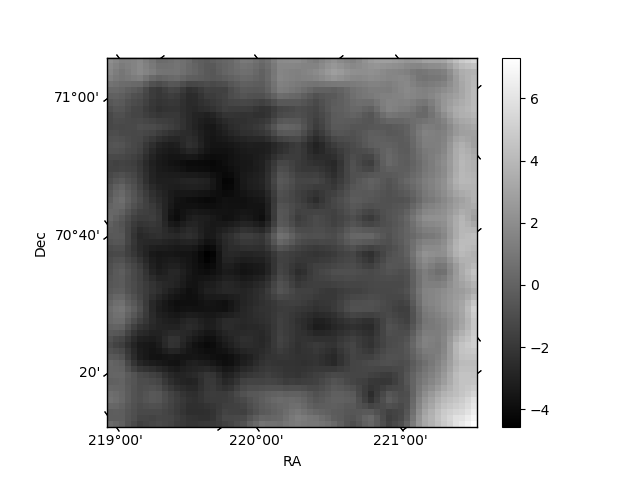
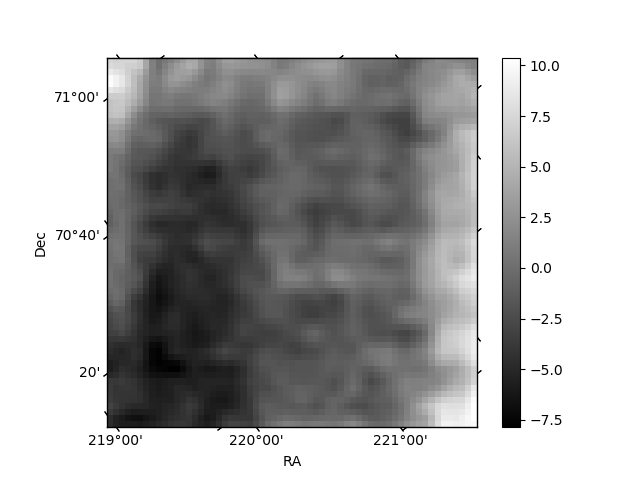
Histogram calculated using DETX and DETY for each event in the final _common_clean file
| Quadrant A | 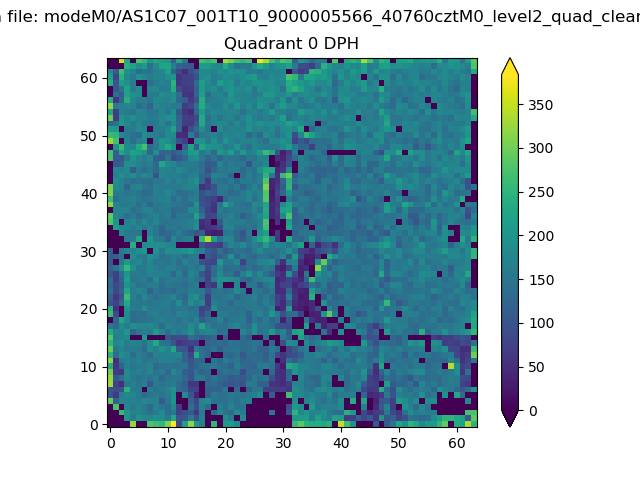 |
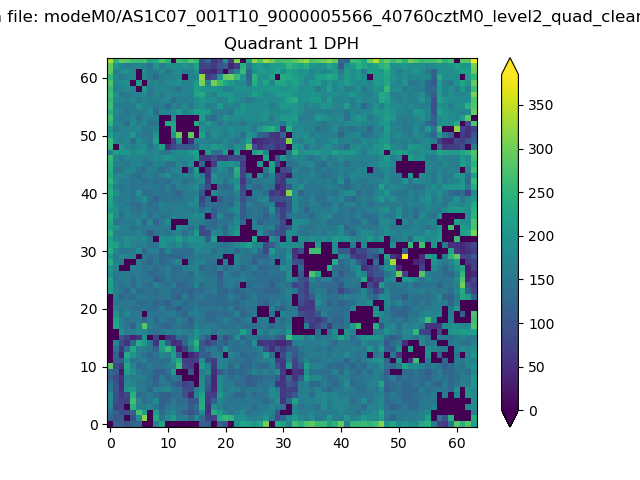 |
Quadrant B |
|---|---|---|---|
| Quadrant D | 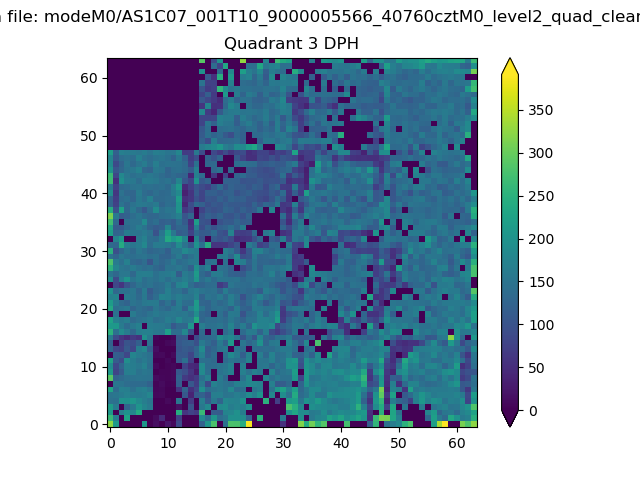 |
 |
Quadrant C |
| Plot type | Count rate plots | Images |
|---|---|---|
| Comparison with Poisson distribution Blue bars denote a histogram of data divided into 1 sec bins. Red curve is a Poisson curve with rate = median count rate of data. |
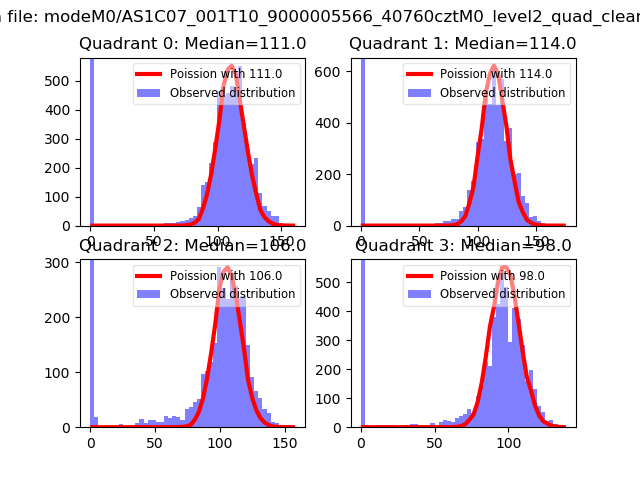 |
 |
| Quadrant-wise count rates Data is divided into 100 sec bins |
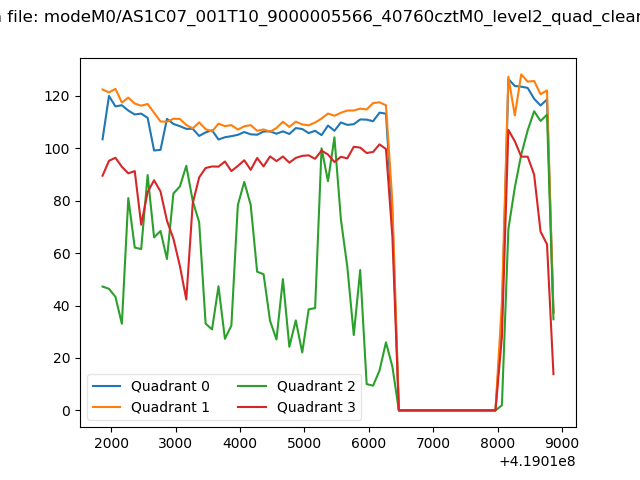 |
|
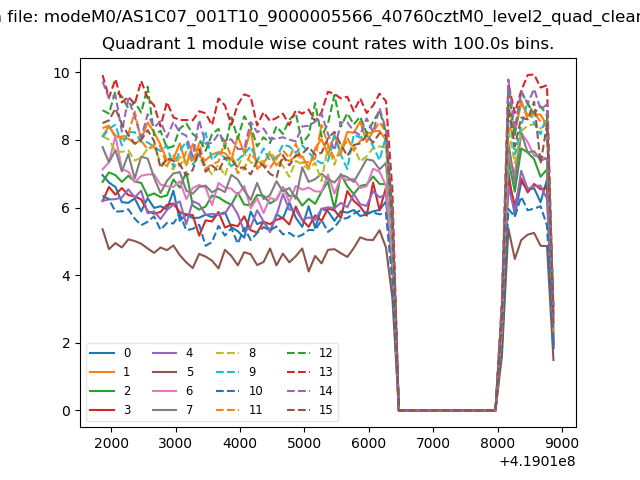
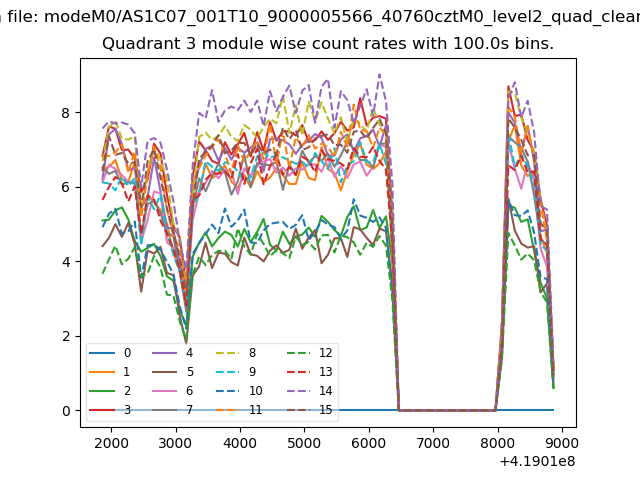
| Module-wise count rates for Quadrant A Data is divided into 100 sec bins |
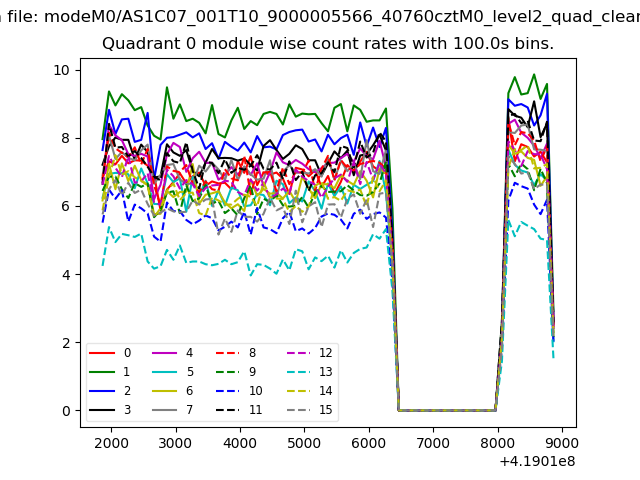 |
 |
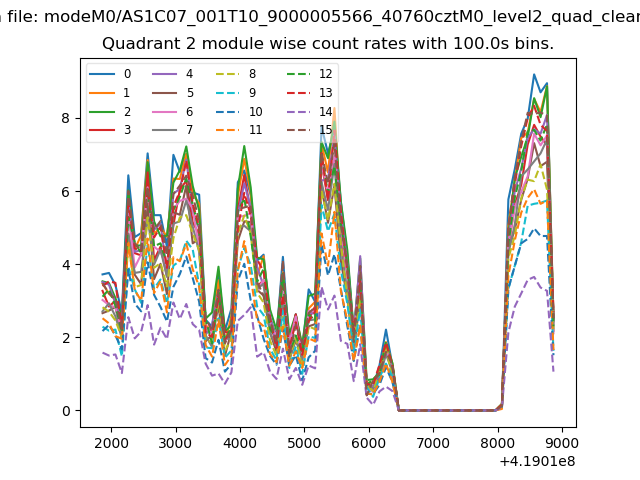
| Module-wise count rates for Quadrant B Data is divided into 100 sec bins |
 |
 |
| Module-wise count rates for Quadrant C Data is divided into 100 sec bins |
 |
 |
| Module-wise count rates for Quadrant D Data is divided into 100 sec bins |
 |
 |
| Parameter | Plot |
|---|---|
| CZT HV Monitor | 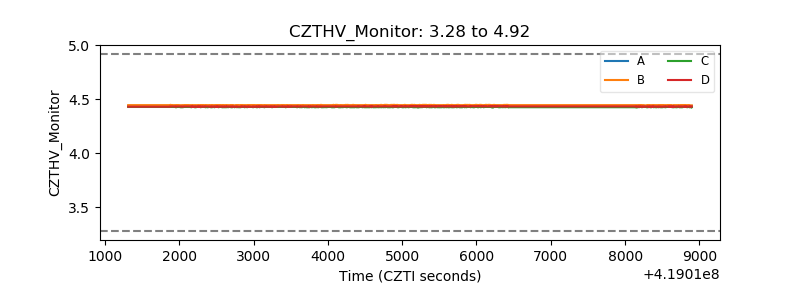 |
| D_VDD | 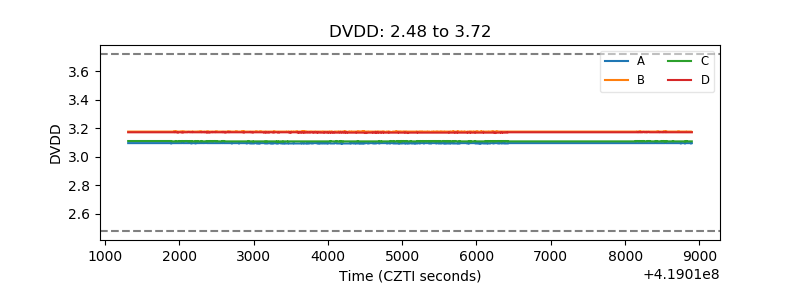 |
| Temperature 1 | 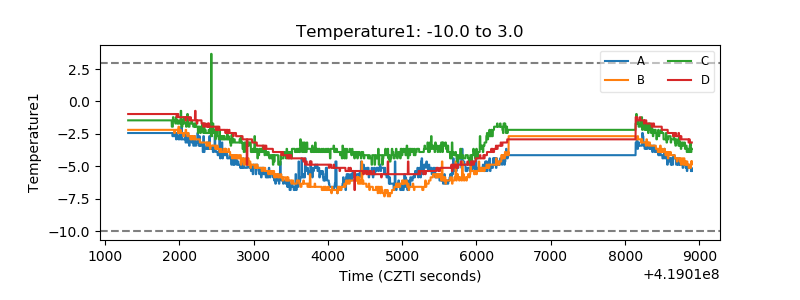 |
| Veto HV Monitor | 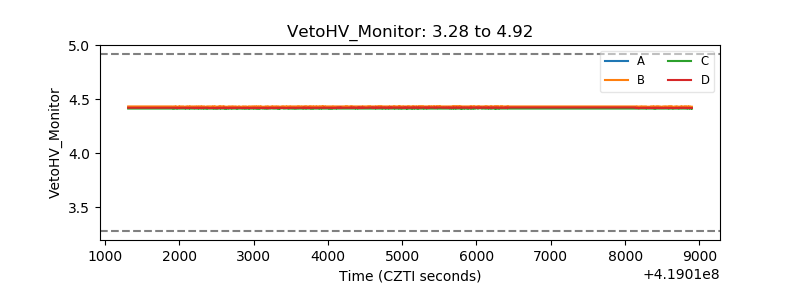 |
| Veto LLD | 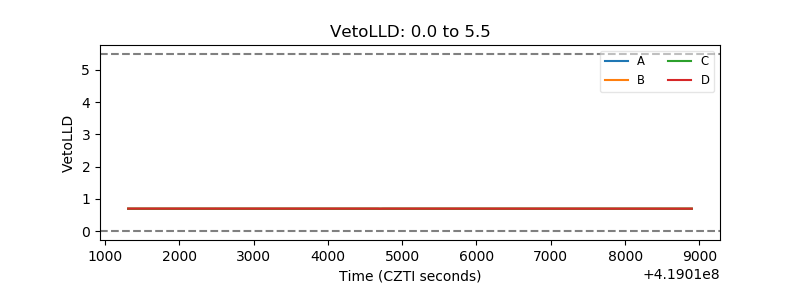 |
| Alpha Counter | 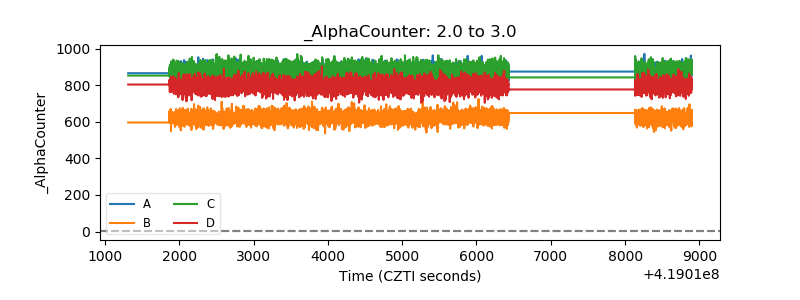 |
| _CPM_Rate | 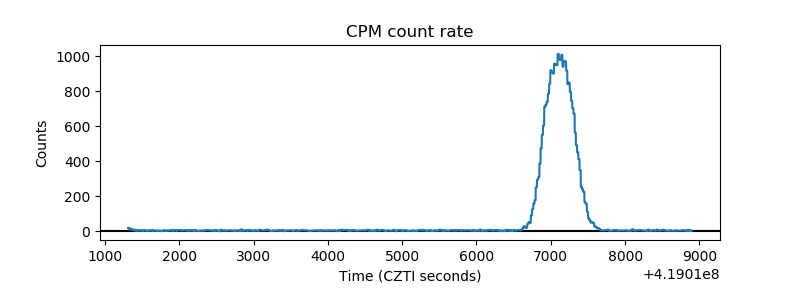 |
| CZT Counter | 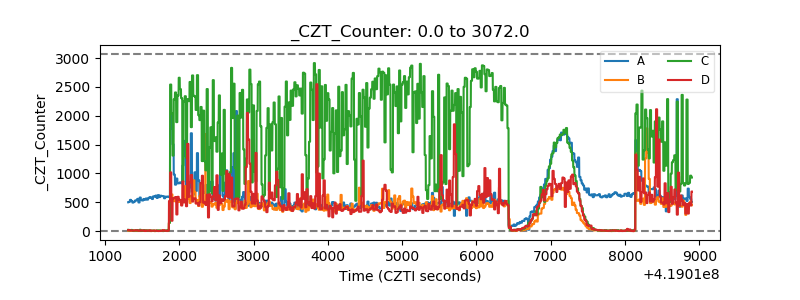 |
| +2.5 Volts monitor | 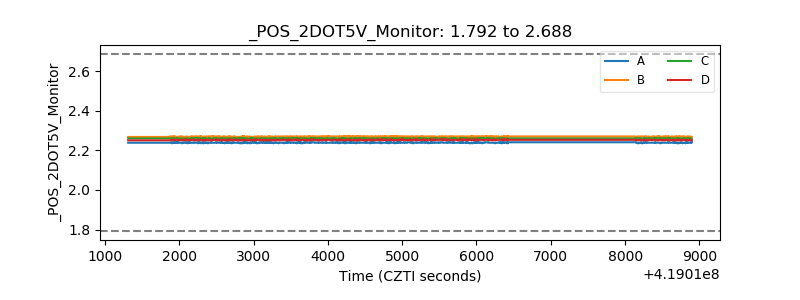 |
| +5 Volts monitor | 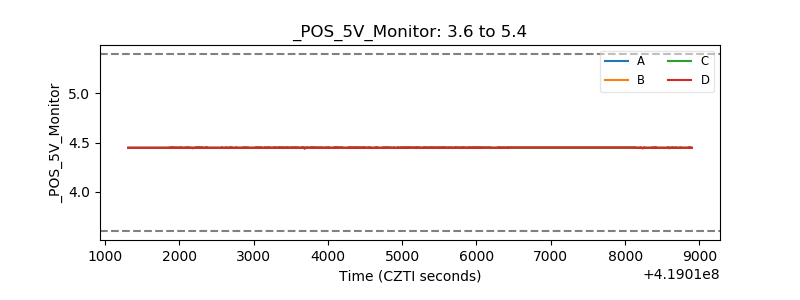 |
| _ROLL_ROT | 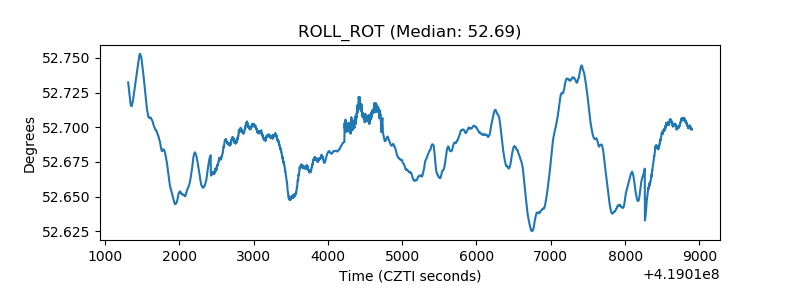 |
| _Roll_DEC | 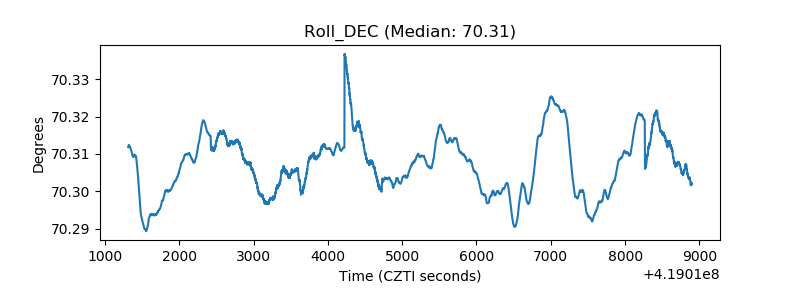 |
| _Roll_RA | 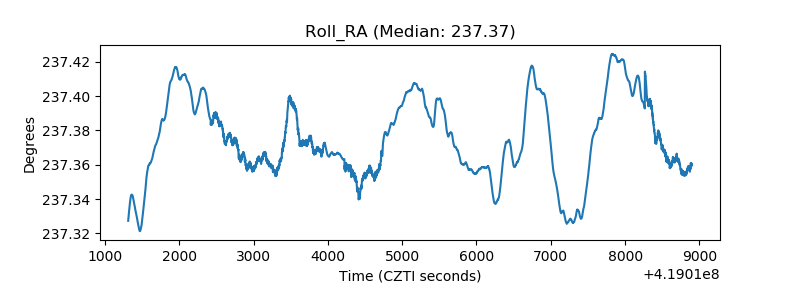 |
| Veto Counter | 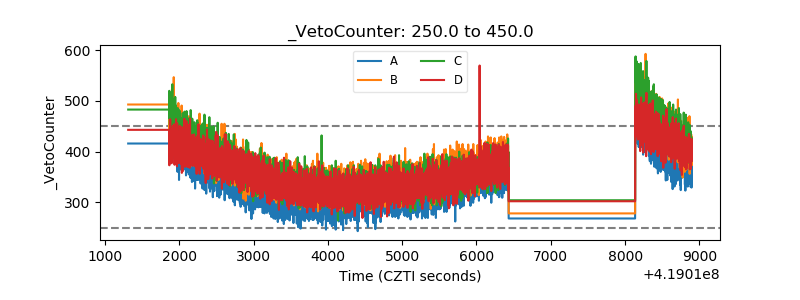 |