| Param | Original file | Final file |
|---|---|---|
| Filename | modeM0/AS1C07_001T10_9000005566_40762cztM0_level2.fits | modeM0/AS1C07_001T10_9000005566_40762cztM0_level2_quad_clean.evt |
| Size (bytes) | 462,962,880 | 83,891,520 |
| Size | 441.5 MB | 80.0 MB |
| Events in quadrant A | 2,821,143 | 607,080 |
| Events in quadrant B | 2,456,723 | 630,662 |
| Events in quadrant C | 8,023,886 | 447,223 |
| Events in quadrant D | 3,422,634 | 483,801 |
| Mode M9 | |||
|---|---|---|---|
| Quadrant | BADHDUFLAG | Total packets | Discarded packets |
| A | 0 | 29 | 0 |
| B | 0 | 29 | 0 |
| C | 0 | 29 | 0 |
| D | 0 | 30 | 0 |
| Mode M0 | |||
|---|---|---|---|
| Quadrant | BADHDUFLAG | Total packets | Discarded packets |
| A | 0 | 11791 | 3 |
| B | 0 | 10972 | 2 |
| C | 0 | 27521 | 2 |
| D | 0 | 13983 | 2 |
| Mode SS | |||
|---|---|---|---|
| Quadrant | BADHDUFLAG | Total packets | Discarded packets |
| A | 0 | 108 | 0 |
| B | 0 | 108 | 0 |
| C | 0 | 108 | 0 |
| D | 0 | 108 | 0 |
| Quadrant | Total seconds | Saturated seconds | Saturation percentage |
|---|---|---|---|
| A | 5299 | 16 | 0.301944% |
| B | 5299 | 38 | 0.717116% |
| C | 5299 | 1783 | 33.647858% |
| D | 5299 | 876 | 16.531421% |
Noise dominated data is calculated using 1-second bins in cleaned event files. If a bin has >2000 counts, and if more than 50% of those come from <1% of pixels, then it is considered to be noise-dominated and hence unusable.
| Quadrant | # 1 sec bins | Bins with >0 counts | Bins with >2000 counts | High rate bins dominated by noise | Noise dominated (total time) | Noise dominated (detector-on time) | Marked lightcurve |
|---|---|---|---|---|---|---|---|
| A | 7093 | 5300 | 10 | 10 | 0.14% | 0.19% | 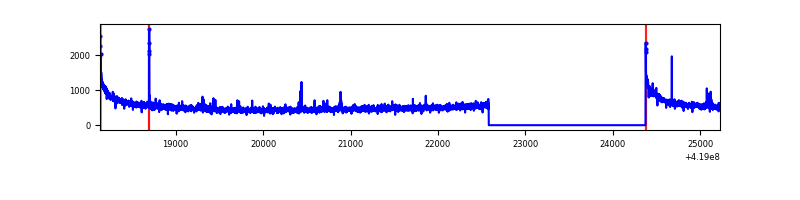 |
| B | 7093 | 5300 | 13 | 13 | 0.18% | 0.25% | 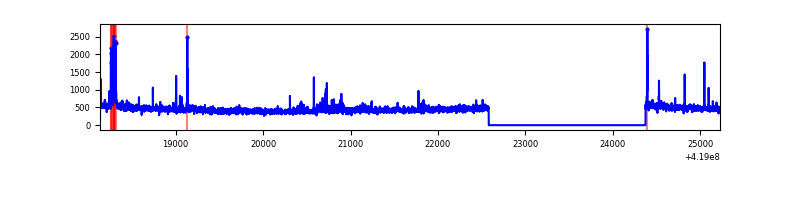 |
| C | 7093 | 5300 | 1811 | 1811 | 25.53% | 34.17% | 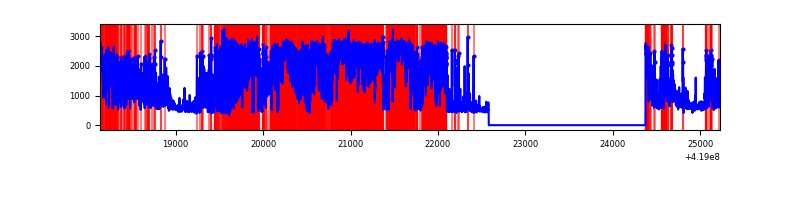 |
| D | 7093 | 5300 | 67 | 67 | 0.94% | 1.26% | 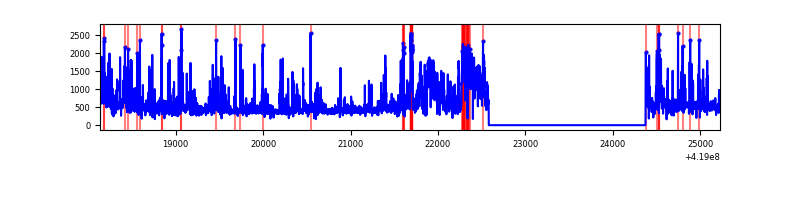 |
Top three noisy pixels from each quadrant. If the there are fewer than three noisy pixels in the level2.evt file, extra rows are filled as -1
| Pixel properties | Quadrant properties | ||||||
|---|---|---|---|---|---|---|---|
| Quadrant | DetID | PixID | Counts | Sigma | Mean | Median | Sigma |
| A | 10 | 83 | 497667 | 4124.51 | 580 | 568 | 120.5 |
| A | 12 | 189 | 28681 | 233.26 | 580 | 568 | 120.5 |
| A | 2 | 79 | 21588 | 174.41 | 580 | 568 | 120.5 |
| B | 0 | 229 | 51388 | 449.22 | 586 | 570 | 113.1 |
| B | 15 | 85 | 44532 | 388.61 | 586 | 570 | 113.1 |
| B | 4 | 171 | 37731 | 328.49 | 586 | 570 | 113.1 |
| C | 9 | 187 | 5623497 | 47472.54 | 514 | 518 | 118.4 |
| C | 15 | 214 | 201994 | 1700.98 | 514 | 518 | 118.4 |
| C | 14 | 254 | 87099 | 730.97 | 514 | 518 | 118.4 |
| D | 13 | 249 | 675702 | 5159.27 | 529 | 515 | 130.9 |
| D | 2 | 249 | 268034 | 2044.18 | 529 | 515 | 130.9 |
| D | 12 | 191 | 189185 | 1441.67 | 529 | 515 | 130.9 |
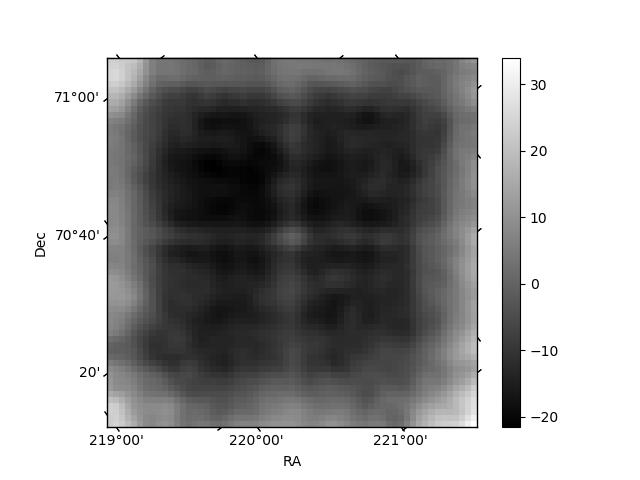
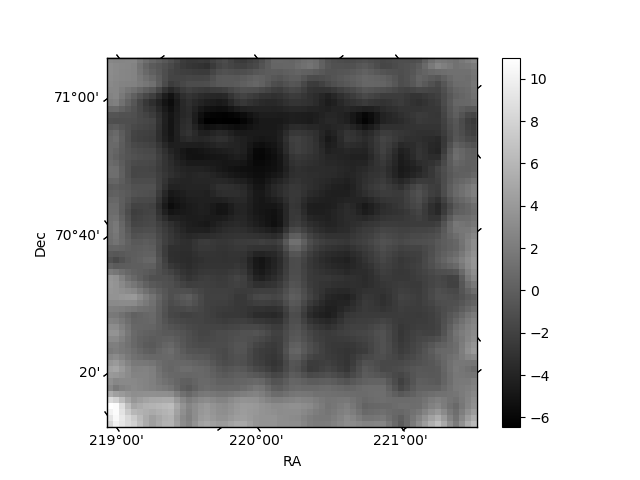
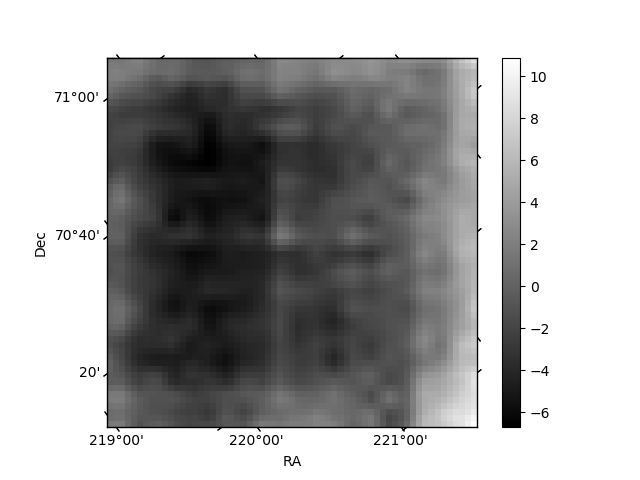
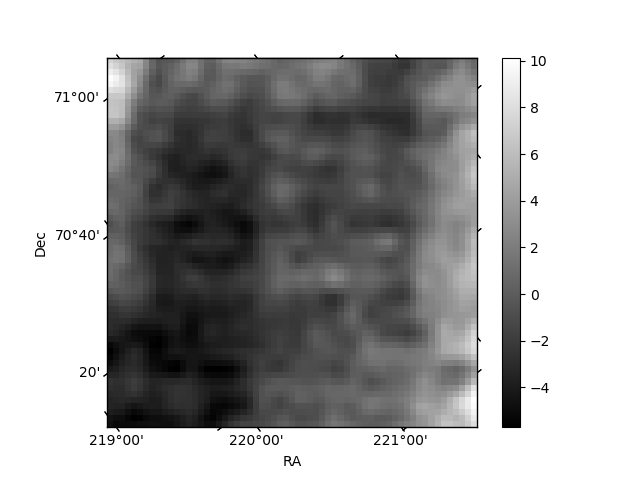
Histogram calculated using DETX and DETY for each event in the final _common_clean file
| Quadrant A | 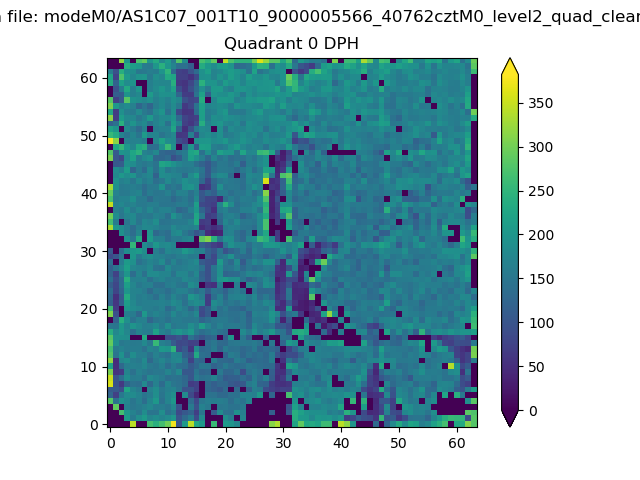 |
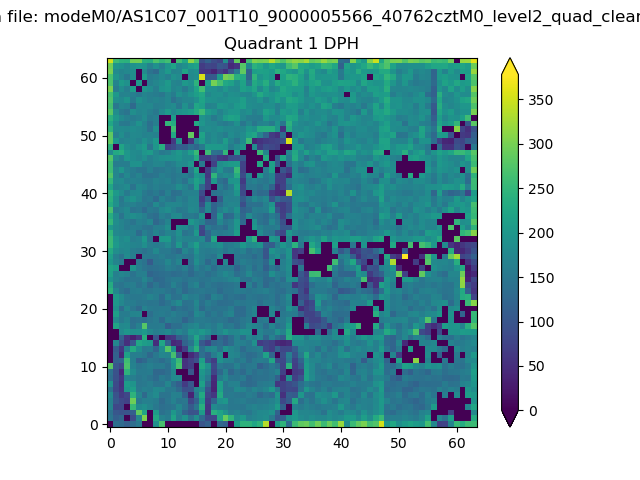 |
Quadrant B |
|---|---|---|---|
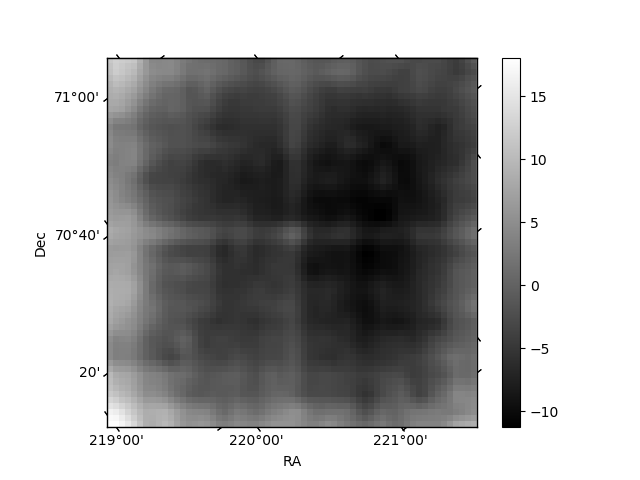
| Quadrant D | 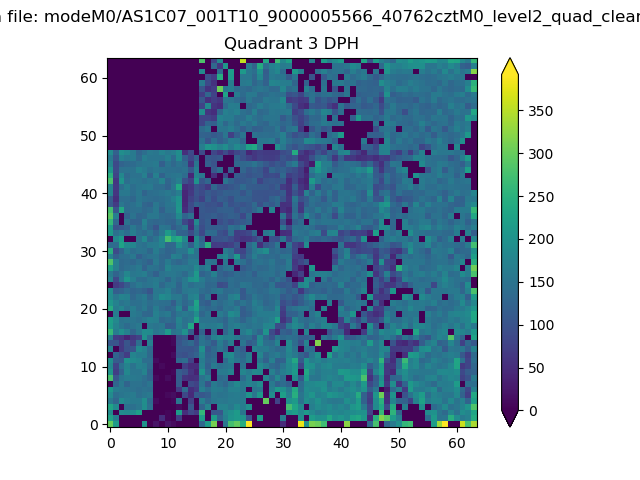 |
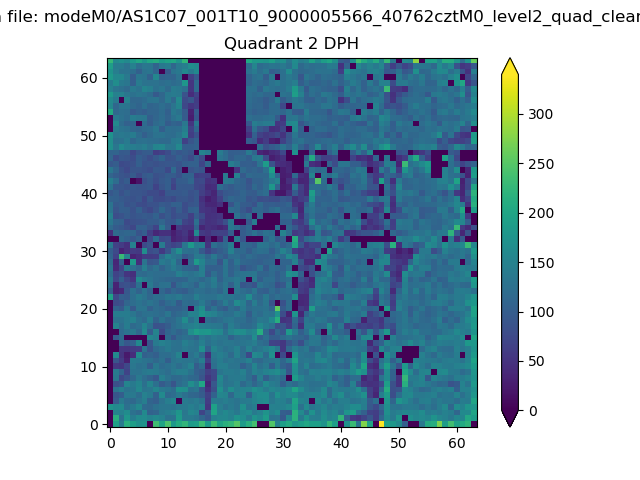 |
Quadrant C |
| Plot type | Count rate plots | Images |
|---|---|---|
| Comparison with Poisson distribution Blue bars denote a histogram of data divided into 1 sec bins. Red curve is a Poisson curve with rate = median count rate of data. |
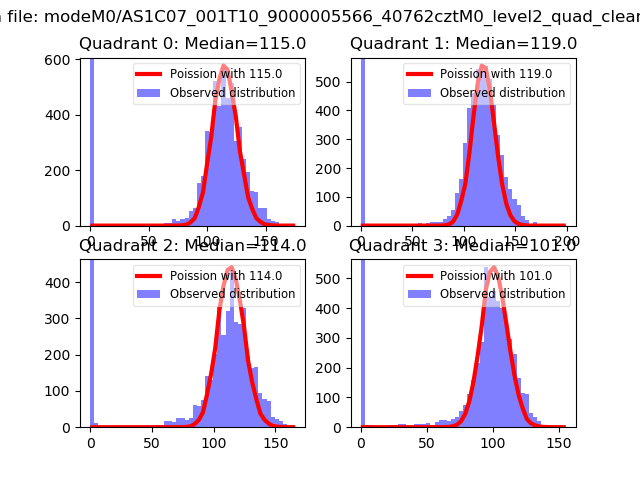 |
 |
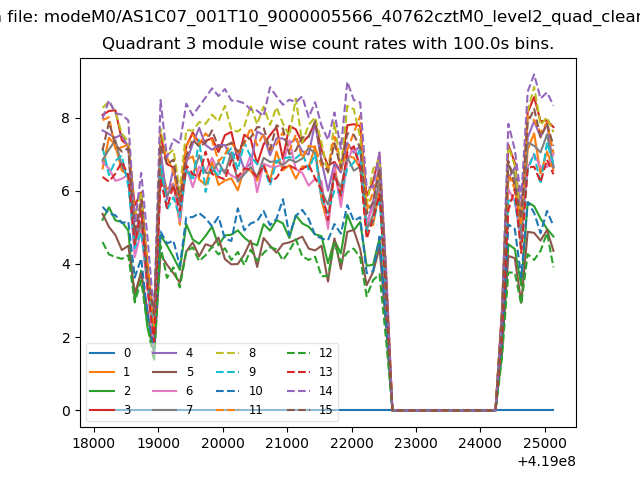
| Quadrant-wise count rates Data is divided into 100 sec bins |
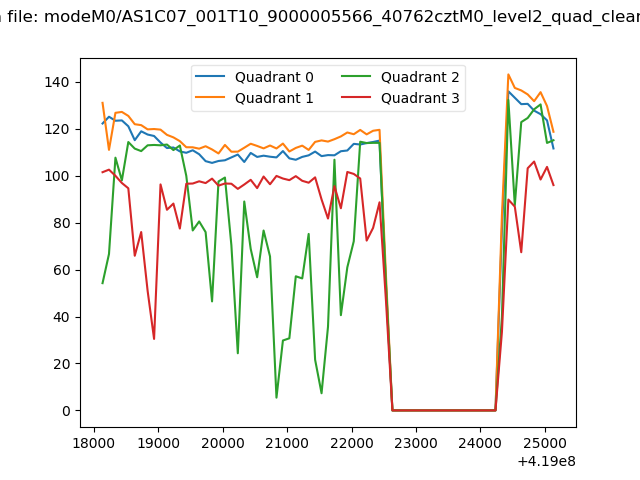 |
|
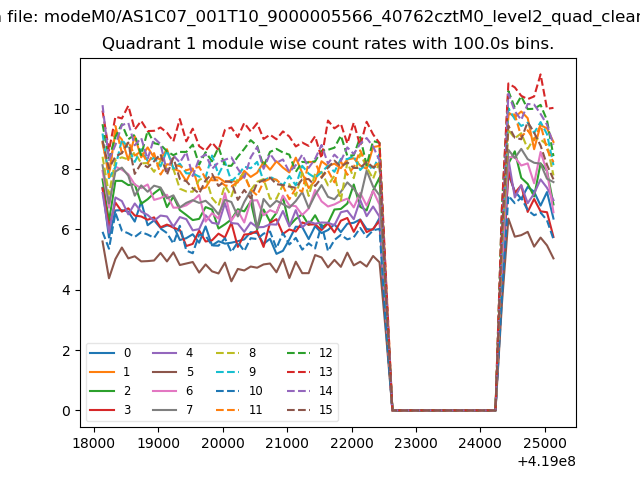
| Module-wise count rates for Quadrant A Data is divided into 100 sec bins |
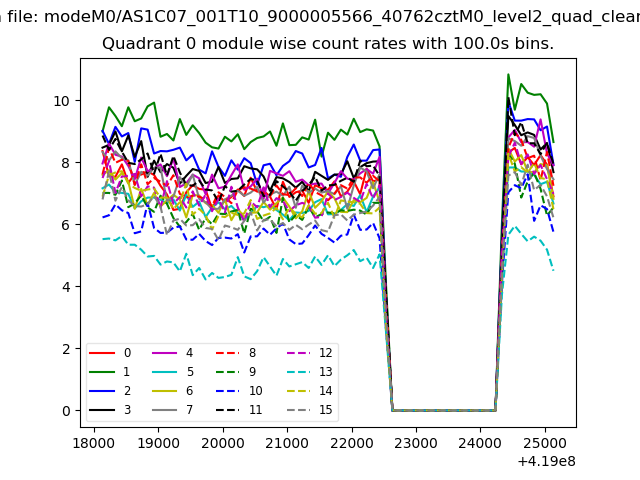 |
 |
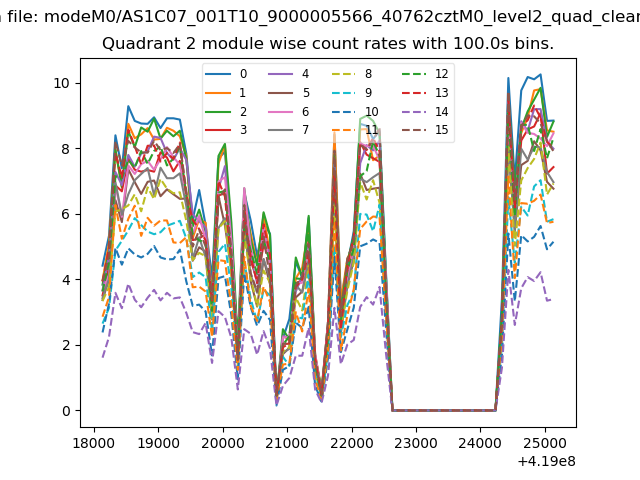
| Module-wise count rates for Quadrant B Data is divided into 100 sec bins |
 |
 |
| Module-wise count rates for Quadrant C Data is divided into 100 sec bins |
 |
 |
| Module-wise count rates for Quadrant D Data is divided into 100 sec bins |
 |
 |
| Parameter | Plot |
|---|---|
| CZT HV Monitor | 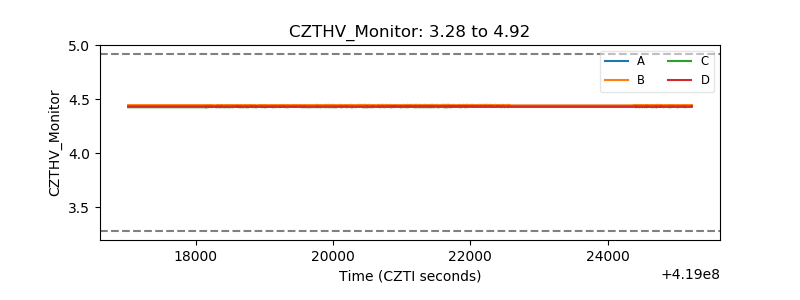 |
| D_VDD | 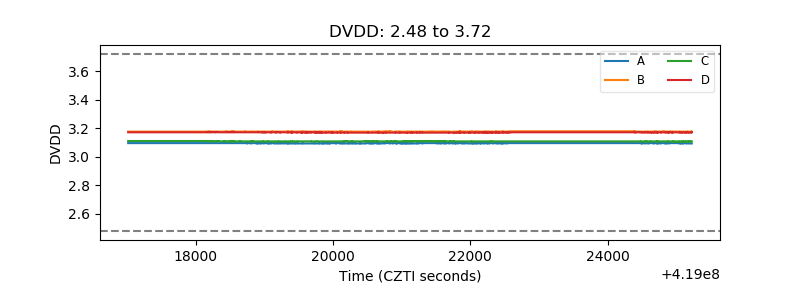 |
| Temperature 1 | 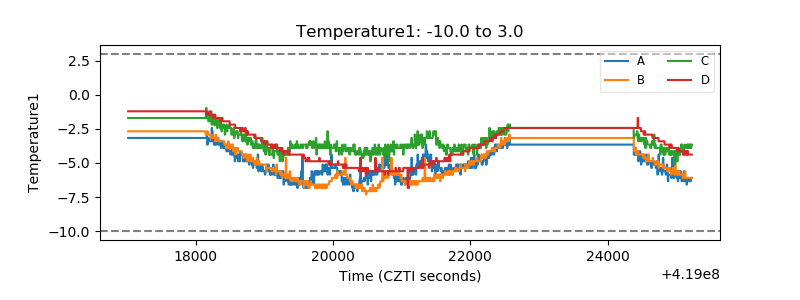 |
| Veto HV Monitor | 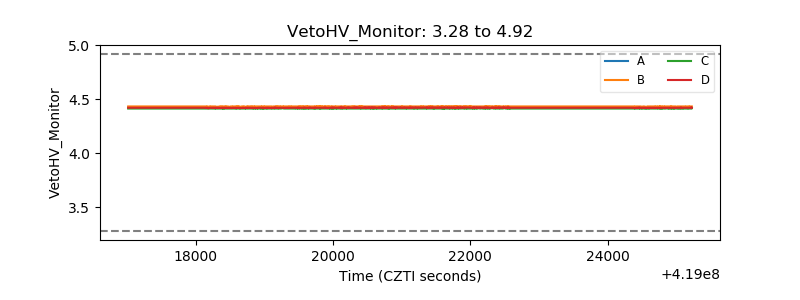 |
| Veto LLD | 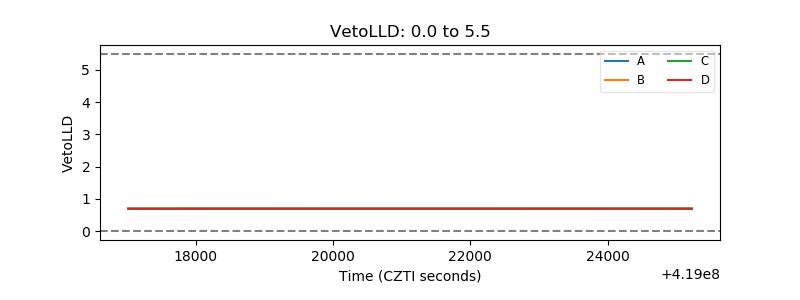 |
| Alpha Counter | 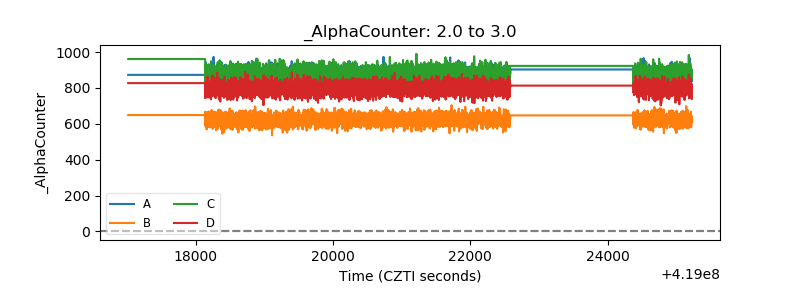 |
| _CPM_Rate | 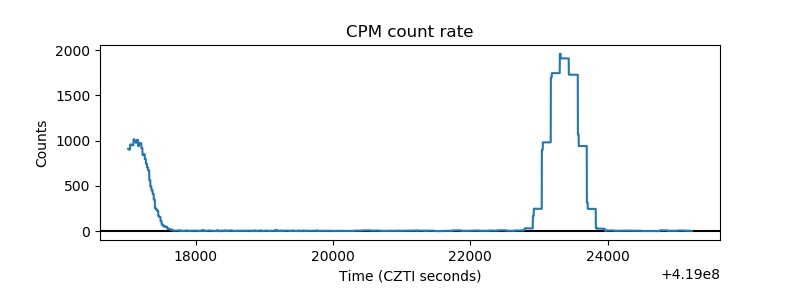 |
| CZT Counter | 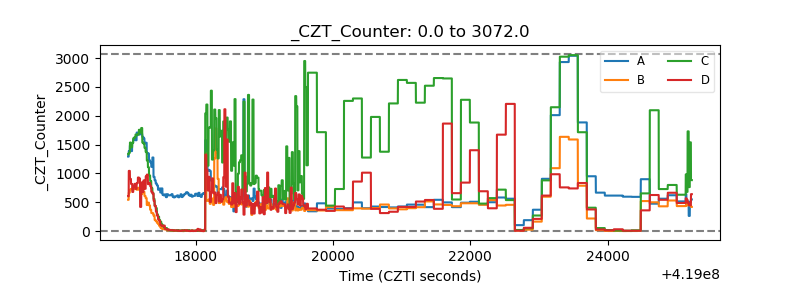 |
| +2.5 Volts monitor | 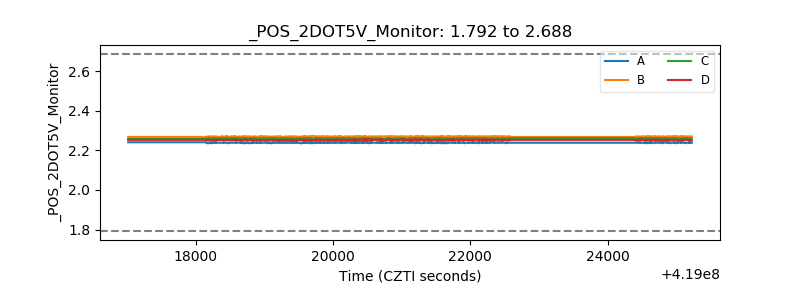 |
| +5 Volts monitor | 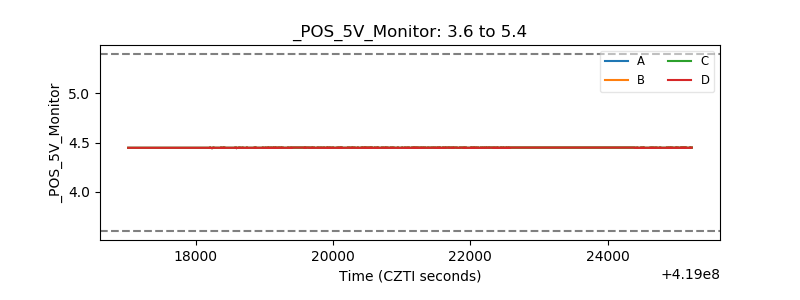 |
| _ROLL_ROT | 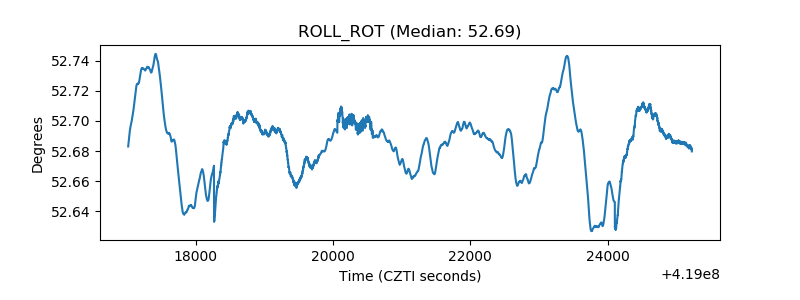 |
| _Roll_DEC | 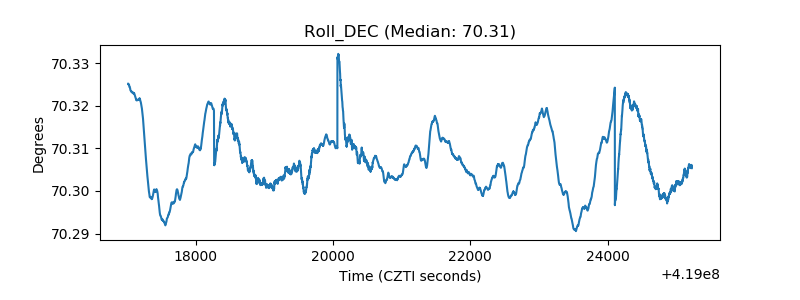 |
| _Roll_RA | 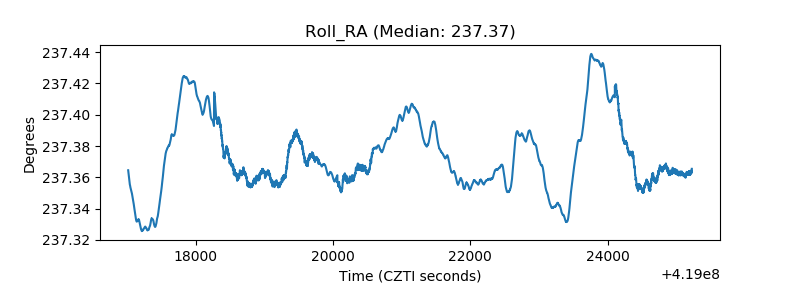 |
| Veto Counter | 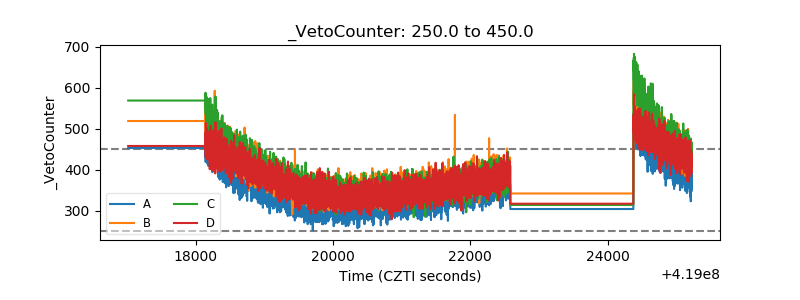 |