| Param | Original file | Final file |
|---|---|---|
| Filename | modeM0/AS1C07_001T10_9000005566_40763cztM0_level2.fits | modeM0/AS1C07_001T10_9000005566_40763cztM0_level2_quad_clean.evt |
| Size (bytes) | 555,212,160 | 77,290,560 |
| Size | 529.5 MB | 73.7 MB |
| Events in quadrant A | 2,709,625 | 602,659 |
| Events in quadrant B | 2,329,089 | 631,926 |
| Events in quadrant C | 8,064,111 | 418,482 |
| Events in quadrant D | 7,056,477 | 333,098 |
| Mode M9 | |||
|---|---|---|---|
| Quadrant | BADHDUFLAG | Total packets | Discarded packets |
| A | 0 | 34 | 0 |
| B | 0 | 34 | 0 |
| C | 0 | 34 | 0 |
| D | 0 | 35 | 0 |
| Mode M0 | |||
|---|---|---|---|
| Quadrant | BADHDUFLAG | Total packets | Discarded packets |
| A | 0 | 11219 | 3 |
| B | 0 | 10385 | 2 |
| C | 0 | 27506 | 2 |
| D | 0 | 24459 | 2 |
| Mode SS | |||
|---|---|---|---|
| Quadrant | BADHDUFLAG | Total packets | Discarded packets |
| A | 0 | 102 | 0 |
| B | 0 | 102 | 0 |
| C | 0 | 102 | 0 |
| D | 0 | 102 | 0 |
| Quadrant | Total seconds | Saturated seconds | Saturation percentage |
|---|---|---|---|
| A | 5052 | 10 | 0.197941% |
| B | 5052 | 9 | 0.178147% |
| C | 5052 | 1930 | 38.202692% |
| D | 5052 | 2254 | 44.615994% |
Noise dominated data is calculated using 1-second bins in cleaned event files. If a bin has >2000 counts, and if more than 50% of those come from <1% of pixels, then it is considered to be noise-dominated and hence unusable.
| Quadrant | # 1 sec bins | Bins with >0 counts | Bins with >2000 counts | High rate bins dominated by noise | Noise dominated (total time) | Noise dominated (detector-on time) | Marked lightcurve |
|---|---|---|---|---|---|---|---|
| A | 6994 | 5053 | 6 | 6 | 0.09% | 0.12% | 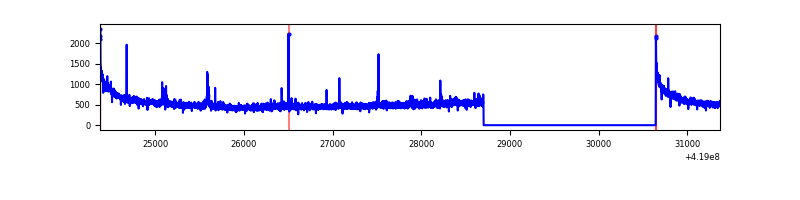 |
| B | 6994 | 5053 | 2 | 2 | 0.03% | 0.04% | 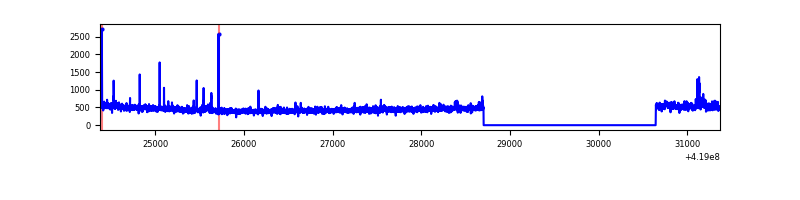 |
| C | 6993 | 5051 | 2009 | 2009 | 28.73% | 39.77% | 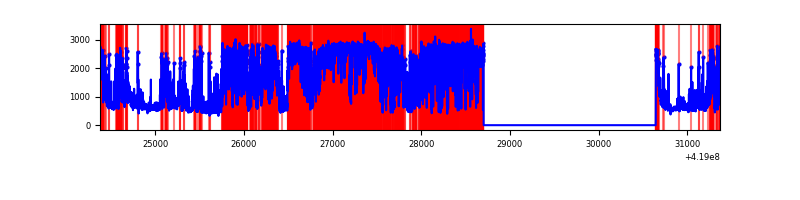 |
| D | 6993 | 5051 | 1580 | 1580 | 22.59% | 31.28% | 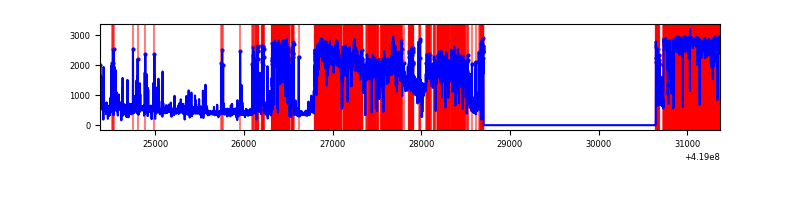 |
Top three noisy pixels from each quadrant. If the there are fewer than three noisy pixels in the level2.evt file, extra rows are filled as -1
| Pixel properties | Quadrant properties | ||||||
|---|---|---|---|---|---|---|---|
| Quadrant | DetID | PixID | Counts | Sigma | Mean | Median | Sigma |
| A | 10 | 83 | 468598 | 4103.52 | 560 | 552 | 114.1 |
| A | 13 | 248 | 23229 | 198.82 | 560 | 552 | 114.1 |
| A | 6 | 10 | 21785 | 186.16 | 560 | 552 | 114.1 |
| B | 0 | 229 | 74372 | 683.32 | 568 | 552 | 108.0 |
| B | 4 | 171 | 19283 | 173.38 | 568 | 552 | 108.0 |
| B | 12 | 111 | 13394 | 118.87 | 568 | 552 | 108.0 |
| C | 9 | 187 | 5883716 | 54088.98 | 472 | 476 | 108.8 |
| C | 15 | 214 | 185471 | 1700.8 | 472 | 476 | 108.8 |
| C | 0 | 10 | 106497 | 974.73 | 472 | 476 | 108.8 |
| D | 13 | 249 | 2976582 | 27304.27 | 444 | 432 | 109.0 |
| D | 12 | 227 | 1841637 | 16891.88 | 444 | 432 | 109.0 |
| D | 2 | 249 | 166281 | 1521.56 | 444 | 432 | 109.0 |
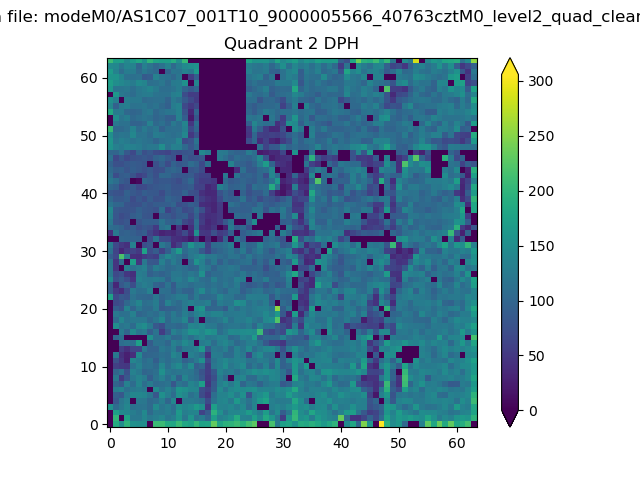
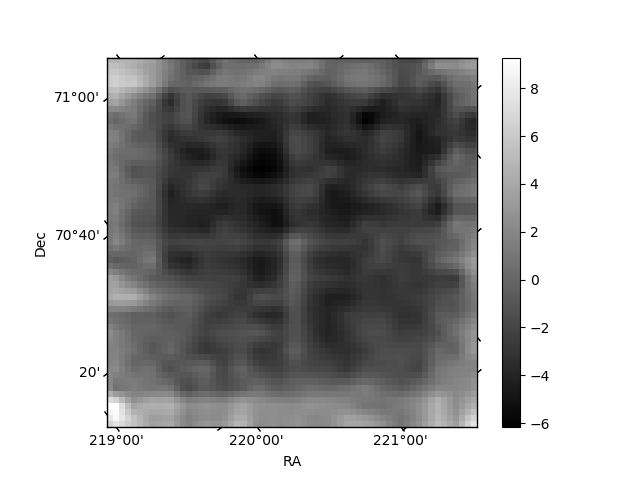
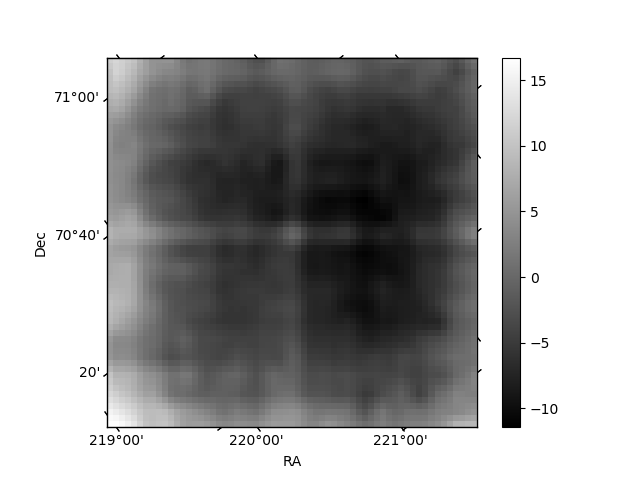
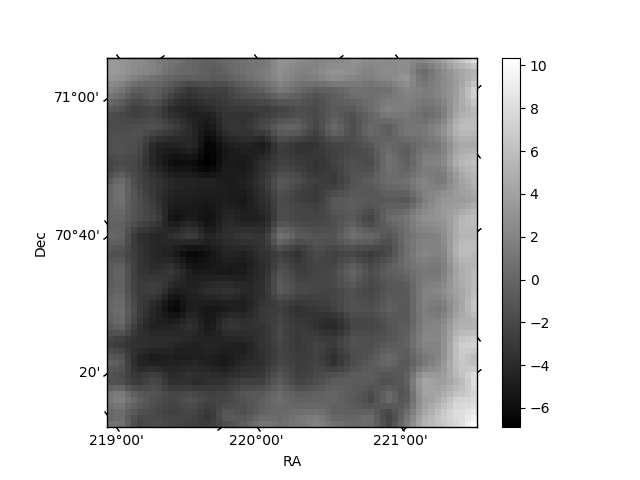
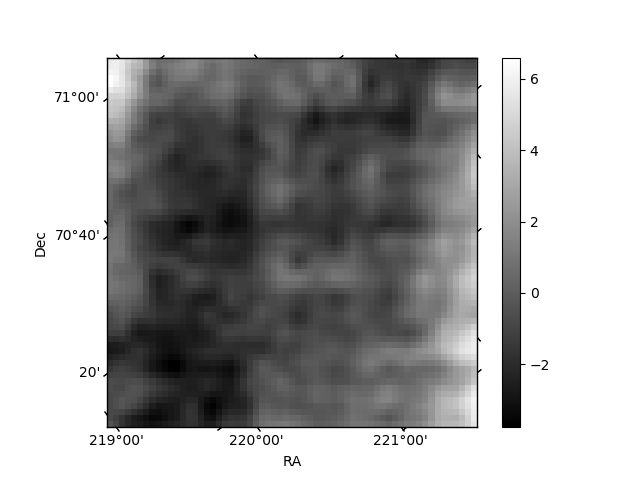
Histogram calculated using DETX and DETY for each event in the final _common_clean file
| Quadrant A |  |
 |
Quadrant B |
|---|---|---|---|
| Quadrant D |  |
 |
Quadrant C |
| Plot type | Count rate plots | Images |
|---|---|---|
| Comparison with Poisson distribution Blue bars denote a histogram of data divided into 1 sec bins. Red curve is a Poisson curve with rate = median count rate of data. |
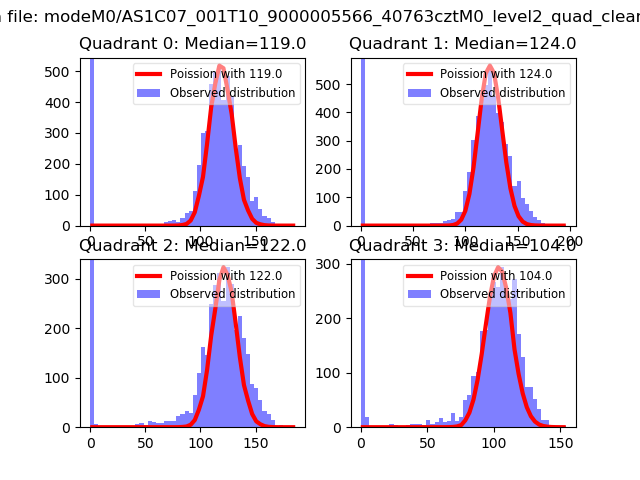 |
 |
| Quadrant-wise count rates Data is divided into 100 sec bins |
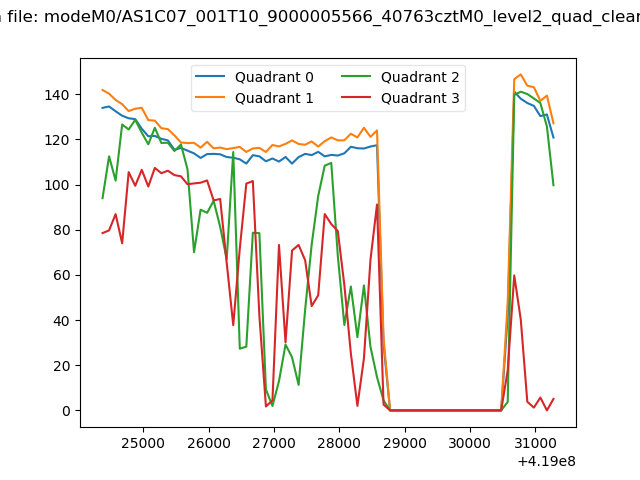 |
|
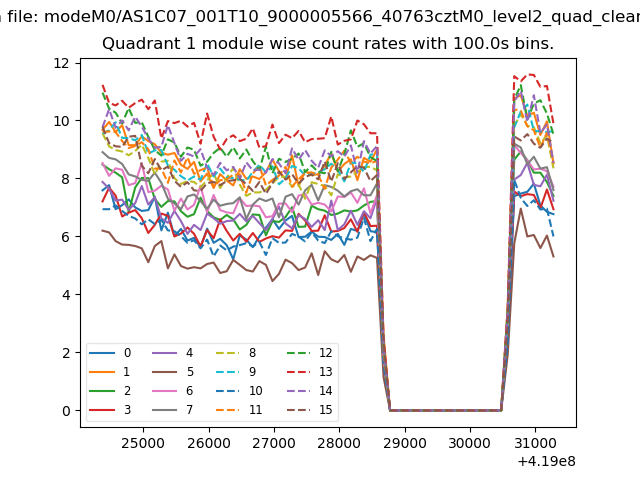
| Module-wise count rates for Quadrant A Data is divided into 100 sec bins |
 |
 |
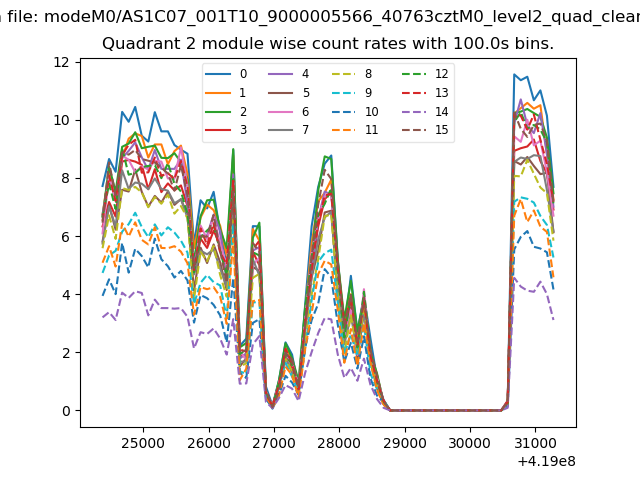
| Module-wise count rates for Quadrant B Data is divided into 100 sec bins |
 |
 |
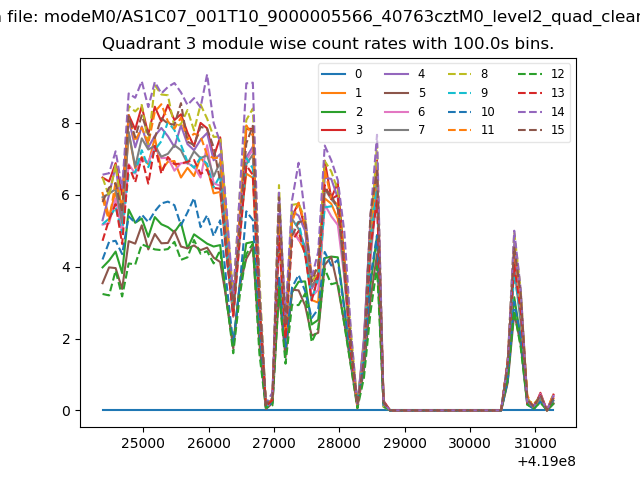
| Module-wise count rates for Quadrant C Data is divided into 100 sec bins |
 |
 |
| Module-wise count rates for Quadrant D Data is divided into 100 sec bins |
 |
 |
| Parameter | Plot |
|---|---|
| CZT HV Monitor | 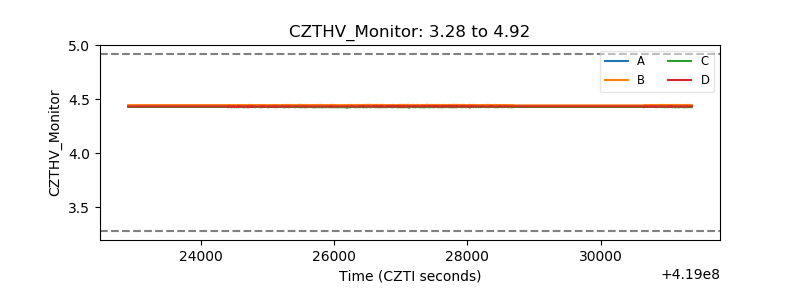 |
| D_VDD | 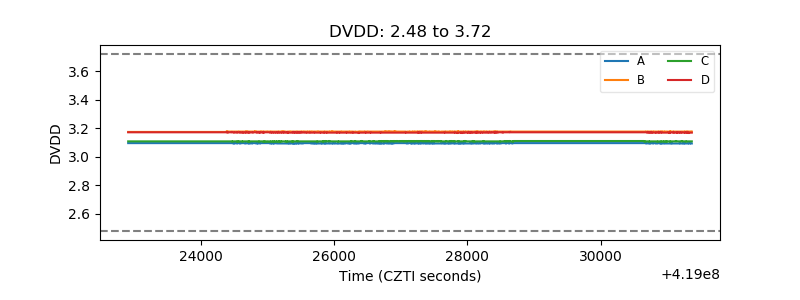 |
| Temperature 1 | 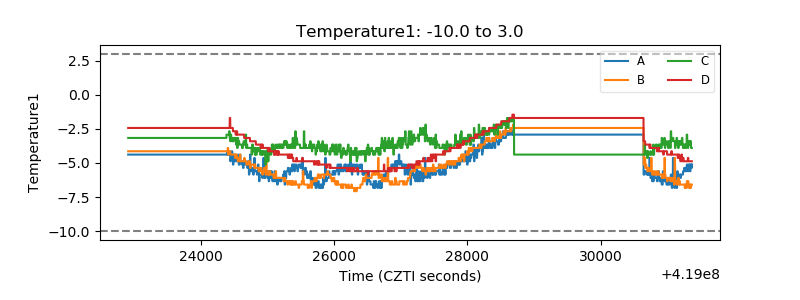 |
| Veto HV Monitor | 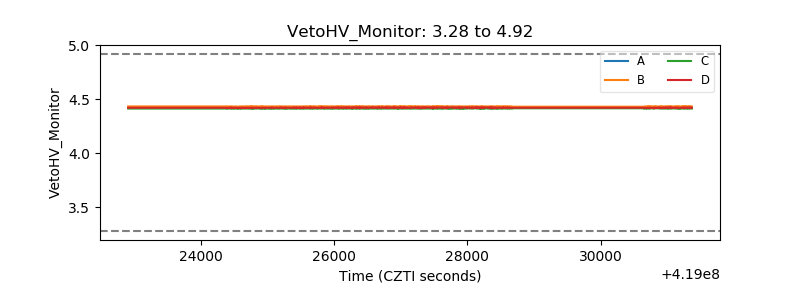 |
| Veto LLD | 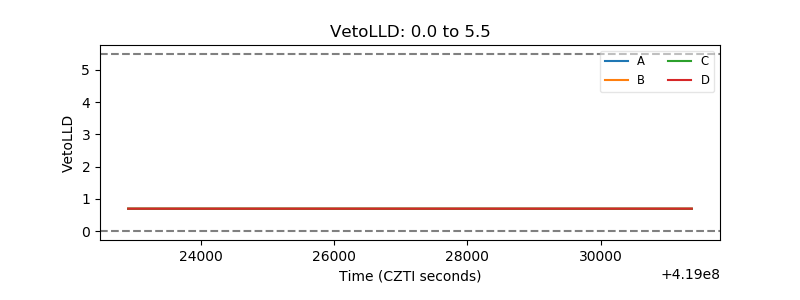 |
| Alpha Counter | 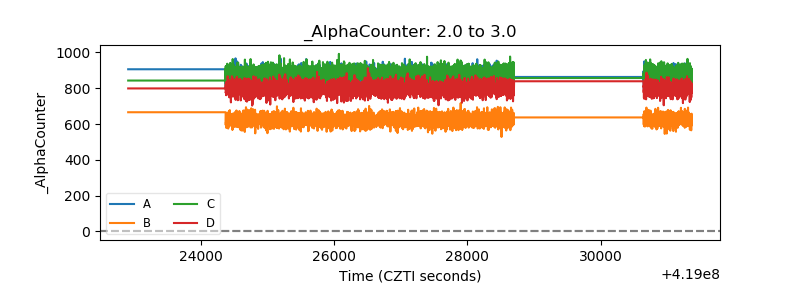 |
| _CPM_Rate | 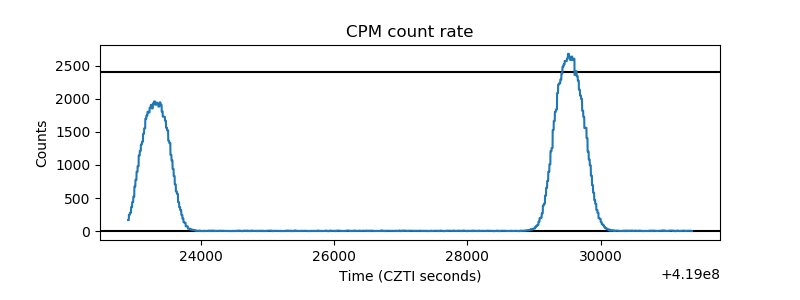 |
| CZT Counter | 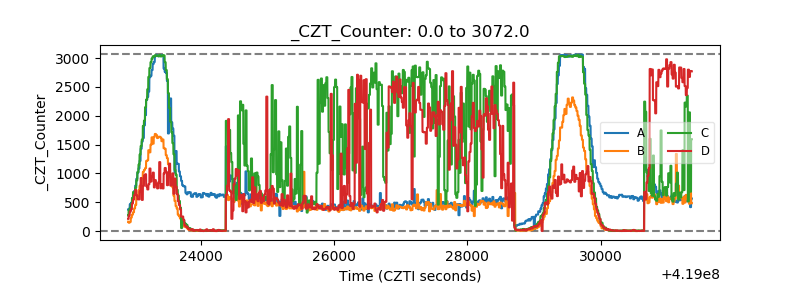 |
| +2.5 Volts monitor | 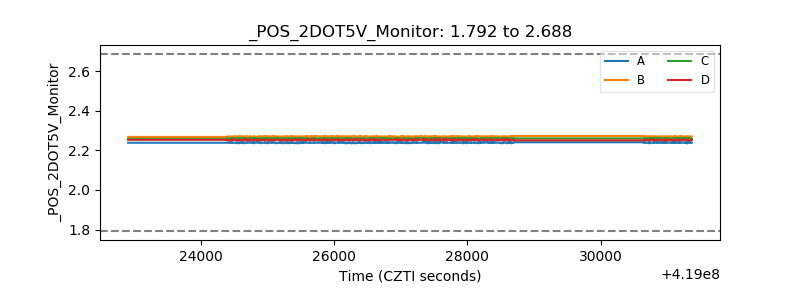 |
| +5 Volts monitor | 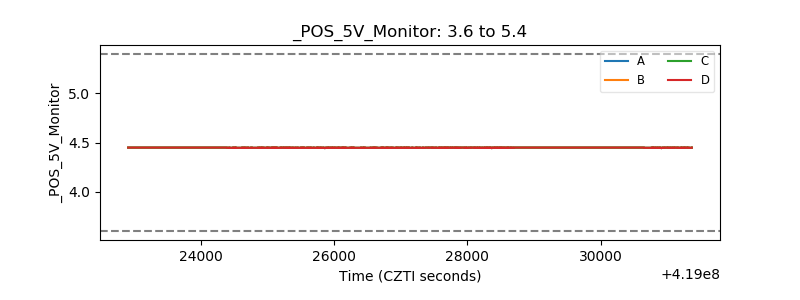 |
| _ROLL_ROT | 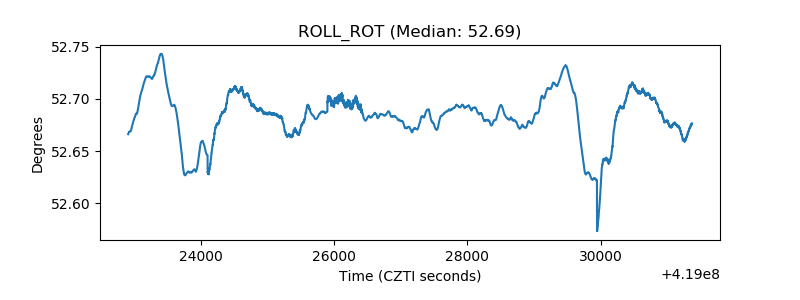 |
| _Roll_DEC |  |
| _Roll_RA | 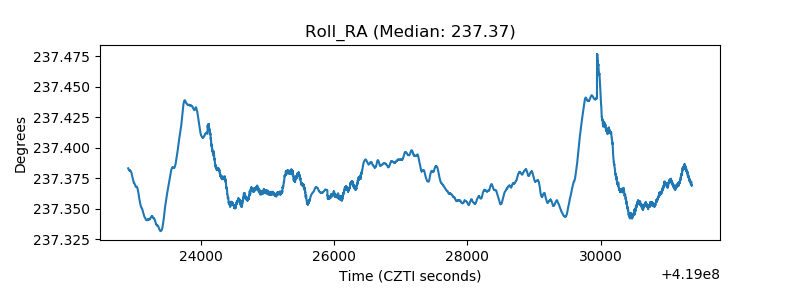 |
| Veto Counter | 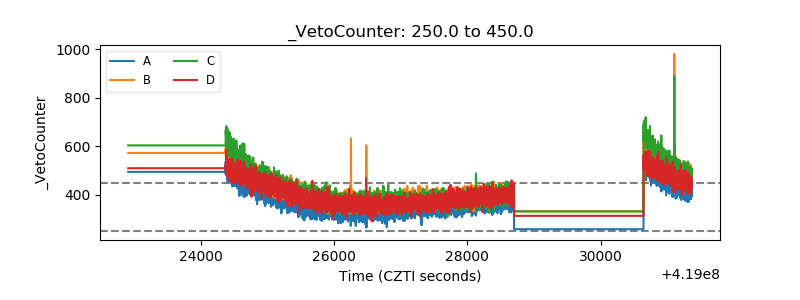 |