| Param | Original file | Final file |
|---|---|---|
| Filename | modeM0/AS1C07_001T10_9000005566_40764cztM0_level2.fits | modeM0/AS1C07_001T10_9000005566_40764cztM0_level2_quad_clean.evt |
| Size (bytes) | 444,211,200 | 86,112,000 |
| Size | 423.6 MB | 82.1 MB |
| Events in quadrant A | 2,698,364 | 608,877 |
| Events in quadrant B | 2,536,912 | 646,665 |
| Events in quadrant C | 5,163,890 | 583,866 |
| Events in quadrant D | 5,654,926 | 417,739 |
| Mode M9 | |||
|---|---|---|---|
| Quadrant | BADHDUFLAG | Total packets | Discarded packets |
| A | 0 | 28 | 0 |
| B | 0 | 28 | 0 |
| C | 0 | 28 | 0 |
| D | 0 | 29 | 0 |
| Mode M0 | |||
|---|---|---|---|
| Quadrant | BADHDUFLAG | Total packets | Discarded packets |
| A | 0 | 11110 | 3 |
| B | 0 | 10779 | 2 |
| C | 0 | 18699 | 2 |
| D | 0 | 20236 | 2 |
| Mode SS | |||
|---|---|---|---|
| Quadrant | BADHDUFLAG | Total packets | Discarded packets |
| A | 0 | 100 | 0 |
| B | 0 | 100 | 0 |
| C | 0 | 100 | 0 |
| D | 0 | 100 | 0 |
| Quadrant | Total seconds | Saturated seconds | Saturation percentage |
|---|---|---|---|
| A | 5004 | 9 | 0.179856% |
| B | 5004 | 16 | 0.319744% |
| C | 5004 | 522 | 10.431655% |
| D | 5004 | 1306 | 26.099121% |
Noise dominated data is calculated using 1-second bins in cleaned event files. If a bin has >2000 counts, and if more than 50% of those come from <1% of pixels, then it is considered to be noise-dominated and hence unusable.
| Quadrant | # 1 sec bins | Bins with >0 counts | Bins with >2000 counts | High rate bins dominated by noise | Noise dominated (total time) | Noise dominated (detector-on time) | Marked lightcurve |
|---|---|---|---|---|---|---|---|
| A | 7037 | 5005 | 4 | 4 | 0.06% | 0.08% | 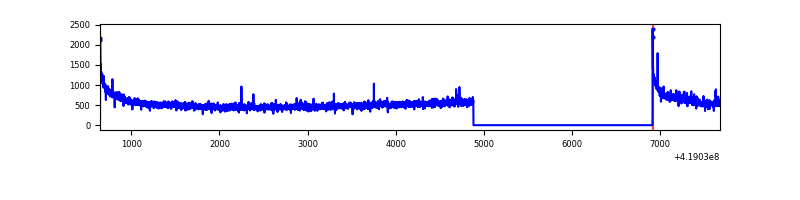 |
| B | 7037 | 5005 | 2 | 2 | 0.03% | 0.04% | 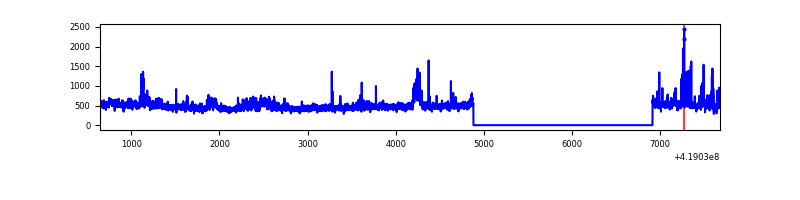 |
| C | 7037 | 5005 | 580 | 580 | 8.24% | 11.59% | 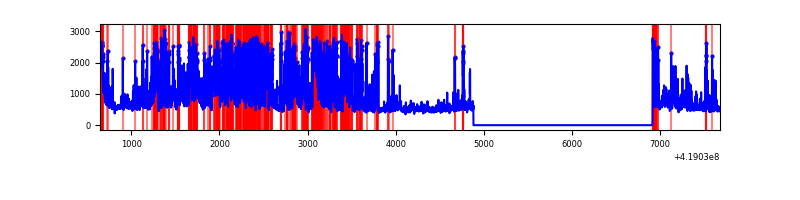 |
| D | 7037 | 5005 | 1012 | 1012 | 14.38% | 20.22% | 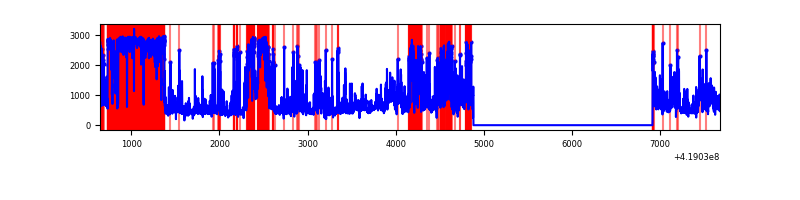 |
Top three noisy pixels from each quadrant. If the there are fewer than three noisy pixels in the level2.evt file, extra rows are filled as -1
| Pixel properties | Quadrant properties | ||||||
|---|---|---|---|---|---|---|---|
| Quadrant | DetID | PixID | Counts | Sigma | Mean | Median | Sigma |
| A | 10 | 83 | 467855 | 4113.65 | 558 | 548 | 113.6 |
| A | 12 | 189 | 38412 | 333.31 | 558 | 548 | 113.6 |
| A | 6 | 10 | 30766 | 266.01 | 558 | 548 | 113.6 |
| B | 0 | 229 | 218356 | 2043.85 | 569 | 554 | 106.6 |
| B | 4 | 171 | 51967 | 482.46 | 569 | 554 | 106.6 |
| B | 5 | 255 | 32776 | 302.37 | 569 | 554 | 106.6 |
| C | 9 | 187 | 2743333 | 22054.3 | 542 | 547 | 124.4 |
| C | 15 | 214 | 208933 | 1675.6 | 542 | 547 | 124.4 |
| C | 0 | 10 | 88537 | 707.51 | 542 | 547 | 124.4 |
| D | 12 | 227 | 2864310 | 25065.53 | 460 | 446 | 114.3 |
| D | 1 | 47 | 404416 | 3535.69 | 460 | 446 | 114.3 |
| D | 2 | 249 | 186069 | 1624.64 | 460 | 446 | 114.3 |
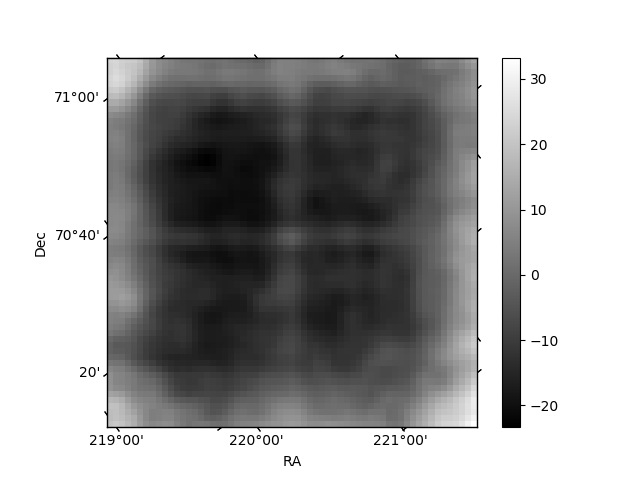
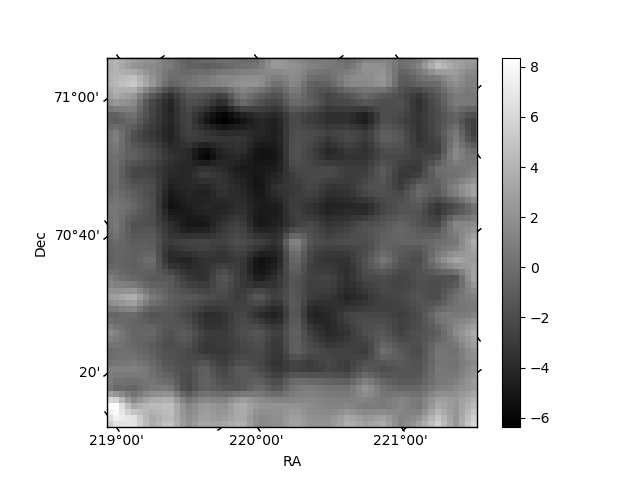
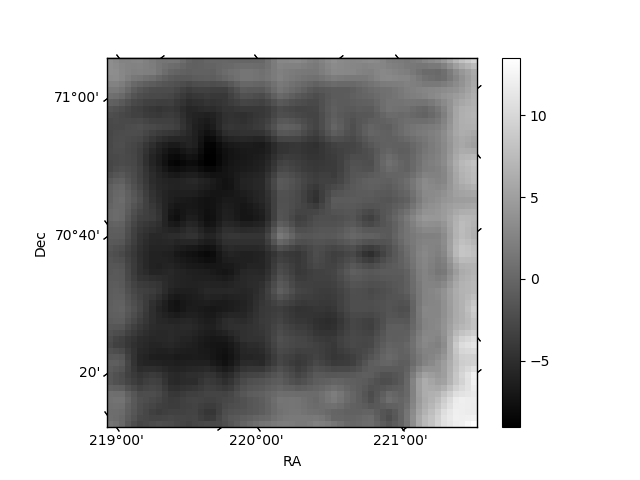
Histogram calculated using DETX and DETY for each event in the final _common_clean file
| Quadrant A | 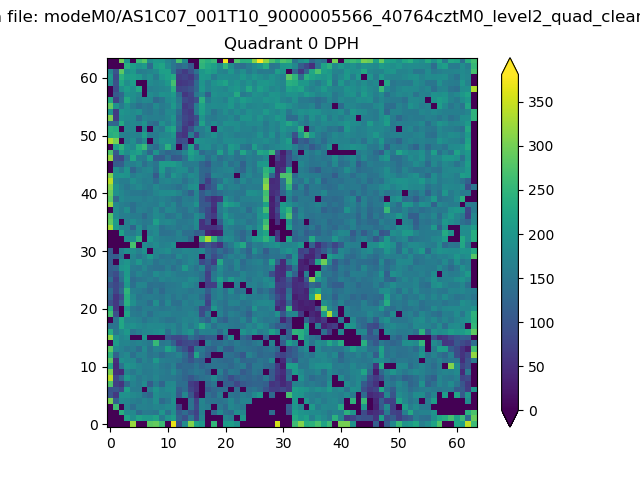 |
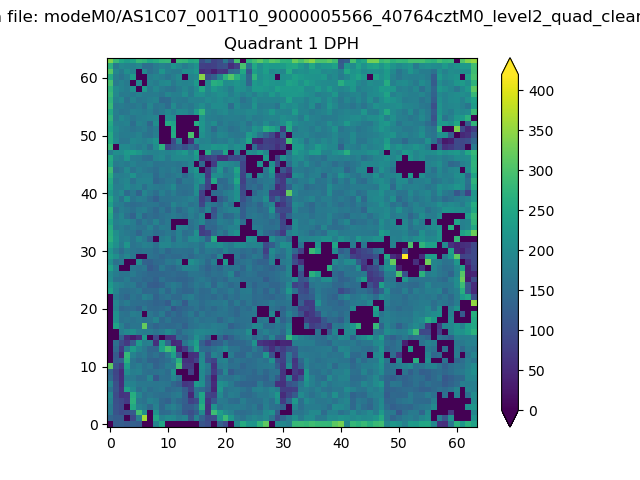 |
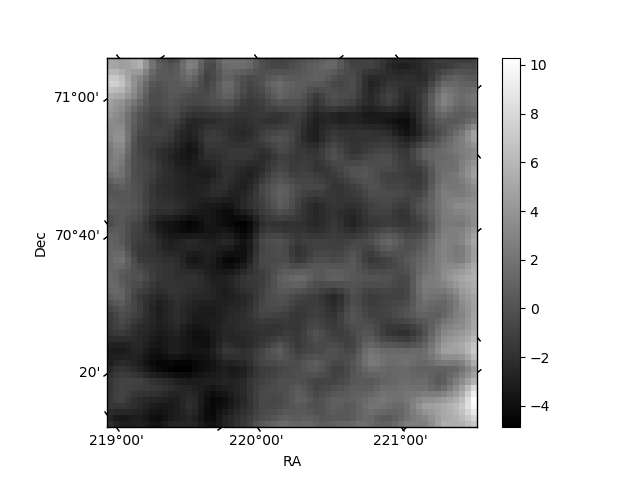
Quadrant B |
|---|---|---|---|
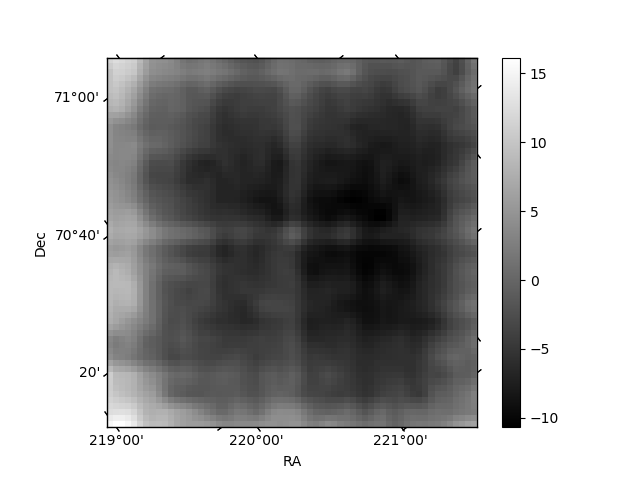
| Quadrant D | 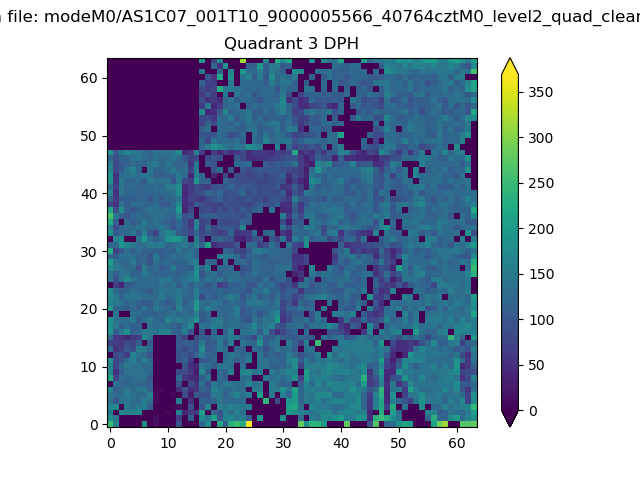 |
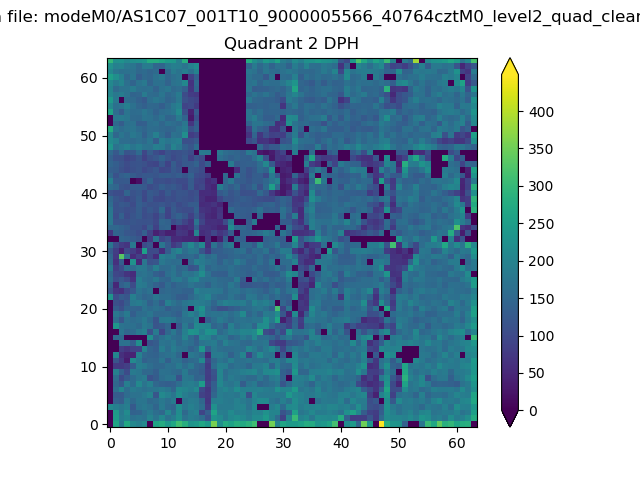 |
Quadrant C |
| Plot type | Count rate plots | Images |
|---|---|---|
| Comparison with Poisson distribution Blue bars denote a histogram of data divided into 1 sec bins. Red curve is a Poisson curve with rate = median count rate of data. |
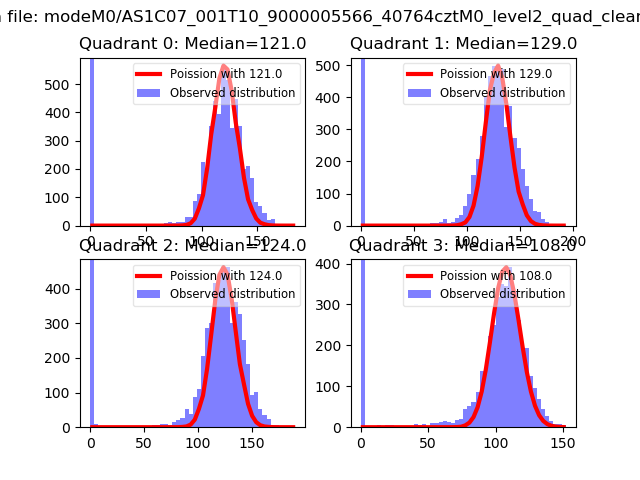 |
 |
| Quadrant-wise count rates Data is divided into 100 sec bins |
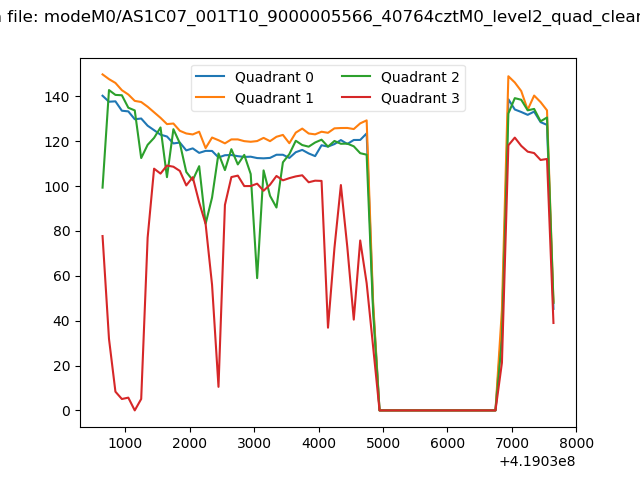 |
|
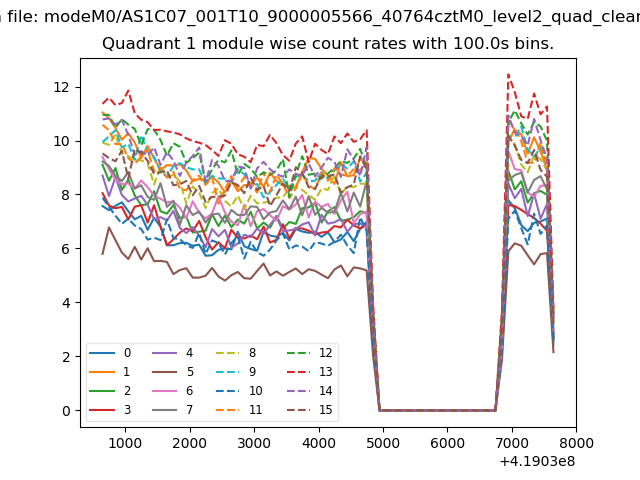
| Module-wise count rates for Quadrant A Data is divided into 100 sec bins |
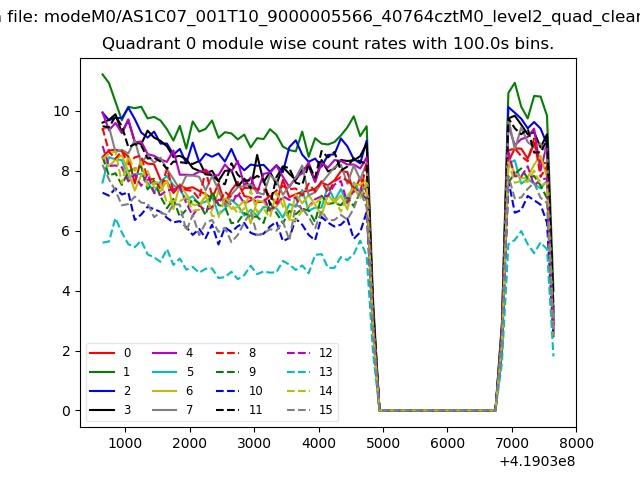 |
 |
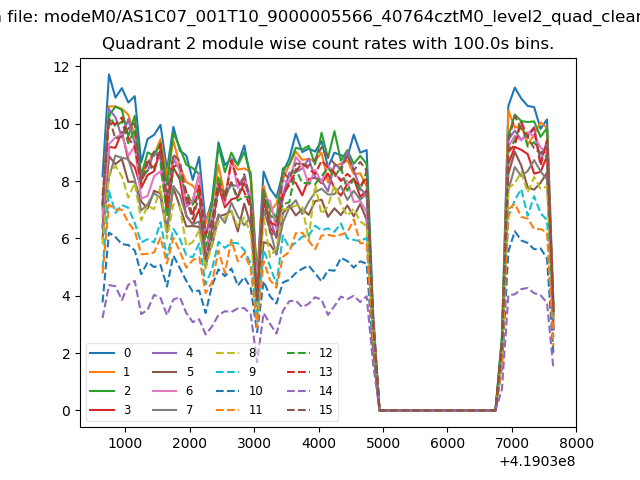
| Module-wise count rates for Quadrant B Data is divided into 100 sec bins |
 |
 |
| Module-wise count rates for Quadrant C Data is divided into 100 sec bins |
 |
 |
| Module-wise count rates for Quadrant D Data is divided into 100 sec bins |
 |
 |
| Parameter | Plot |
|---|---|
| CZT HV Monitor | 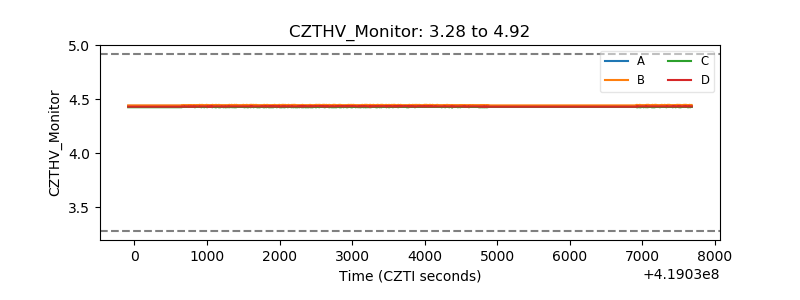 |
| D_VDD | 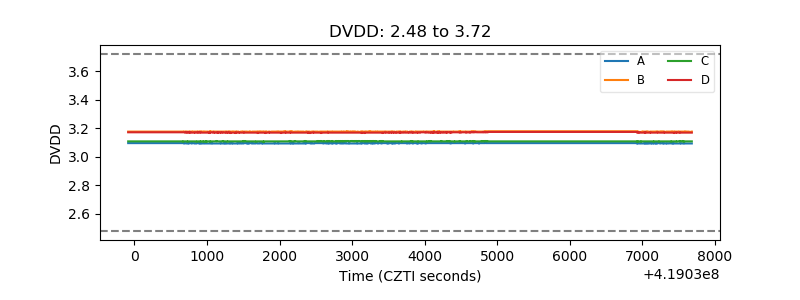 |
| Temperature 1 | 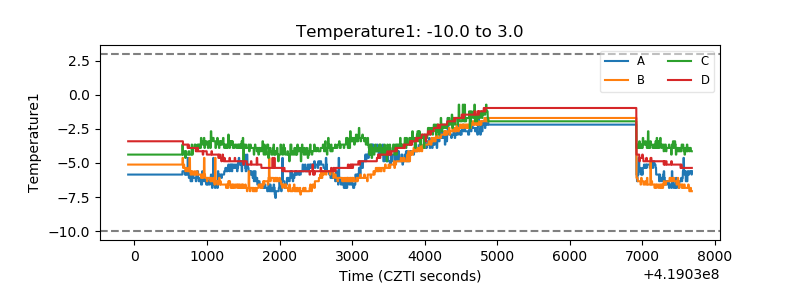 |
| Veto HV Monitor |  |
| Veto LLD | 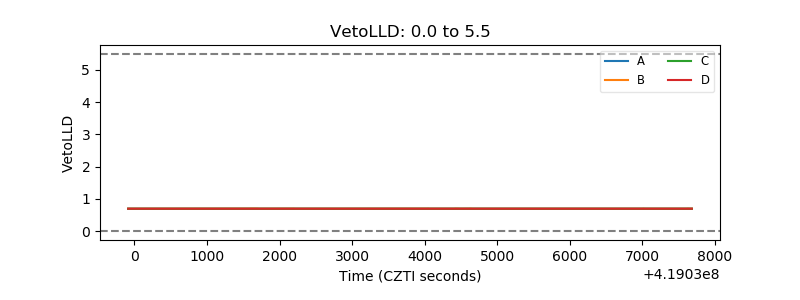 |
| Alpha Counter | 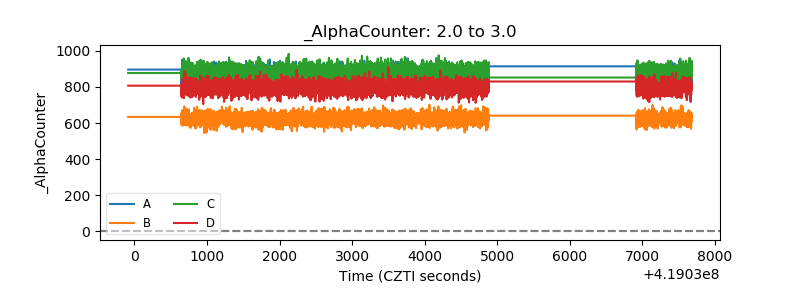 |
| _CPM_Rate | 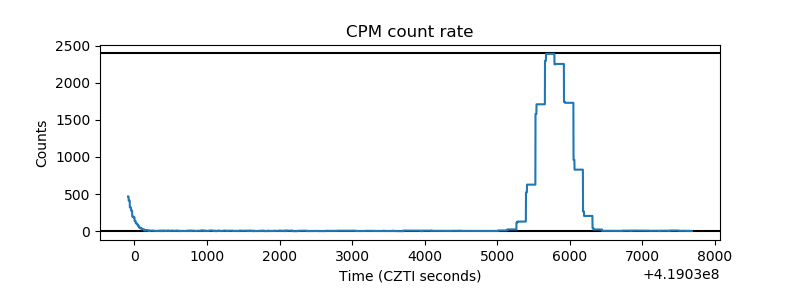 |
| CZT Counter | 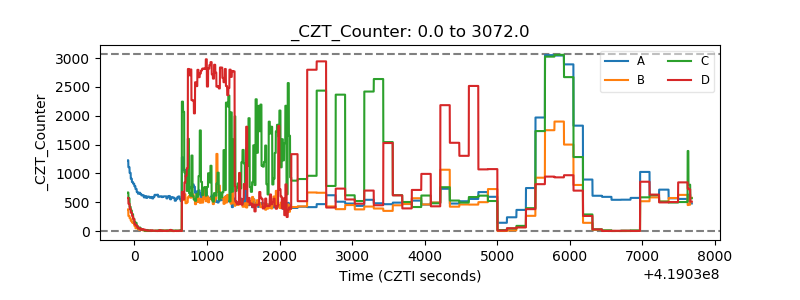 |
| +2.5 Volts monitor | 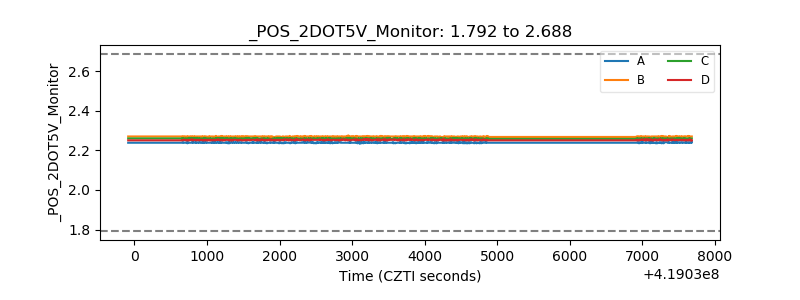 |
| +5 Volts monitor | 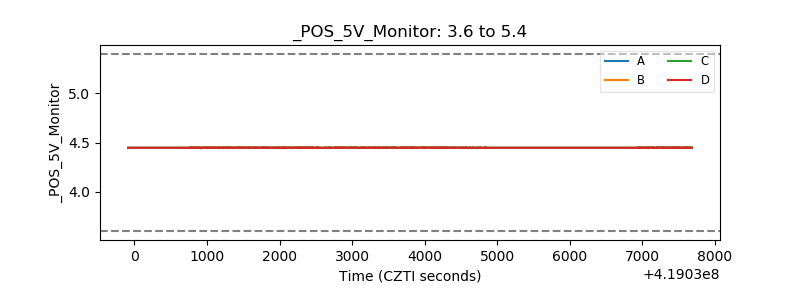 |
| _ROLL_ROT | 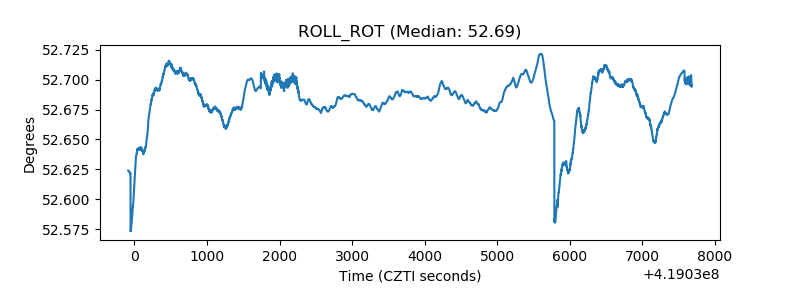 |
| _Roll_DEC | 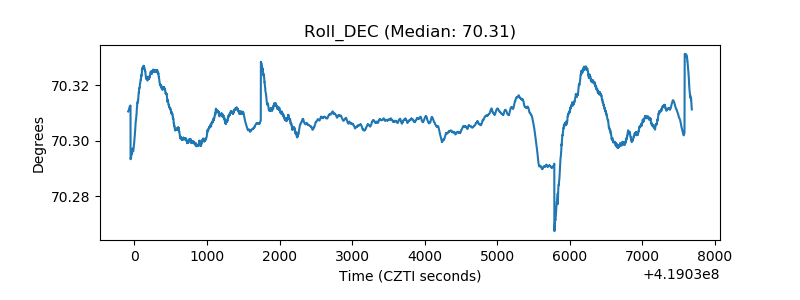 |
| _Roll_RA | 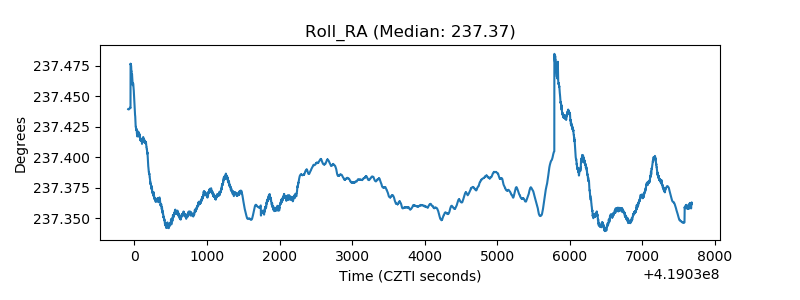 |
| Veto Counter | 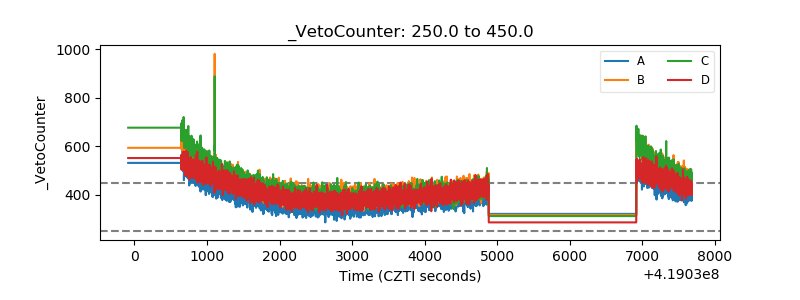 |