| Param | Original file | Final file |
|---|---|---|
| Filename | modeM0/AS1C07_001T10_9000005566_40765cztM0_level2.fits | modeM0/AS1C07_001T10_9000005566_40765cztM0_level2_quad_clean.evt |
| Size (bytes) | 509,757,120 | 78,779,520 |
| Size | 486.1 MB | 75.1 MB |
| Events in quadrant A | 2,808,270 | 596,340 |
| Events in quadrant B | 2,624,394 | 626,612 |
| Events in quadrant C | 8,187,450 | 342,343 |
| Events in quadrant D | 4,864,531 | 473,112 |
| Mode M9 | |||
|---|---|---|---|
| Quadrant | BADHDUFLAG | Total packets | Discarded packets |
| A | 0 | 31 | 0 |
| B | 0 | 31 | 0 |
| C | 0 | 31 | 0 |
| D | 0 | 32 | 0 |
| Mode M0 | |||
|---|---|---|---|
| Quadrant | BADHDUFLAG | Total packets | Discarded packets |
| A | 0 | 11435 | 3 |
| B | 0 | 11060 | 2 |
| C | 0 | 27698 | 2 |
| D | 0 | 17859 | 2 |
| Mode SS | |||
|---|---|---|---|
| Quadrant | BADHDUFLAG | Total packets | Discarded packets |
| A | 0 | 100 | 0 |
| B | 0 | 100 | 0 |
| C | 0 | 100 | 0 |
| D | 0 | 100 | 0 |
| Quadrant | Total seconds | Saturated seconds | Saturation percentage |
|---|---|---|---|
| A | 4949 | 17 | 0.343504% |
| B | 4949 | 59 | 1.192160% |
| C | 4949 | 2412 | 48.737119% |
| D | 4949 | 815 | 16.467973% |
Noise dominated data is calculated using 1-second bins in cleaned event files. If a bin has >2000 counts, and if more than 50% of those come from <1% of pixels, then it is considered to be noise-dominated and hence unusable.
| Quadrant | # 1 sec bins | Bins with >0 counts | Bins with >2000 counts | High rate bins dominated by noise | Noise dominated (total time) | Noise dominated (detector-on time) | Marked lightcurve |
|---|---|---|---|---|---|---|---|
| A | 7072 | 4950 | 9 | 9 | 0.13% | 0.18% | 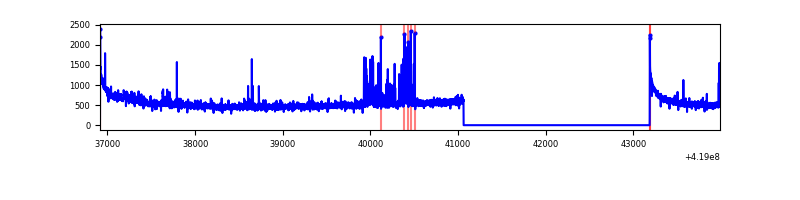 |
| B | 7072 | 4950 | 34 | 34 | 0.48% | 0.69% | 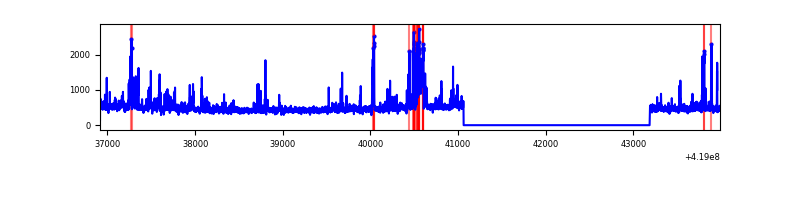 |
| C | 7071 | 4948 | 2201 | 2201 | 31.13% | 44.48% | 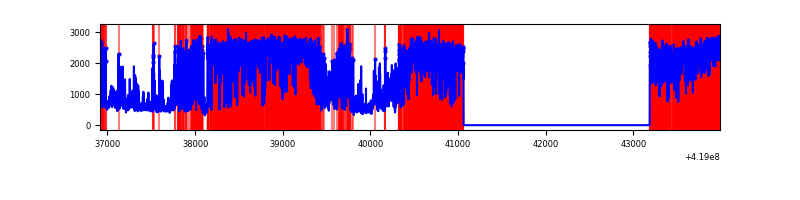 |
| D | 7072 | 4949 | 527 | 527 | 7.45% | 10.65% | 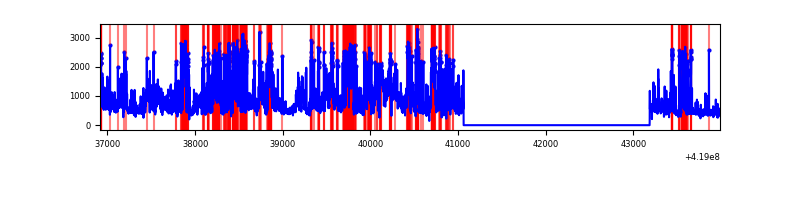 |
Top three noisy pixels from each quadrant. If the there are fewer than three noisy pixels in the level2.evt file, extra rows are filled as -1
| Pixel properties | Quadrant properties | ||||||
|---|---|---|---|---|---|---|---|
| Quadrant | DetID | PixID | Counts | Sigma | Mean | Median | Sigma |
| A | 10 | 83 | 469084 | 4211.09 | 548 | 538 | 111.3 |
| A | 6 | 10 | 152229 | 1363.33 | 548 | 538 | 111.3 |
| A | 12 | 189 | 38745 | 343.39 | 548 | 538 | 111.3 |
| B | 0 | 229 | 196664 | 1858.97 | 556 | 542 | 105.5 |
| B | 4 | 171 | 123377 | 1164.31 | 556 | 542 | 105.5 |
| B | 5 | 255 | 75047 | 706.21 | 556 | 542 | 105.5 |
| C | 9 | 187 | 6321006 | 65718.09 | 420 | 423 | 96.2 |
| C | 15 | 214 | 164529 | 1706.29 | 420 | 423 | 96.2 |
| C | 0 | 10 | 47424 | 488.69 | 420 | 423 | 96.2 |
| D | 12 | 227 | 1848026 | 15052.36 | 497 | 483 | 122.7 |
| D | 13 | 249 | 649426 | 5287.09 | 497 | 483 | 122.7 |
| D | 2 | 249 | 180374 | 1465.61 | 497 | 483 | 122.7 |
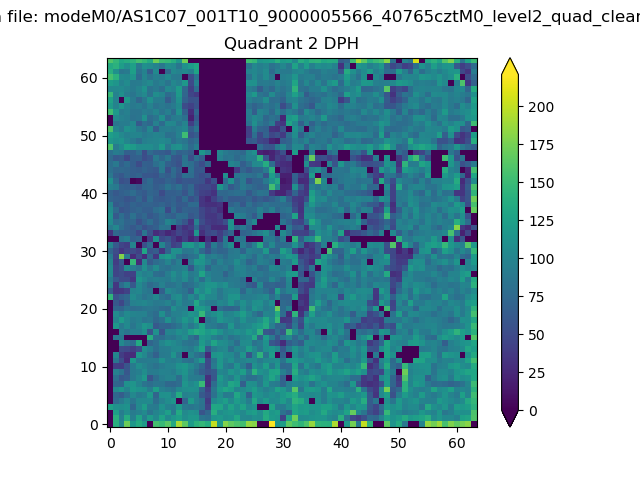
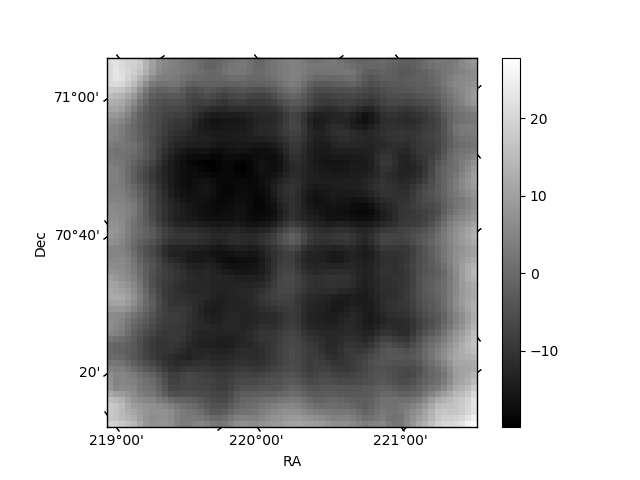
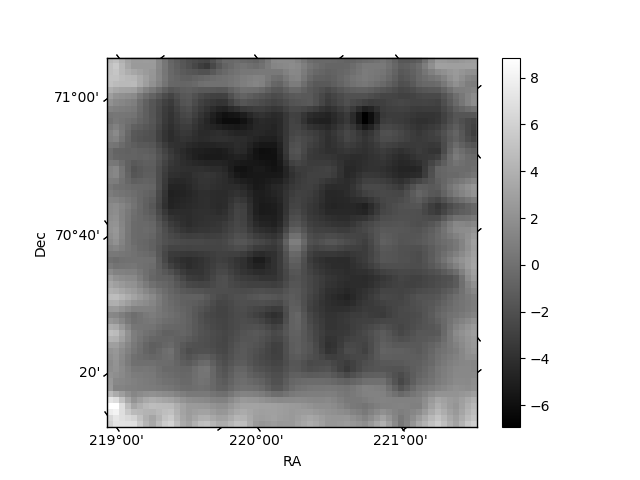
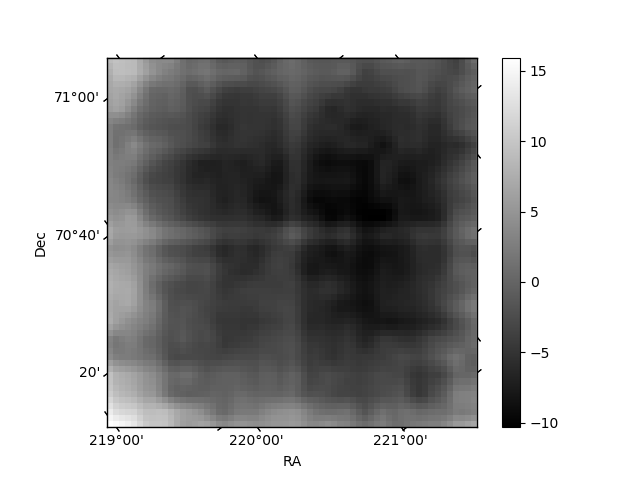
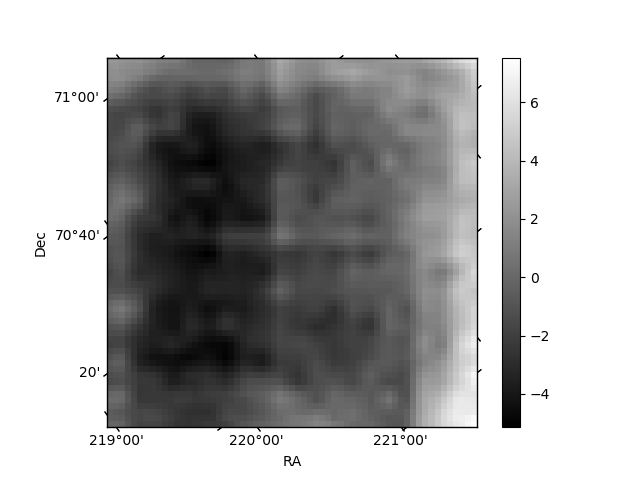
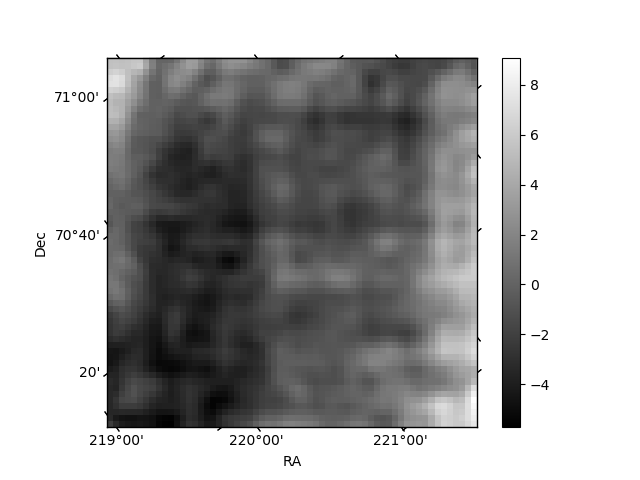
Histogram calculated using DETX and DETY for each event in the final _common_clean file
| Quadrant A | 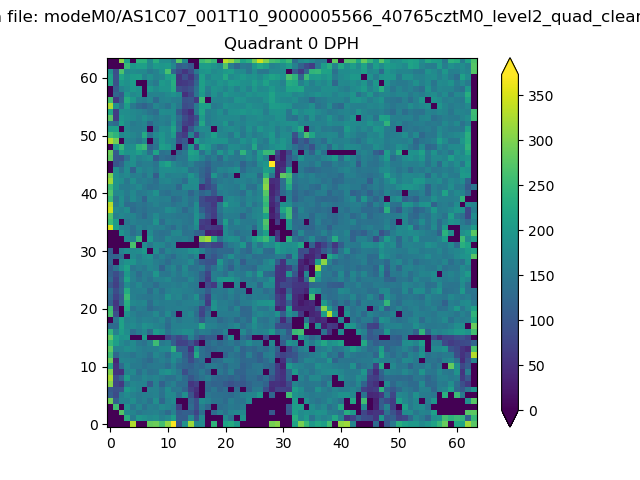 |
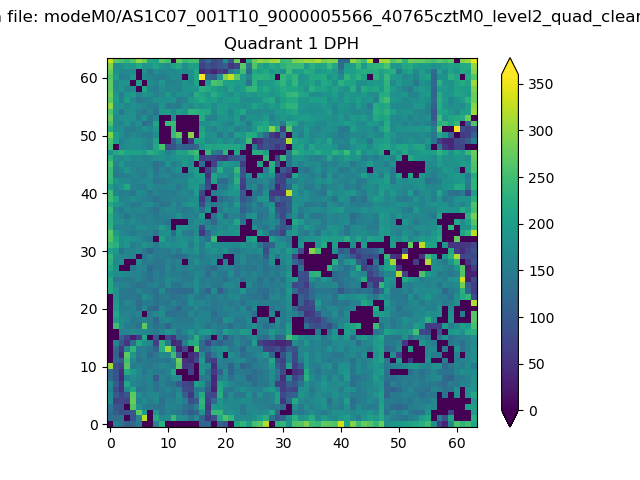 |
Quadrant B |
|---|---|---|---|
| Quadrant D | 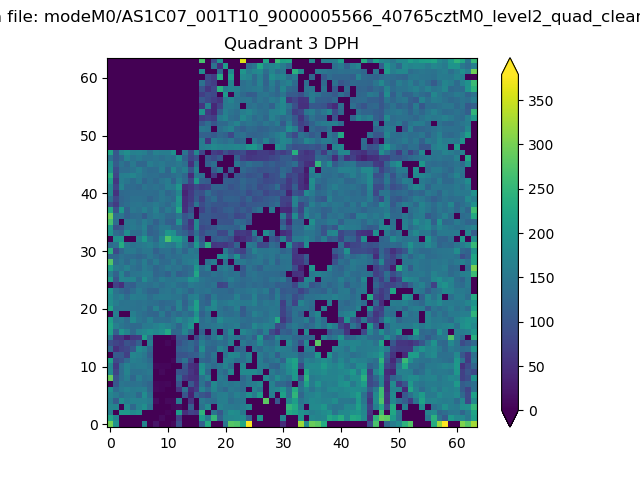 |
 |
Quadrant C |
| Plot type | Count rate plots | Images |
|---|---|---|
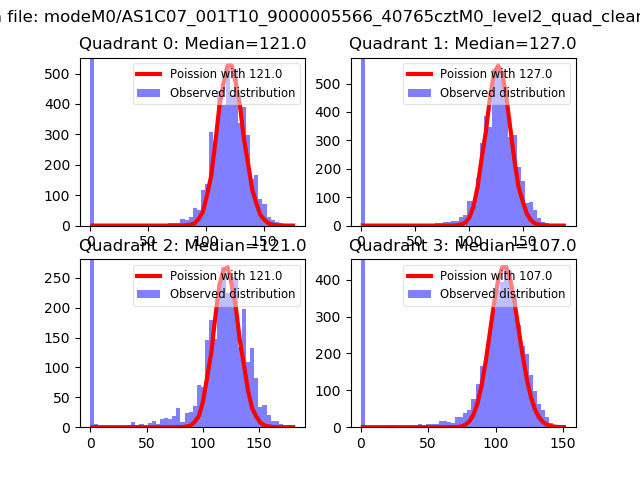
| Comparison with Poisson distribution Blue bars denote a histogram of data divided into 1 sec bins. Red curve is a Poisson curve with rate = median count rate of data. |
 |
 |
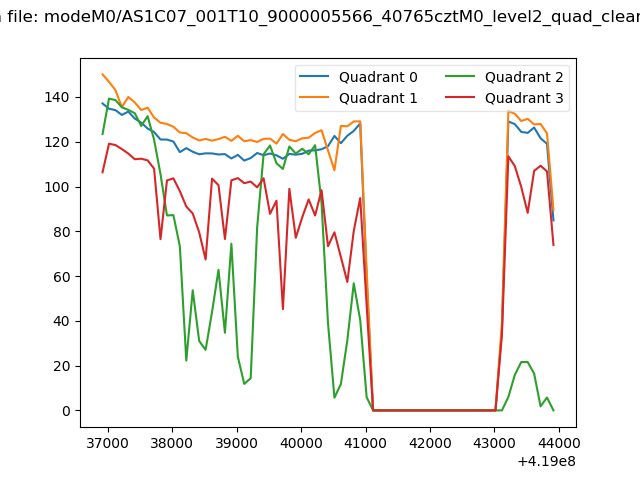
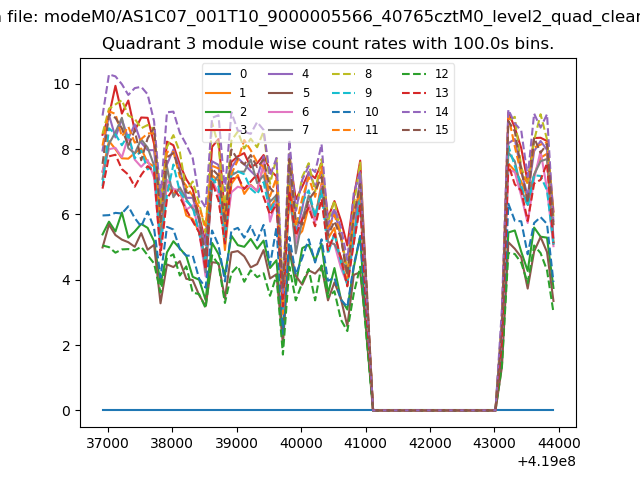
| Quadrant-wise count rates Data is divided into 100 sec bins |
 |
|
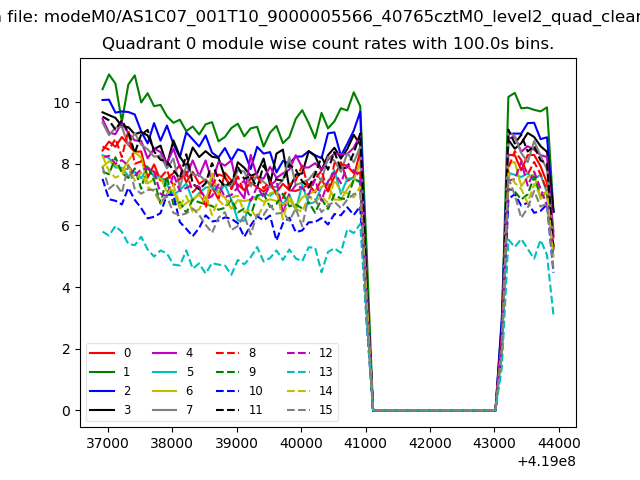
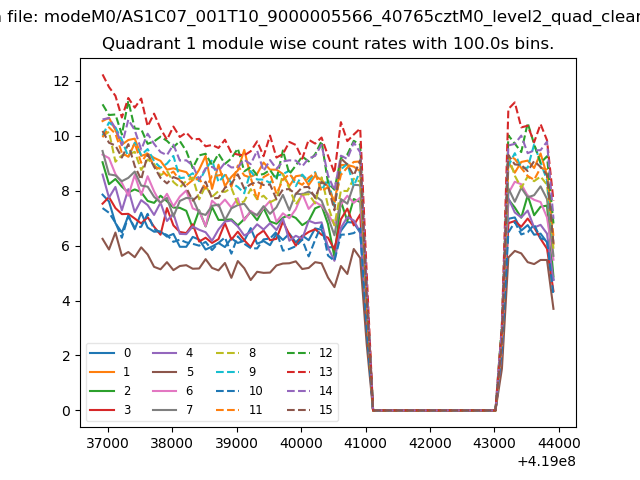
| Module-wise count rates for Quadrant A Data is divided into 100 sec bins |
 |
 |
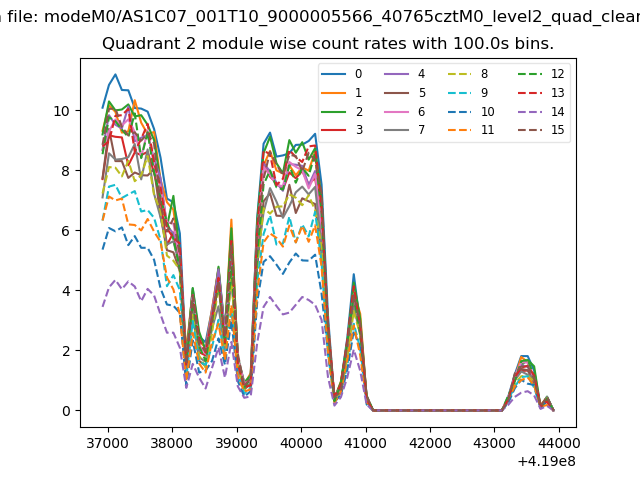
| Module-wise count rates for Quadrant B Data is divided into 100 sec bins |
 |
 |
| Module-wise count rates for Quadrant C Data is divided into 100 sec bins |
 |
 |
| Module-wise count rates for Quadrant D Data is divided into 100 sec bins |
 |
 |
| Parameter | Plot |
|---|---|
| CZT HV Monitor | 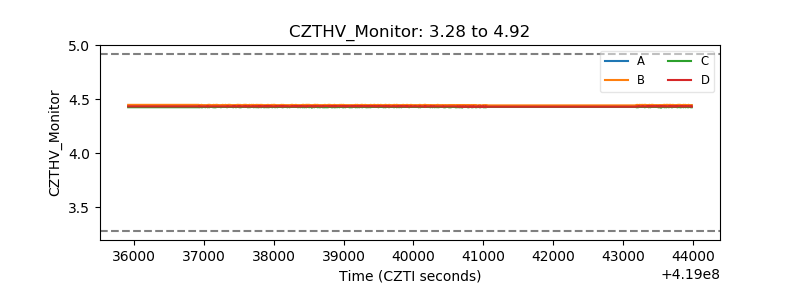 |
| D_VDD | 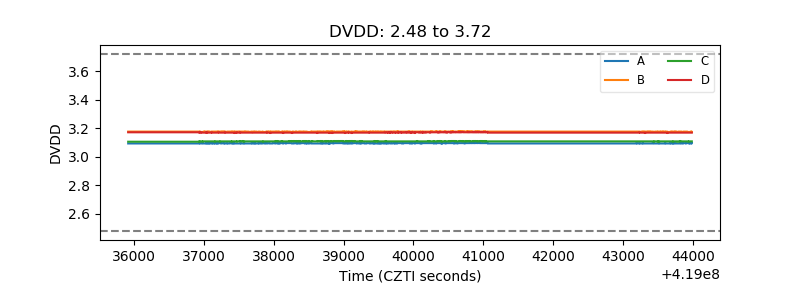 |
| Temperature 1 |  |
| Veto HV Monitor | 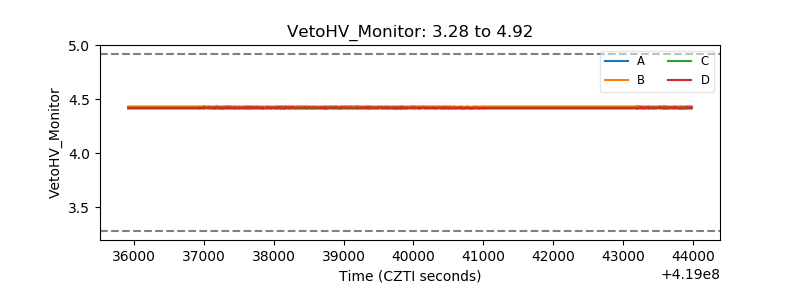 |
| Veto LLD | 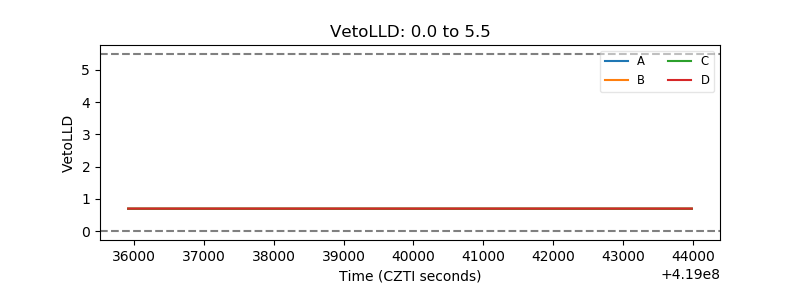 |
| Alpha Counter | 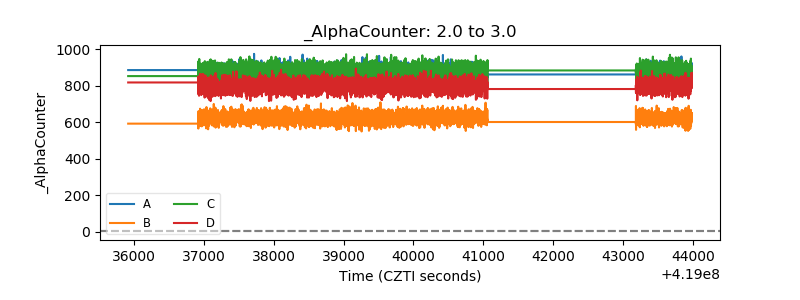 |
| _CPM_Rate | 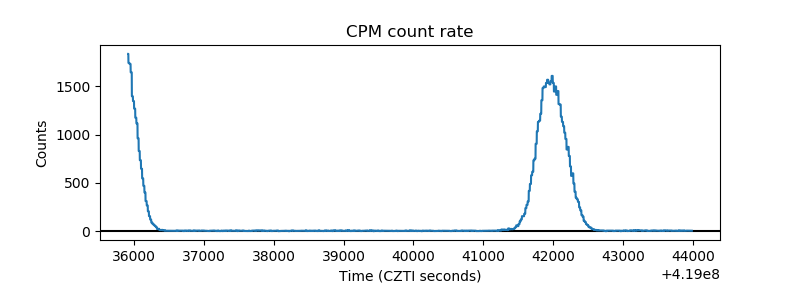 |
| CZT Counter |  |
| +2.5 Volts monitor | 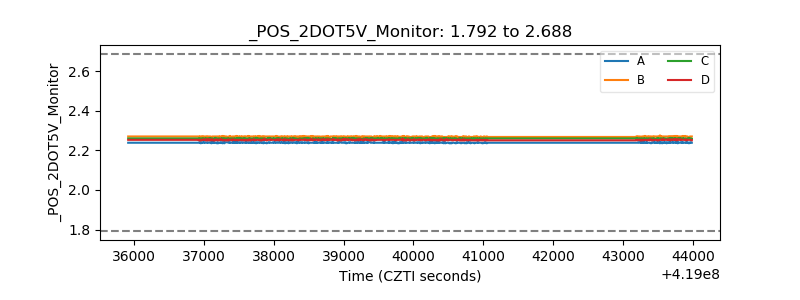 |
| +5 Volts monitor | 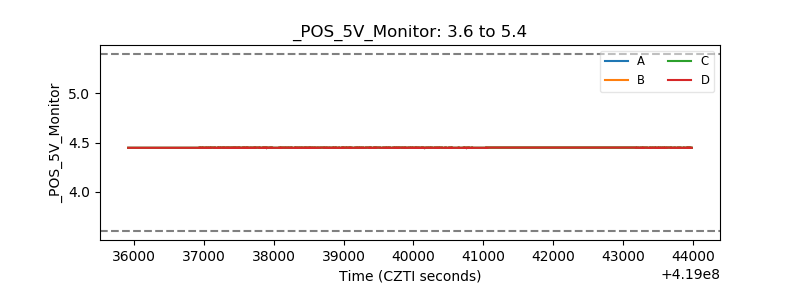 |
| _ROLL_ROT | 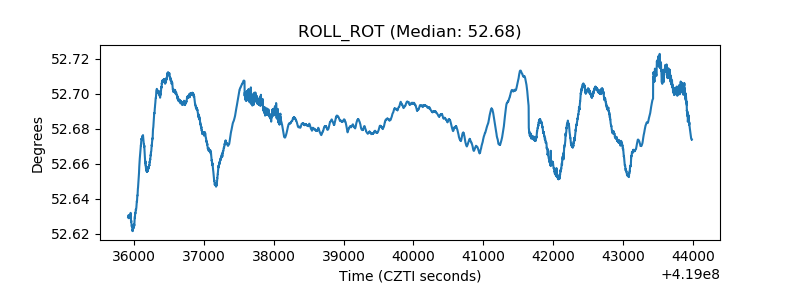 |
| _Roll_DEC | 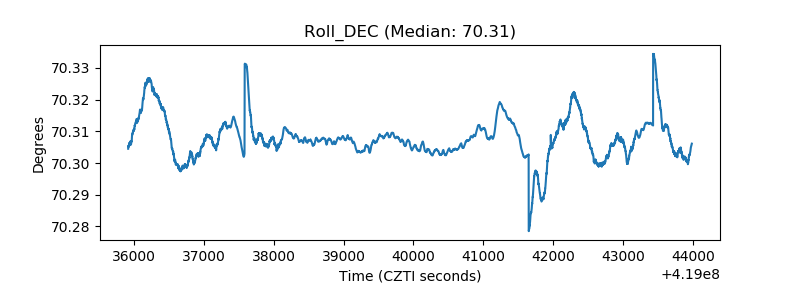 |
| _Roll_RA | 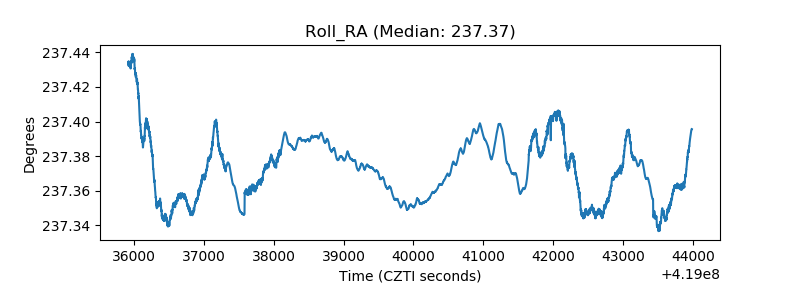 |
| Veto Counter | 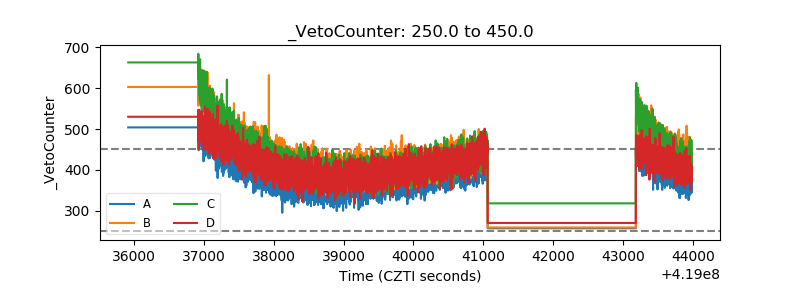 |