| Param | Original file | Final file |
|---|---|---|
| Filename | modeM0/AS1C07_001T10_9000005566_40766cztM0_level2.fits | modeM0/AS1C07_001T10_9000005566_40766cztM0_level2_quad_clean.evt |
| Size (bytes) | 506,119,680 | 79,122,240 |
| Size | 482.7 MB | 75.5 MB |
| Events in quadrant A | 2,783,801 | 601,921 |
| Events in quadrant B | 2,702,403 | 631,164 |
| Events in quadrant C | 8,386,690 | 345,068 |
| Events in quadrant D | 4,455,539 | 451,583 |
| Mode M9 | |||
|---|---|---|---|
| Quadrant | BADHDUFLAG | Total packets | Discarded packets |
| A | 0 | 35 | 0 |
| B | 0 | 35 | 0 |
| C | 0 | 35 | 0 |
| D | 0 | 36 | 0 |
| Mode M0 | |||
|---|---|---|---|
| Quadrant | BADHDUFLAG | Total packets | Discarded packets |
| A | 0 | 11522 | 3 |
| B | 0 | 11622 | 2 |
| C | 0 | 28513 | 2 |
| D | 0 | 16911 | 2 |
| Mode SS | |||
|---|---|---|---|
| Quadrant | BADHDUFLAG | Total packets | Discarded packets |
| A | 0 | 108 | 0 |
| B | 0 | 108 | 0 |
| C | 0 | 108 | 0 |
| D | 0 | 108 | 0 |
| Quadrant | Total seconds | Saturated seconds | Saturation percentage |
|---|---|---|---|
| A | 5218 | 12 | 0.229973% |
| B | 5218 | 67 | 1.284017% |
| C | 5218 | 2390 | 45.802990% |
| D | 5218 | 1045 | 20.026830% |
Noise dominated data is calculated using 1-second bins in cleaned event files. If a bin has >2000 counts, and if more than 50% of those come from <1% of pixels, then it is considered to be noise-dominated and hence unusable.
| Quadrant | # 1 sec bins | Bins with >0 counts | Bins with >2000 counts | High rate bins dominated by noise | Noise dominated (total time) | Noise dominated (detector-on time) | Marked lightcurve |
|---|---|---|---|---|---|---|---|
| A | 7340 | 5219 | 5 | 5 | 0.07% | 0.10% | 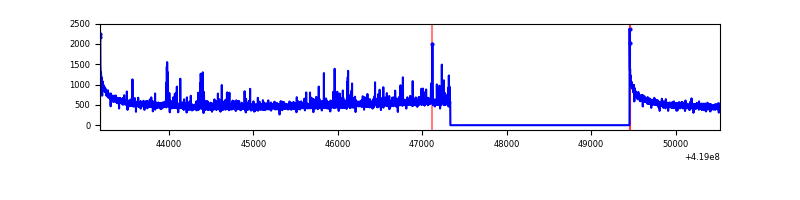 |
| B | 7340 | 5219 | 37 | 37 | 0.50% | 0.71% | 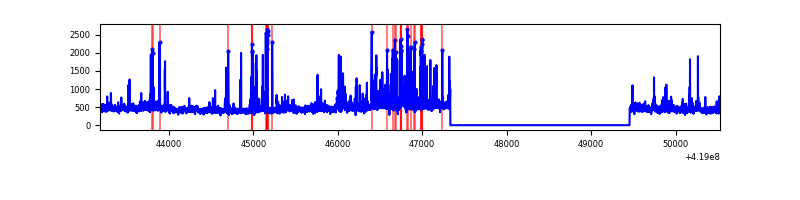 |
| C | 7340 | 5219 | 2173 | 2173 | 29.60% | 41.64% | 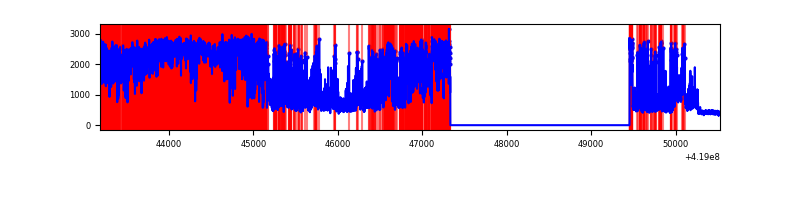 |
| D | 7340 | 5218 | 260 | 260 | 3.54% | 4.98% | 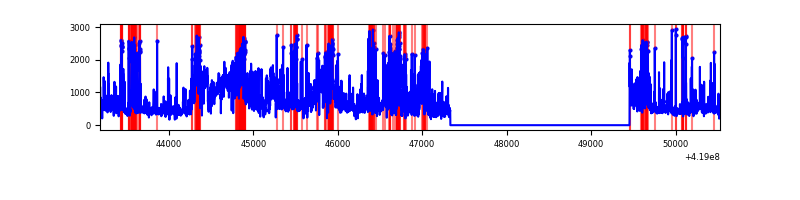 |
Top three noisy pixels from each quadrant. If the there are fewer than three noisy pixels in the level2.evt file, extra rows are filled as -1
| Pixel properties | Quadrant properties | ||||||
|---|---|---|---|---|---|---|---|
| Quadrant | DetID | PixID | Counts | Sigma | Mean | Median | Sigma |
| A | 10 | 83 | 493306 | 4231.81 | 567 | 558 | 116.4 |
| A | 7 | 3 | 39165 | 331.56 | 567 | 558 | 116.4 |
| A | 6 | 10 | 36382 | 307.66 | 567 | 558 | 116.4 |
| B | 4 | 171 | 152324 | 1397.7 | 570 | 555 | 108.6 |
| B | 0 | 229 | 98097 | 898.3 | 570 | 555 | 108.6 |
| B | 0 | 190 | 95262 | 872.19 | 570 | 555 | 108.6 |
| C | 9 | 187 | 6478629 | 67042.81 | 419 | 421 | 96.6 |
| C | 15 | 214 | 170610 | 1761.28 | 419 | 421 | 96.6 |
| C | 0 | 10 | 57396 | 589.63 | 419 | 421 | 96.6 |
| D | 13 | 249 | 1181992 | 9927.44 | 485 | 472 | 119.0 |
| D | 12 | 227 | 476792 | 4002.16 | 485 | 472 | 119.0 |
| D | 2 | 249 | 375768 | 3153.33 | 485 | 472 | 119.0 |
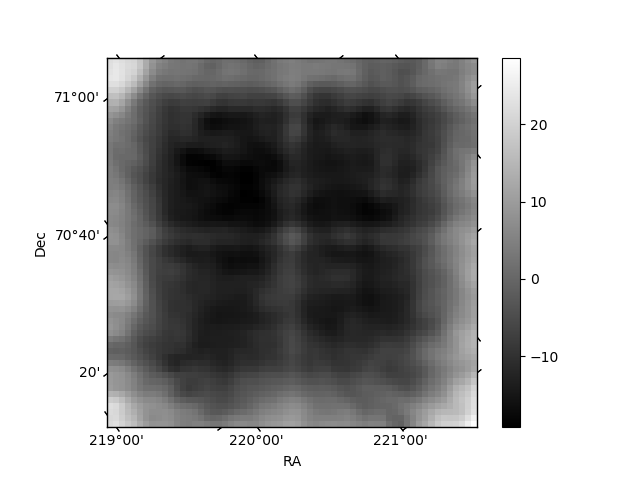
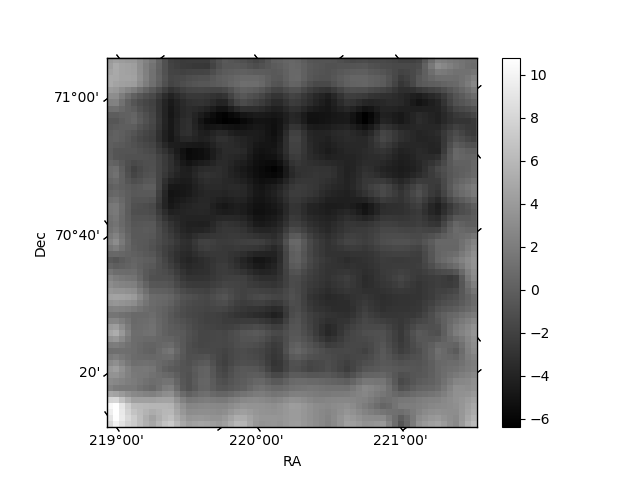
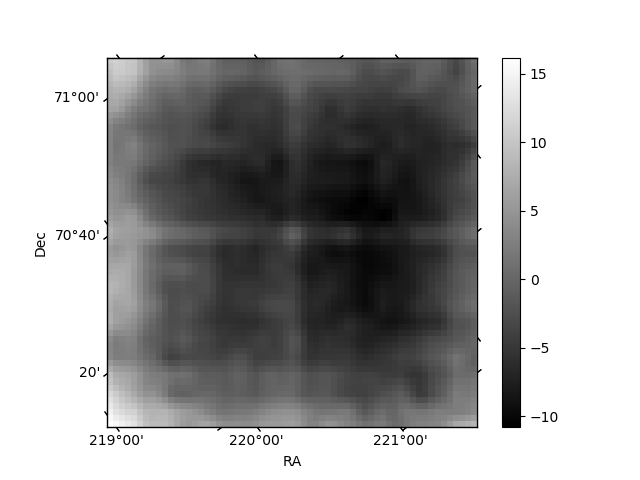
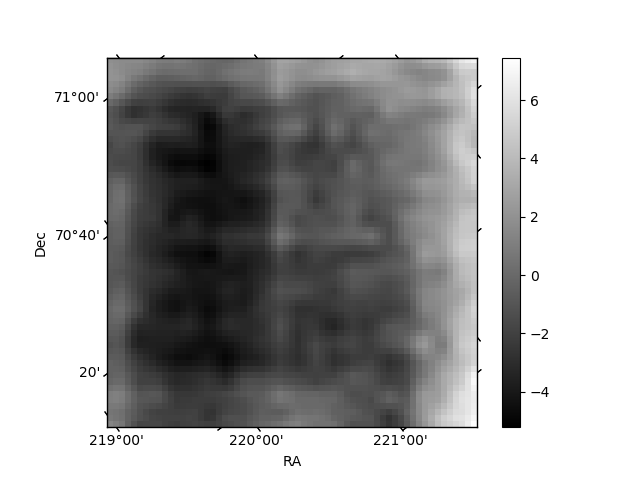
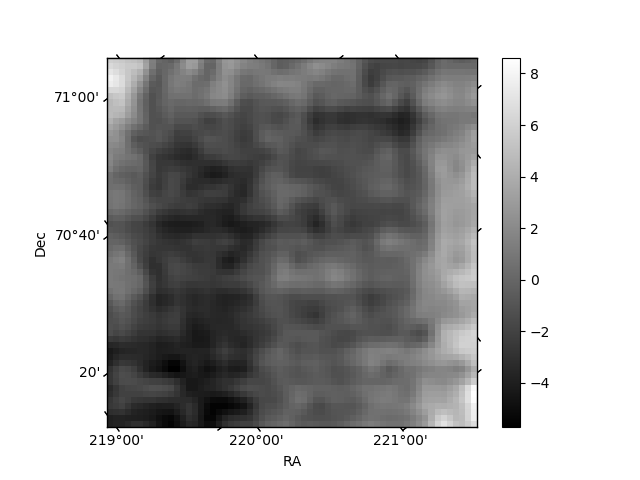
Histogram calculated using DETX and DETY for each event in the final _common_clean file
| Quadrant A | 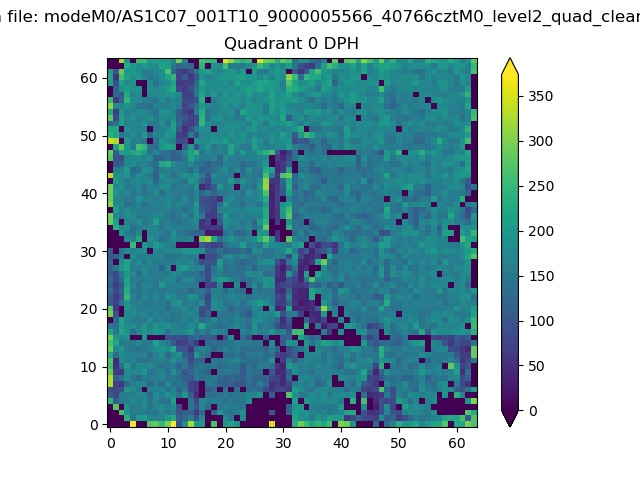 |
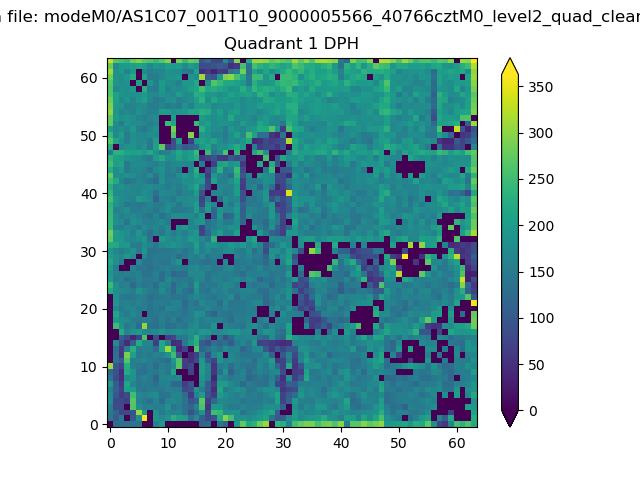 |
Quadrant B |
|---|---|---|---|
| Quadrant D | 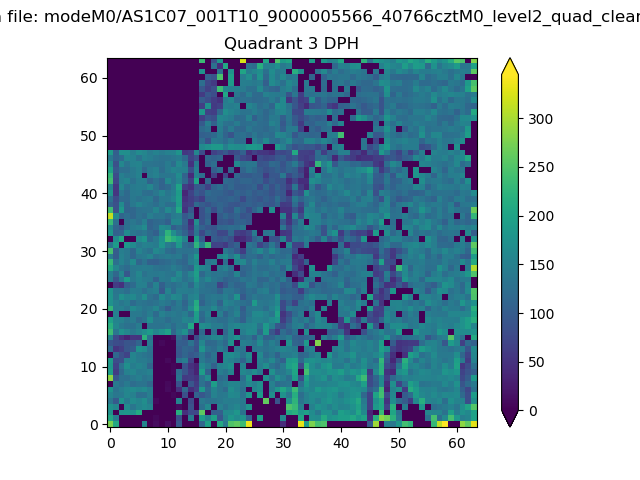 |
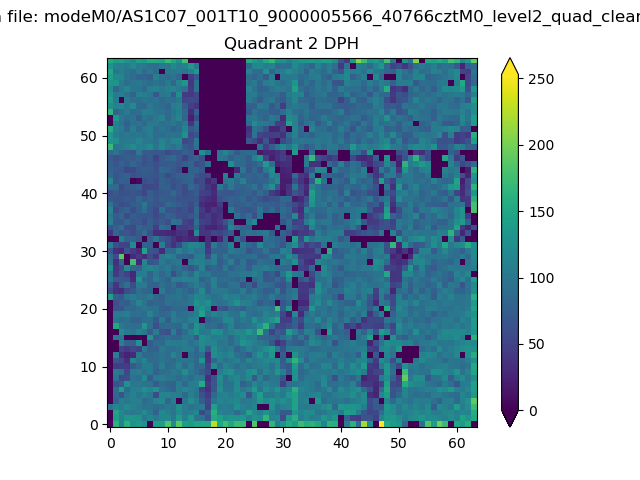 |
Quadrant C |
| Plot type | Count rate plots | Images |
|---|---|---|
| Comparison with Poisson distribution Blue bars denote a histogram of data divided into 1 sec bins. Red curve is a Poisson curve with rate = median count rate of data. |
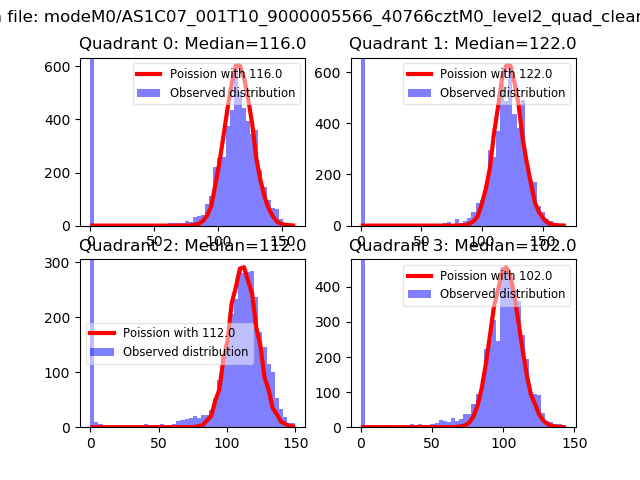 |
 |
| Quadrant-wise count rates Data is divided into 100 sec bins |
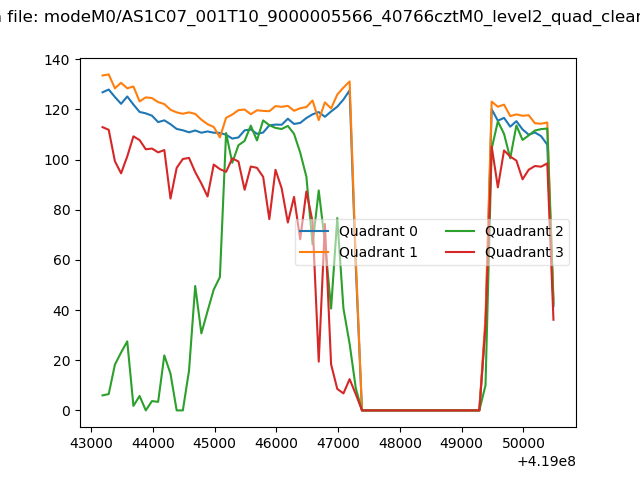 |
|
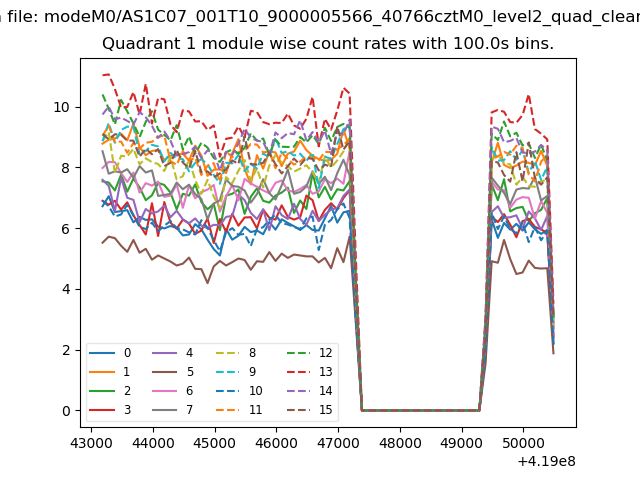
| Module-wise count rates for Quadrant A Data is divided into 100 sec bins |
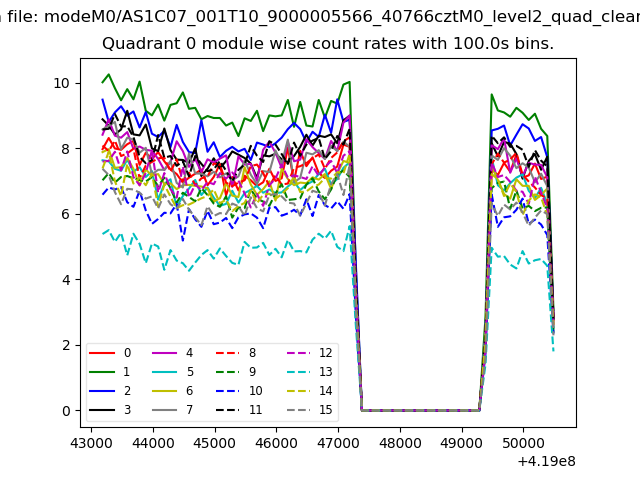 |
 |
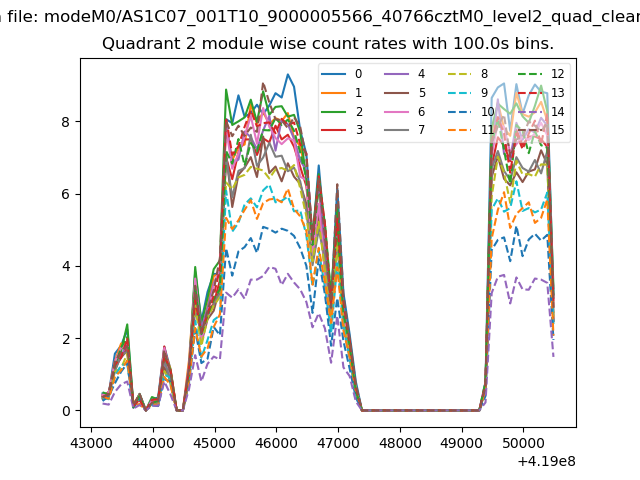
| Module-wise count rates for Quadrant B Data is divided into 100 sec bins |
 |
 |
| Module-wise count rates for Quadrant C Data is divided into 100 sec bins |
 |
 |
| Module-wise count rates for Quadrant D Data is divided into 100 sec bins |
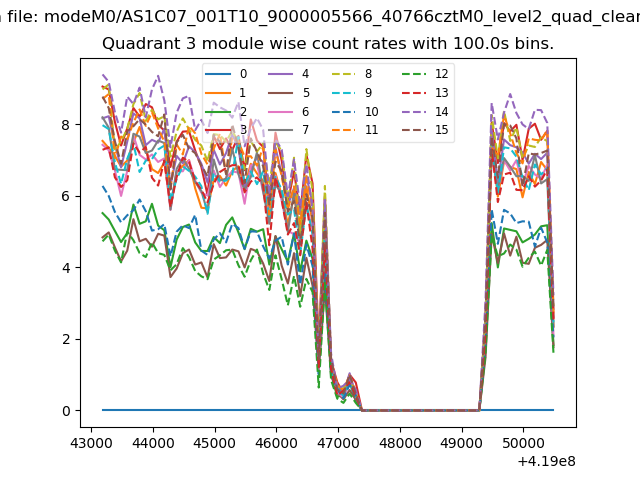 |
 |
| Parameter | Plot |
|---|---|
| CZT HV Monitor | 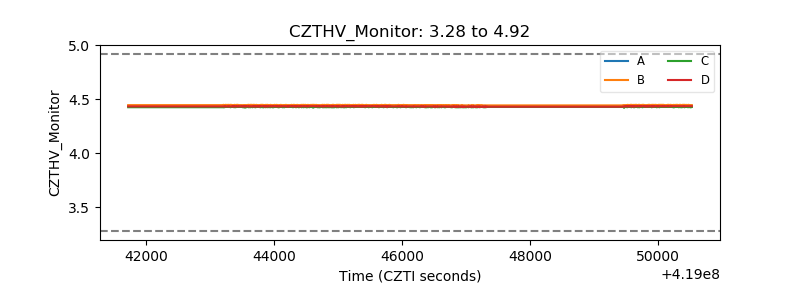 |
| D_VDD | 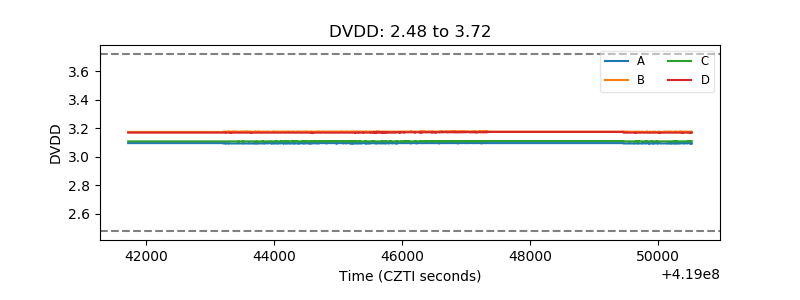 |
| Temperature 1 | 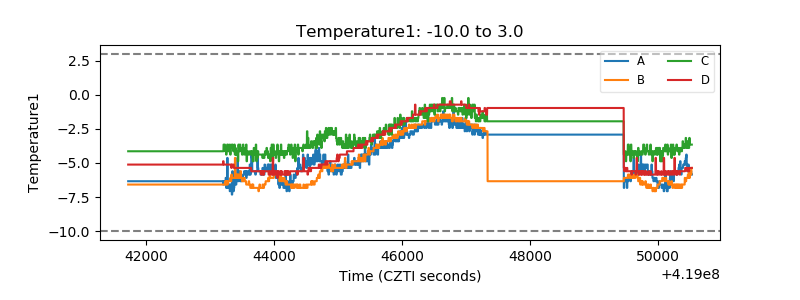 |
| Veto HV Monitor | 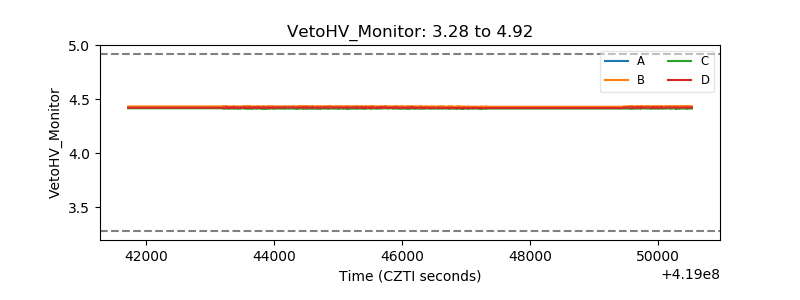 |
| Veto LLD | 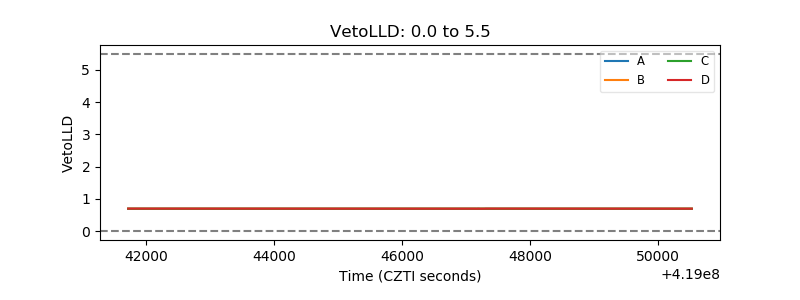 |
| Alpha Counter | 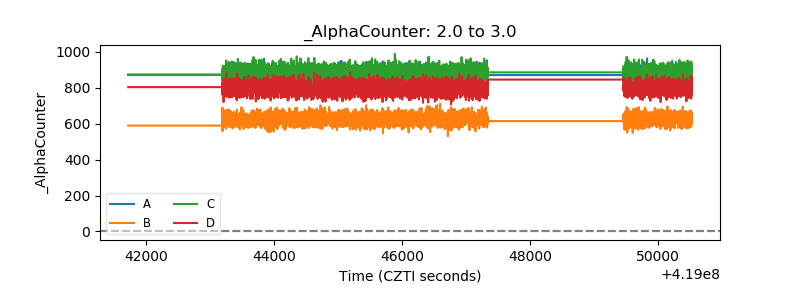 |
| _CPM_Rate | 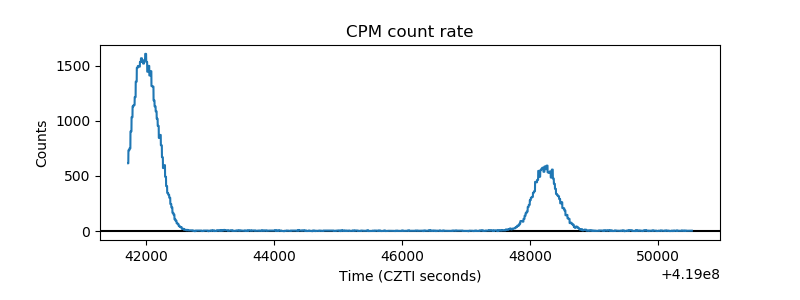 |
| CZT Counter | 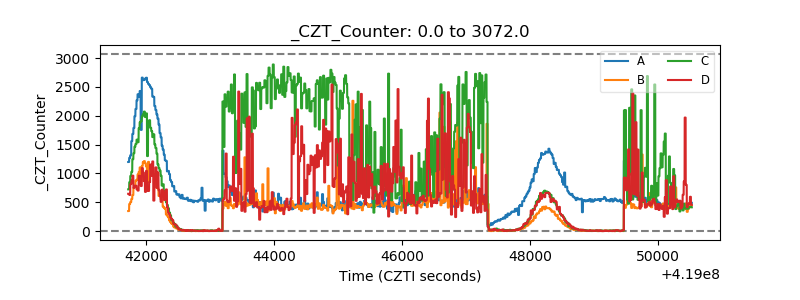 |
| +2.5 Volts monitor |  |
| +5 Volts monitor | 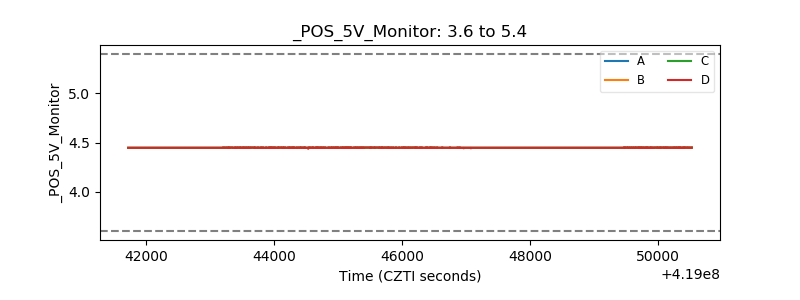 |
| _ROLL_ROT | 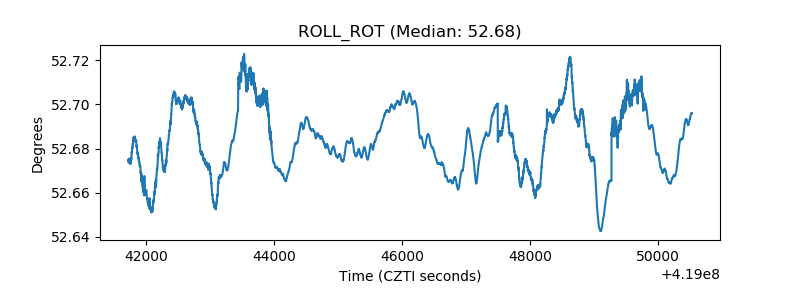 |
| _Roll_DEC | 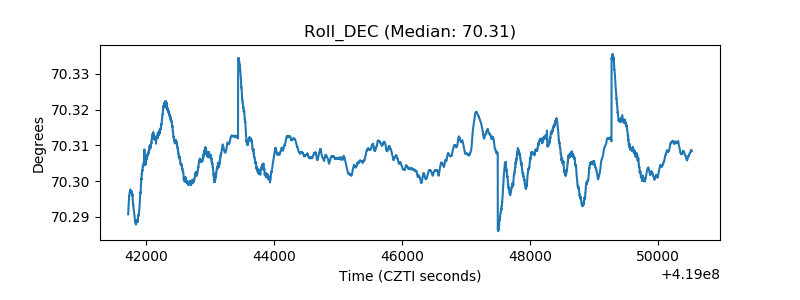 |
| _Roll_RA | 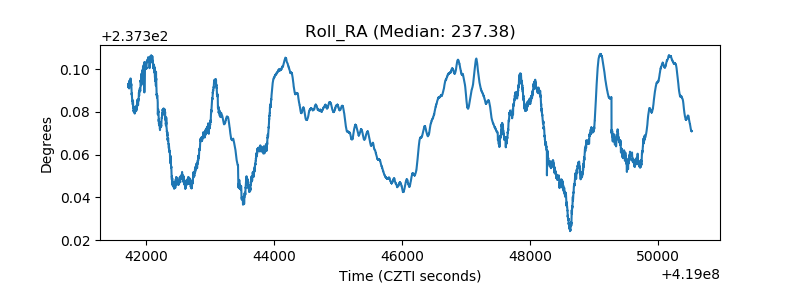 |
| Veto Counter | 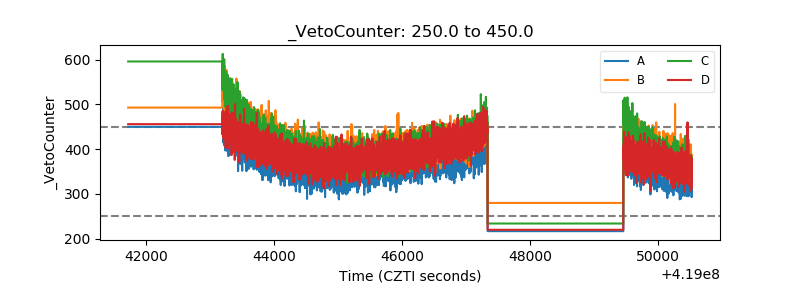 |