| Param | Original file | Final file |
|---|---|---|
| Filename | modeM0/AS1C07_001T10_9000005566_40767cztM0_level2.fits | modeM0/AS1C07_001T10_9000005566_40767cztM0_level2_quad_clean.evt |
| Size (bytes) | 353,926,080 | 84,669,120 |
| Size | 337.5 MB | 80.7 MB |
| Events in quadrant A | 2,888,586 | 578,955 |
| Events in quadrant B | 3,093,111 | 591,998 |
| Events in quadrant C | 3,087,381 | 573,325 |
| Events in quadrant D | 3,623,745 | 452,730 |
| Mode M9 | |||
|---|---|---|---|
| Quadrant | BADHDUFLAG | Total packets | Discarded packets |
| A | 0 | 23 | 0 |
| B | 0 | 23 | 0 |
| C | 0 | 23 | 0 |
| D | 0 | 24 | 0 |
| Mode M0 | |||
|---|---|---|---|
| Quadrant | BADHDUFLAG | Total packets | Discarded packets |
| A | 0 | 11784 | 3 |
| B | 0 | 12851 | 2 |
| C | 0 | 12637 | 2 |
| D | 0 | 14494 | 2 |
| Mode SS | |||
|---|---|---|---|
| Quadrant | BADHDUFLAG | Total packets | Discarded packets |
| A | 0 | 106 | 0 |
| B | 0 | 106 | 0 |
| C | 0 | 106 | 0 |
| D | 0 | 106 | 0 |
| Quadrant | Total seconds | Saturated seconds | Saturation percentage |
|---|---|---|---|
| A | 5237 | 37 | 0.706511% |
| B | 5237 | 206 | 3.933550% |
| C | 5237 | 110 | 2.100439% |
| D | 5237 | 835 | 15.944243% |
Noise dominated data is calculated using 1-second bins in cleaned event files. If a bin has >2000 counts, and if more than 50% of those come from <1% of pixels, then it is considered to be noise-dominated and hence unusable.
| Quadrant | # 1 sec bins | Bins with >0 counts | Bins with >2000 counts | High rate bins dominated by noise | Noise dominated (total time) | Noise dominated (detector-on time) | Marked lightcurve |
|---|---|---|---|---|---|---|---|
| A | 7269 | 5238 | 27 | 27 | 0.37% | 0.52% | 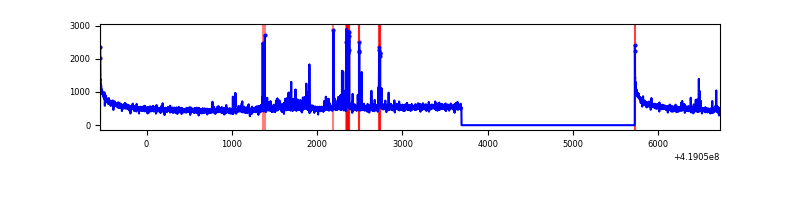 |
| B | 7269 | 5238 | 156 | 156 | 2.15% | 2.98% | 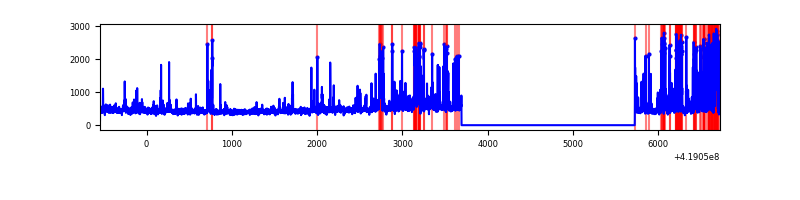 |
| C | 7269 | 5238 | 119 | 119 | 1.64% | 2.27% | 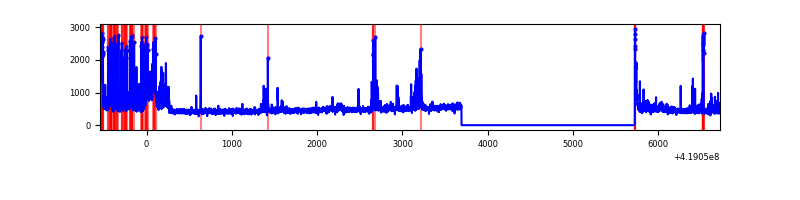 |
| D | 7269 | 5237 | 237 | 237 | 3.26% | 4.53% | 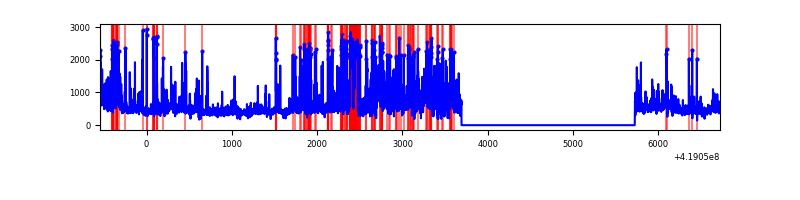 |
Top three noisy pixels from each quadrant. If the there are fewer than three noisy pixels in the level2.evt file, extra rows are filled as -1
| Pixel properties | Quadrant properties | ||||||
|---|---|---|---|---|---|---|---|
| Quadrant | DetID | PixID | Counts | Sigma | Mean | Median | Sigma |
| A | 10 | 83 | 495102 | 4309.2 | 560 | 549 | 114.8 |
| A | 6 | 10 | 136621 | 1185.64 | 560 | 549 | 114.8 |
| A | 13 | 248 | 59898 | 517.13 | 560 | 549 | 114.8 |
| B | 5 | 255 | 496008 | 4641.12 | 555 | 540 | 106.8 |
| B | 15 | 85 | 160138 | 1494.98 | 555 | 540 | 106.8 |
| B | 0 | 190 | 135236 | 1261.72 | 555 | 540 | 106.8 |
| C | 9 | 187 | 503349 | 3996.52 | 543 | 545 | 125.8 |
| C | 15 | 214 | 225126 | 1785.08 | 543 | 545 | 125.8 |
| C | 14 | 254 | 166162 | 1316.4 | 543 | 545 | 125.8 |
| D | 12 | 227 | 784406 | 6481.14 | 497 | 481 | 121.0 |
| D | 2 | 249 | 306283 | 2528.23 | 497 | 481 | 121.0 |
| D | 12 | 191 | 151821 | 1251.21 | 497 | 481 | 121.0 |
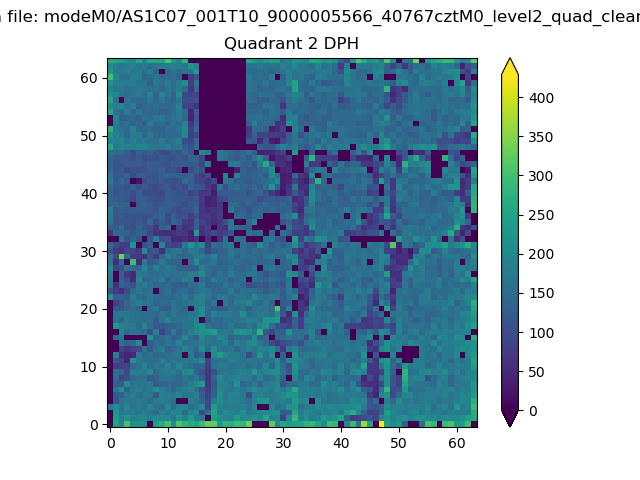
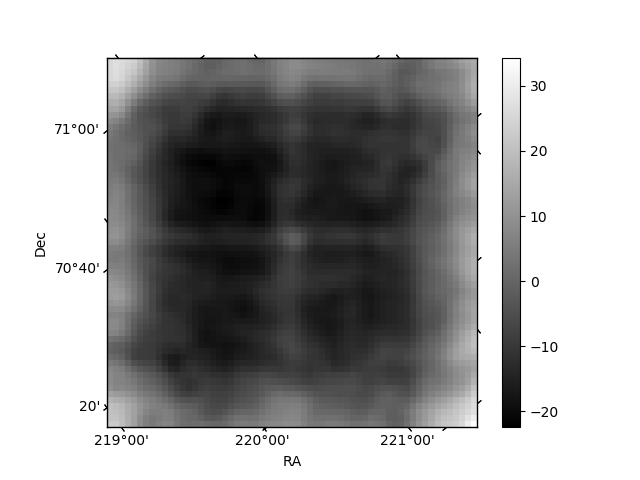
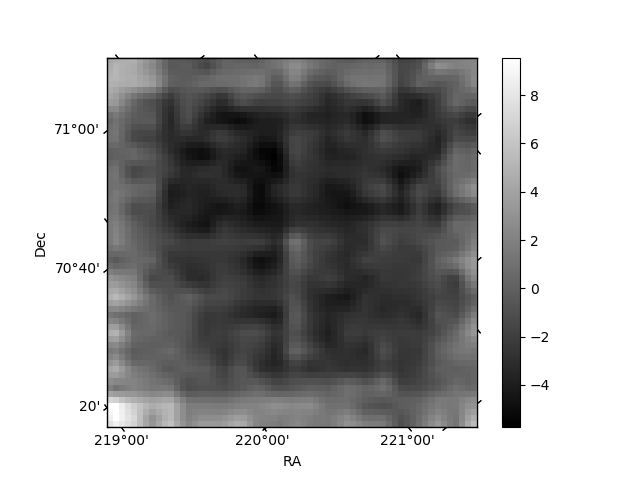
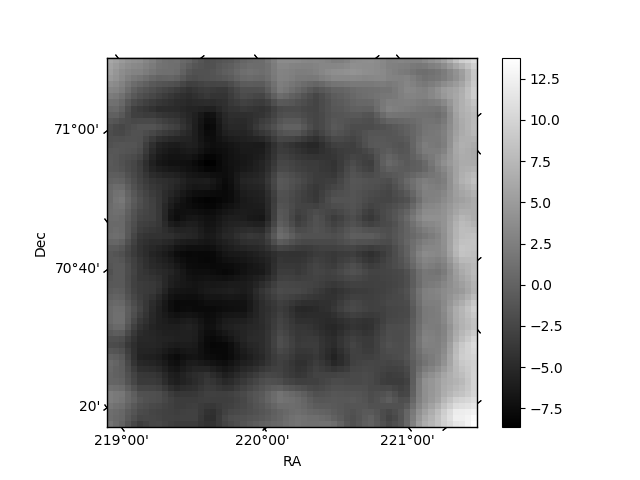
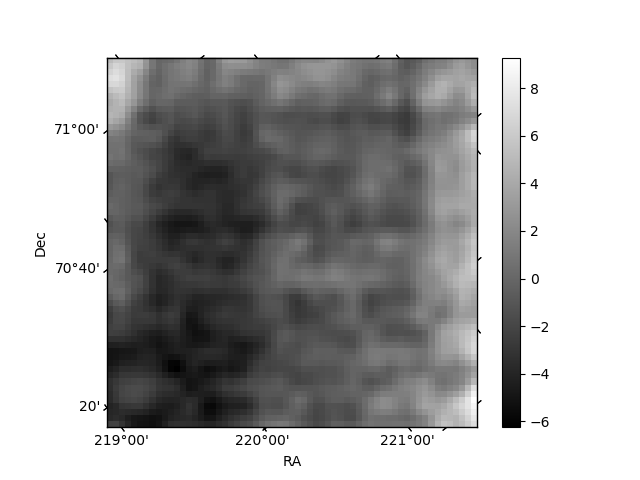
Histogram calculated using DETX and DETY for each event in the final _common_clean file
| Quadrant A | 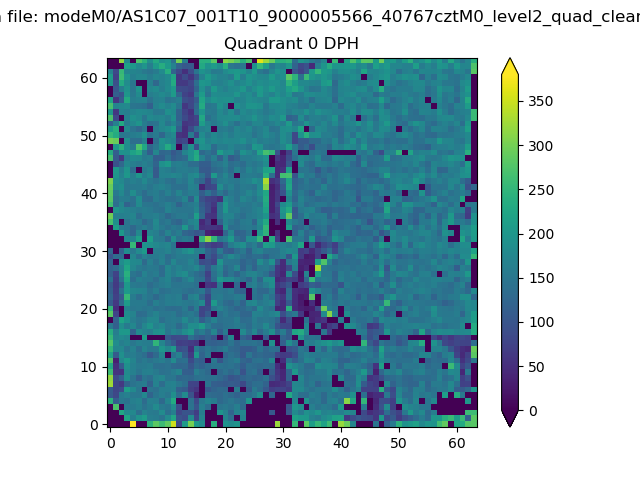 |
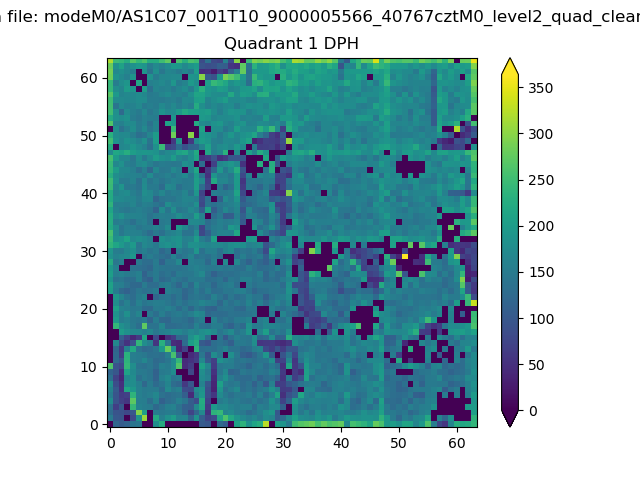 |
Quadrant B |
|---|---|---|---|
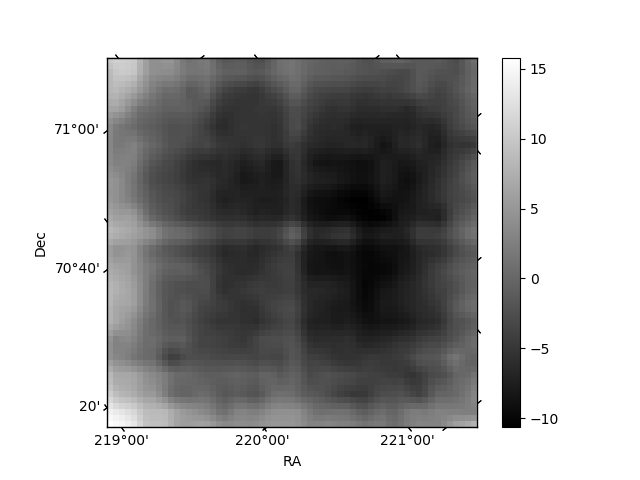
| Quadrant D | 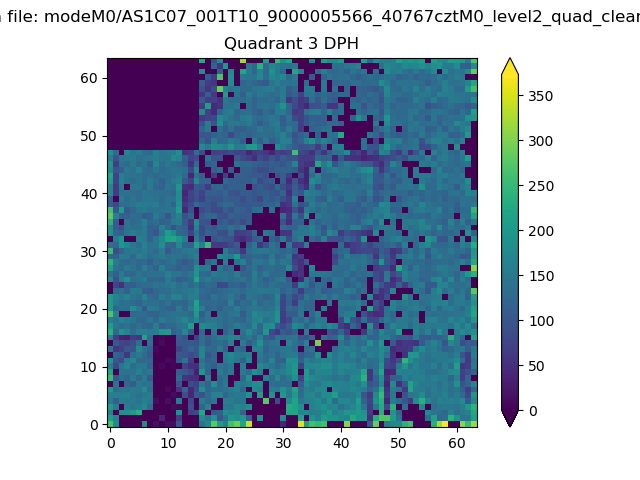 |
 |
Quadrant C |
| Plot type | Count rate plots | Images |
|---|---|---|
| Comparison with Poisson distribution Blue bars denote a histogram of data divided into 1 sec bins. Red curve is a Poisson curve with rate = median count rate of data. |
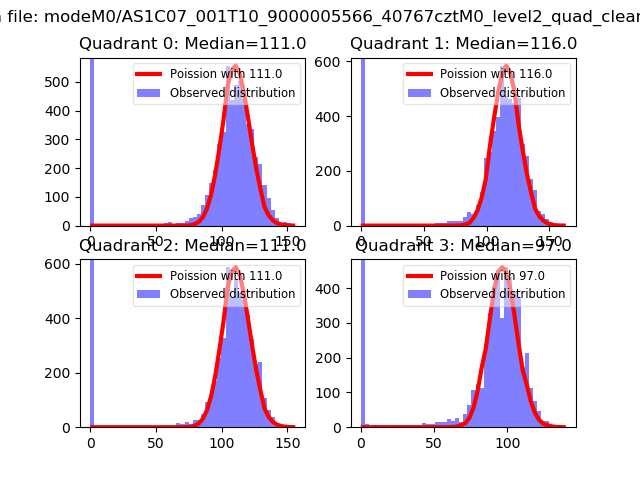 |
 |
| Quadrant-wise count rates Data is divided into 100 sec bins |
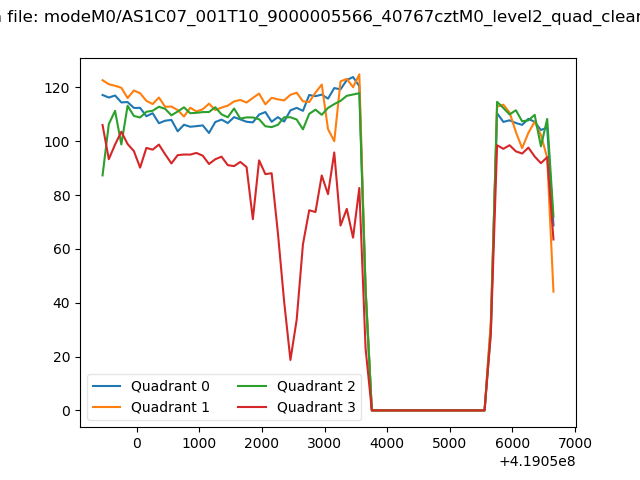 |
|
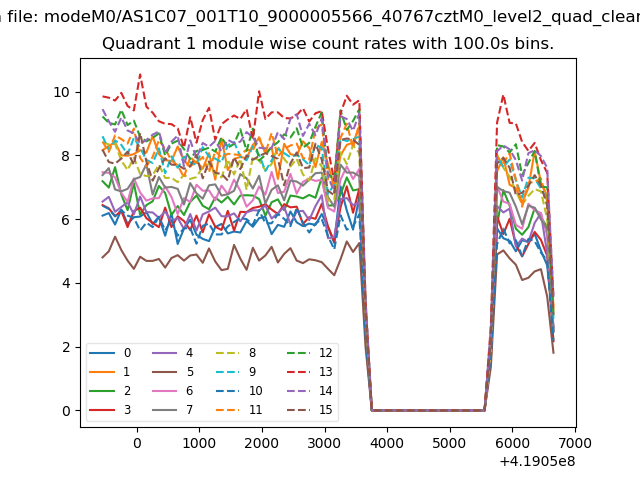
| Module-wise count rates for Quadrant A Data is divided into 100 sec bins |
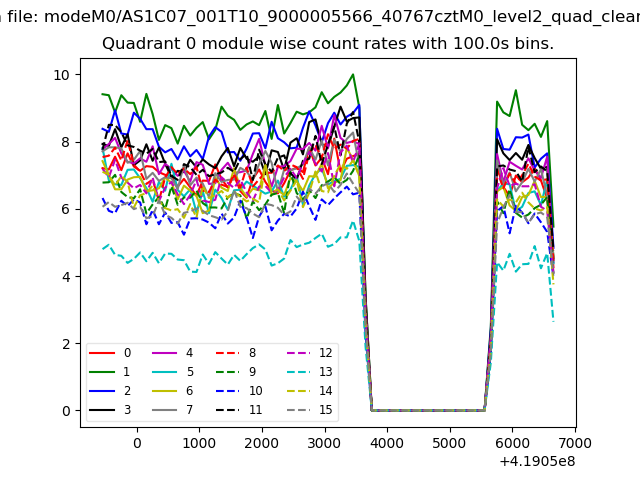 |
 |
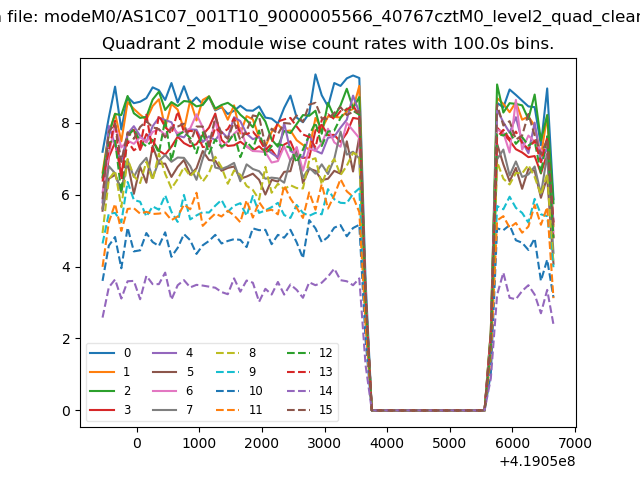
| Module-wise count rates for Quadrant B Data is divided into 100 sec bins |
 |
 |
| Module-wise count rates for Quadrant C Data is divided into 100 sec bins |
 |
 |
| Module-wise count rates for Quadrant D Data is divided into 100 sec bins |
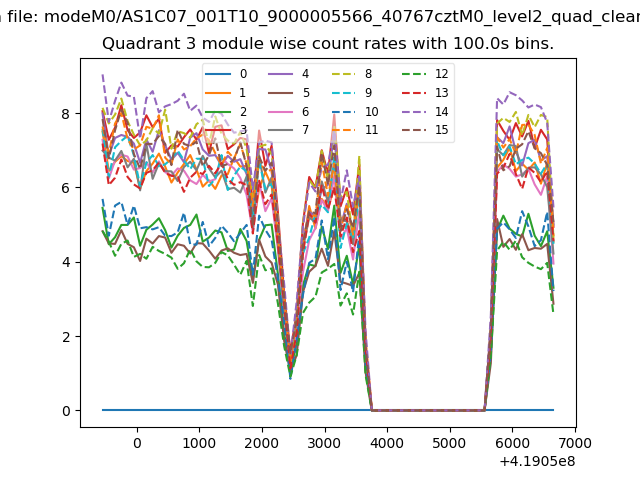 |
 |
| Parameter | Plot |
|---|---|
| CZT HV Monitor | 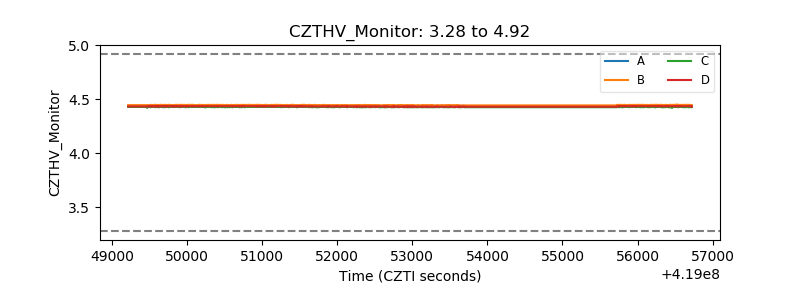 |
| D_VDD |  |
| Temperature 1 | 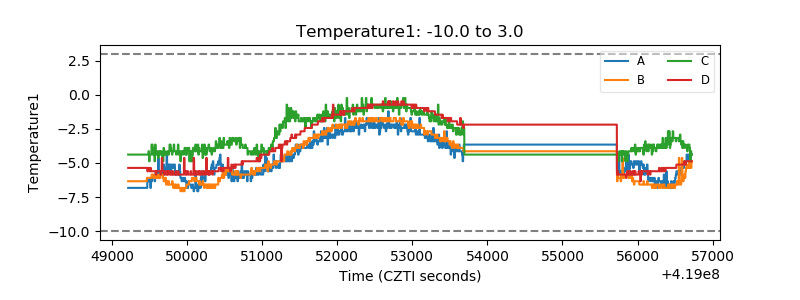 |
| Veto HV Monitor | 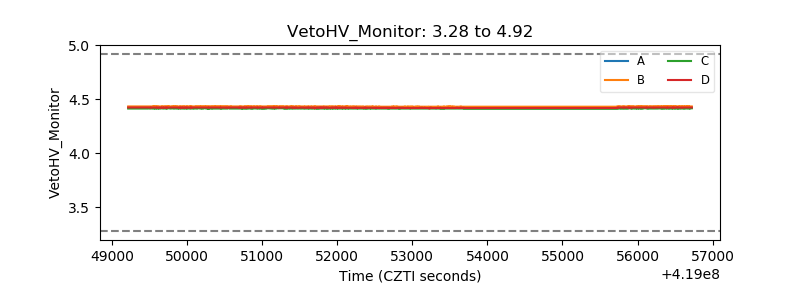 |
| Veto LLD | 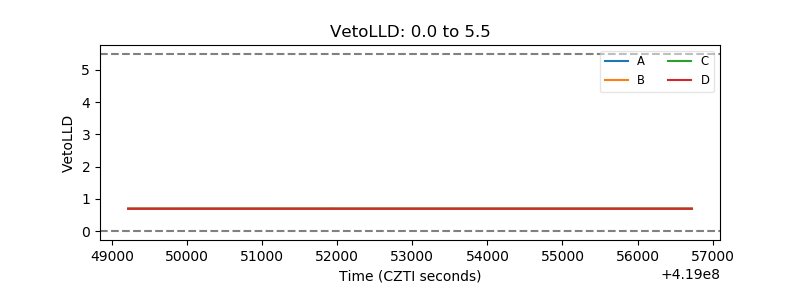 |
| Alpha Counter | 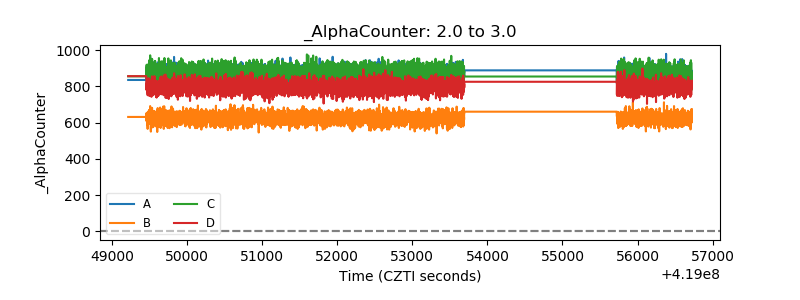 |
| _CPM_Rate | 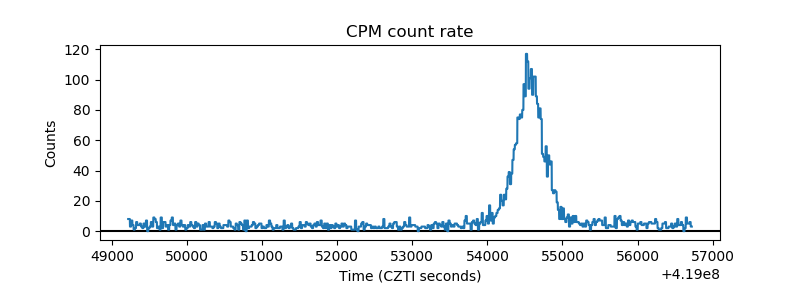 |
| CZT Counter | 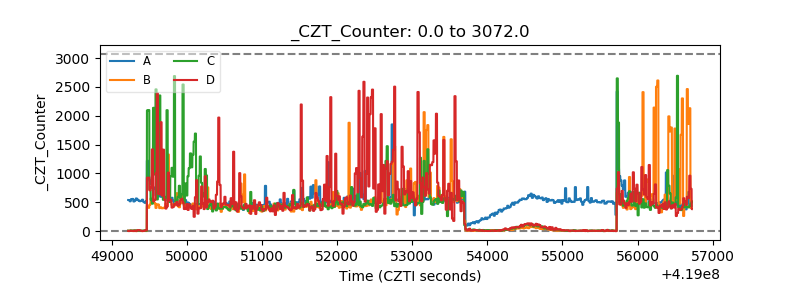 |
| +2.5 Volts monitor | 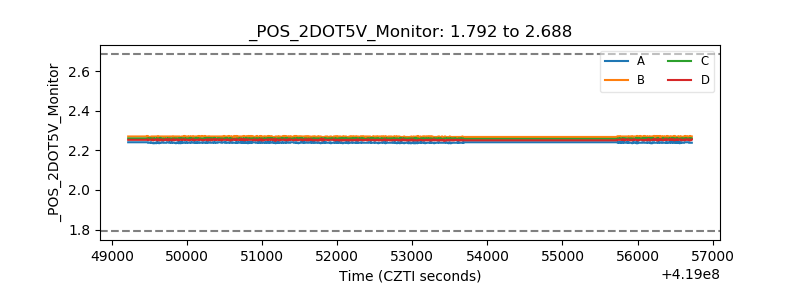 |
| +5 Volts monitor | 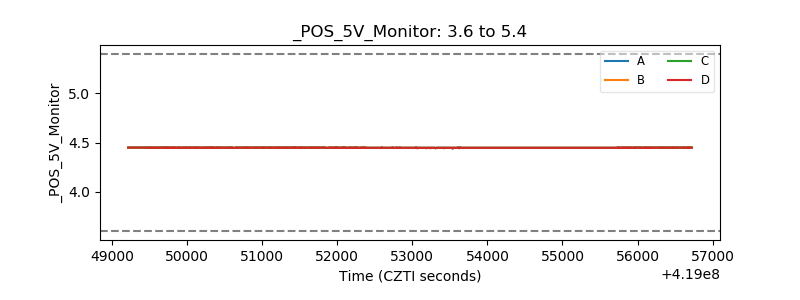 |
| _ROLL_ROT | 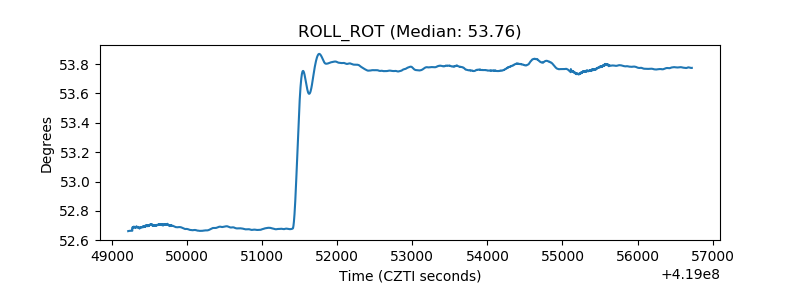 |
| _Roll_DEC | 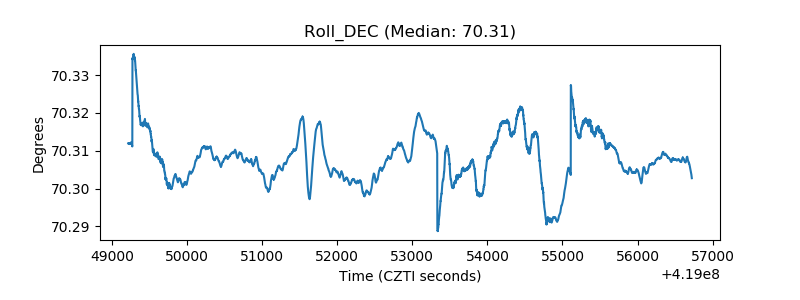 |
| _Roll_RA | 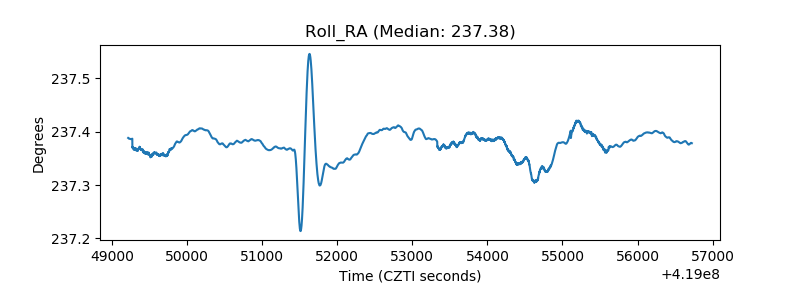 |
| Veto Counter | 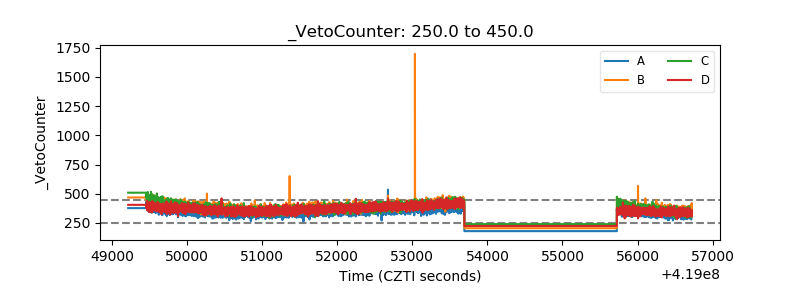 |