| Param | Original file | Final file |
|---|---|---|
| Filename | modeM0/AS1C07_001T10_9000005566_40768cztM0_level2.fits | modeM0/AS1C07_001T10_9000005566_40768cztM0_level2_quad_clean.evt |
| Size (bytes) | 329,117,760 | 81,912,960 |
| Size | 313.9 MB | 78.1 MB |
| Events in quadrant A | 2,667,926 | 566,150 |
| Events in quadrant B | 3,142,249 | 573,903 |
| Events in quadrant C | 2,513,985 | 562,100 |
| Events in quadrant D | 3,452,267 | 413,632 |
| Mode M9 | |||
|---|---|---|---|
| Quadrant | BADHDUFLAG | Total packets | Discarded packets |
| A | 0 | 17 | 0 |
| B | 0 | 17 | 0 |
| C | 0 | 17 | 0 |
| D | 0 | 17 | 0 |
| Mode M0 | |||
|---|---|---|---|
| Quadrant | BADHDUFLAG | Total packets | Discarded packets |
| A | 0 | 10919 | 2 |
| B | 0 | 12848 | 1 |
| C | 0 | 10837 | 1 |
| D | 0 | 13976 | 1 |
| Mode SS | |||
|---|---|---|---|
| Quadrant | BADHDUFLAG | Total packets | Discarded packets |
| A | 0 | 106 | 0 |
| B | 0 | 106 | 0 |
| C | 0 | 106 | 0 |
| D | 0 | 106 | 0 |
| Quadrant | Total seconds | Saturated seconds | Saturation percentage |
|---|---|---|---|
| A | 5201 | 4 | 0.076908% |
| B | 5201 | 209 | 4.018458% |
| C | 5201 | 21 | 0.403769% |
| D | 5201 | 1136 | 21.841953% |
Noise dominated data is calculated using 1-second bins in cleaned event files. If a bin has >2000 counts, and if more than 50% of those come from <1% of pixels, then it is considered to be noise-dominated and hence unusable.
| Quadrant | # 1 sec bins | Bins with >0 counts | Bins with >2000 counts | High rate bins dominated by noise | Noise dominated (total time) | Noise dominated (detector-on time) | Marked lightcurve |
|---|---|---|---|---|---|---|---|
| A | 6904 | 5202 | 2 | 2 | 0.03% | 0.04% | 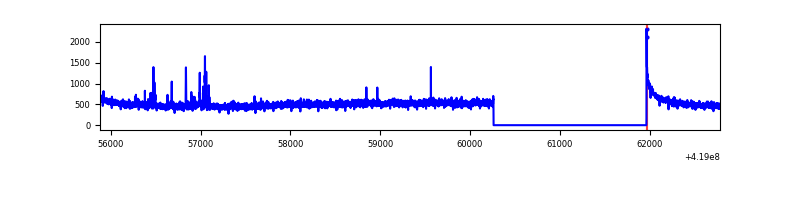 |
| B | 6904 | 5202 | 166 | 166 | 2.40% | 3.19% | 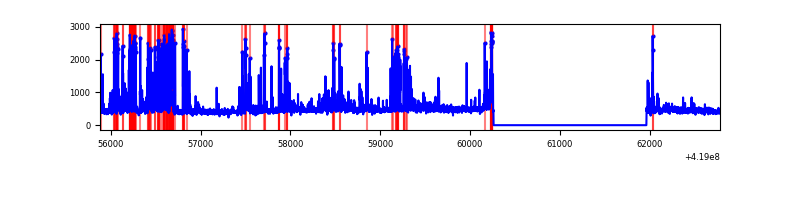 |
| C | 6904 | 5202 | 18 | 18 | 0.26% | 0.35% | 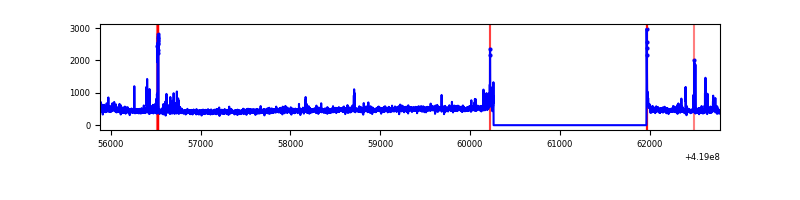 |
| D | 6904 | 5202 | 161 | 161 | 2.33% | 3.09% | 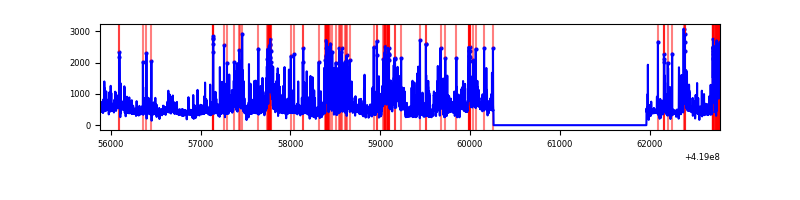 |
Top three noisy pixels from each quadrant. If the there are fewer than three noisy pixels in the level2.evt file, extra rows are filled as -1
| Pixel properties | Quadrant properties | ||||||
|---|---|---|---|---|---|---|---|
| Quadrant | DetID | PixID | Counts | Sigma | Mean | Median | Sigma |
| A | 10 | 83 | 454842 | 3930.64 | 559 | 547 | 115.6 |
| A | 13 | 248 | 46192 | 394.93 | 559 | 547 | 115.6 |
| A | 13 | 254 | 7564 | 60.71 | 559 | 547 | 115.6 |
| B | 5 | 255 | 657596 | 6152.35 | 551 | 536 | 106.8 |
| B | 0 | 190 | 130916 | 1220.81 | 551 | 536 | 106.8 |
| B | 15 | 85 | 72857 | 677.17 | 551 | 536 | 106.8 |
| C | 15 | 214 | 221593 | 1750.35 | 545 | 548 | 126.3 |
| C | 14 | 254 | 67657 | 531.41 | 545 | 548 | 126.3 |
| C | 9 | 187 | 45471 | 355.72 | 545 | 548 | 126.3 |
| D | 12 | 227 | 640481 | 5411.72 | 477 | 464 | 118.3 |
| D | 12 | 191 | 208342 | 1757.73 | 477 | 464 | 118.3 |
| D | 2 | 249 | 190545 | 1607.25 | 477 | 464 | 118.3 |
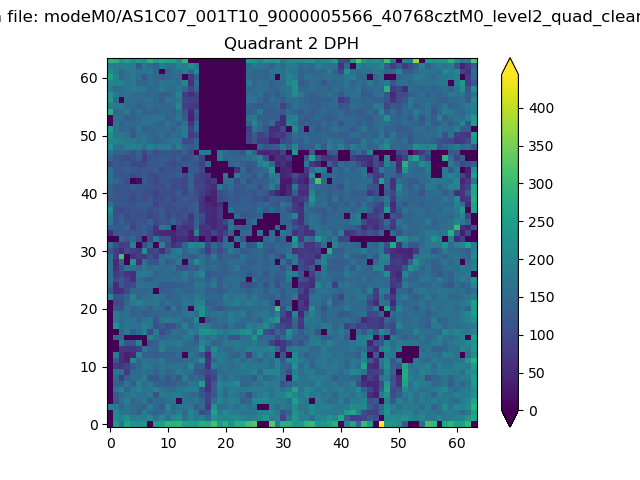
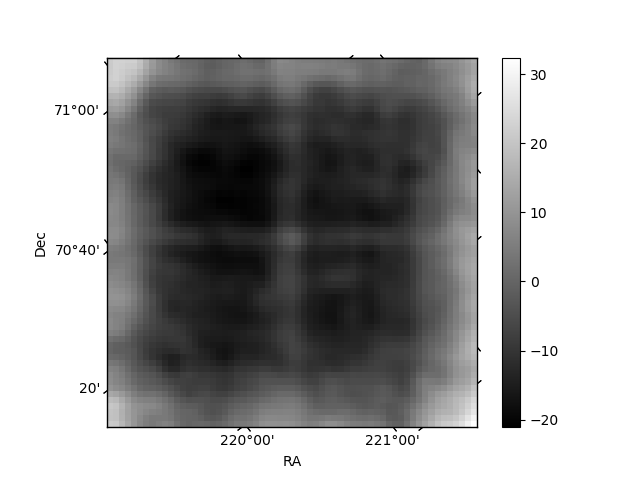
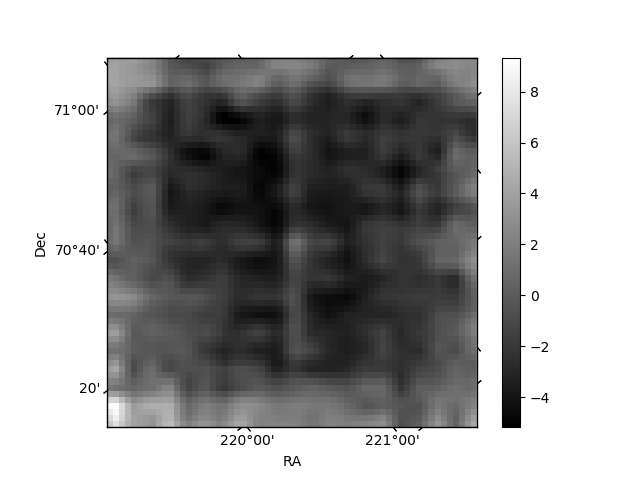
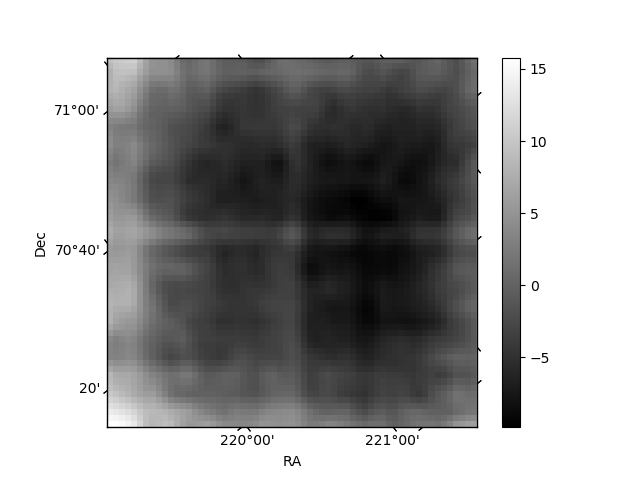
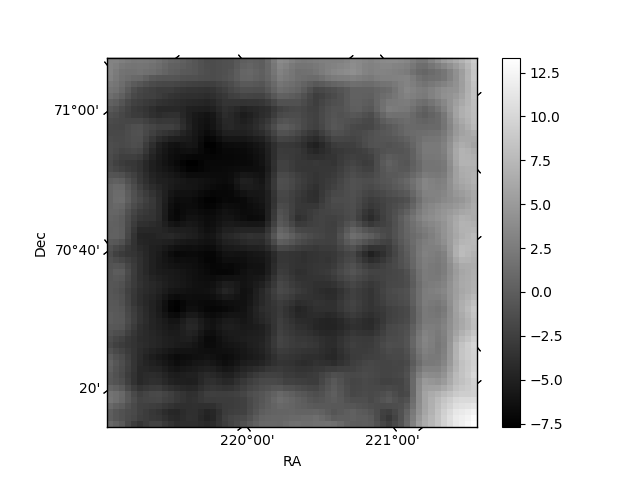
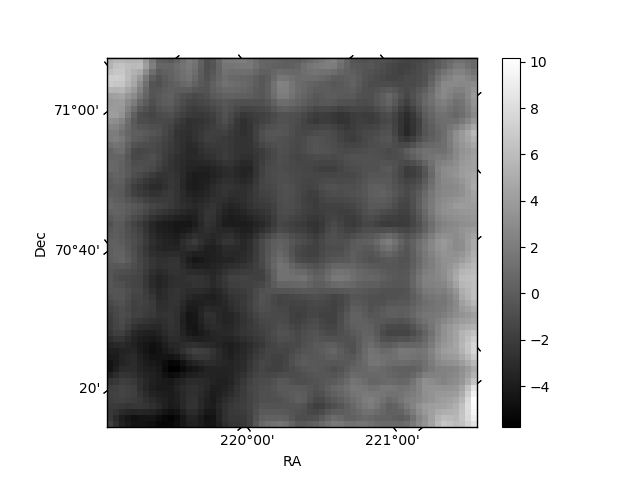
Histogram calculated using DETX and DETY for each event in the final _common_clean file
| Quadrant A | 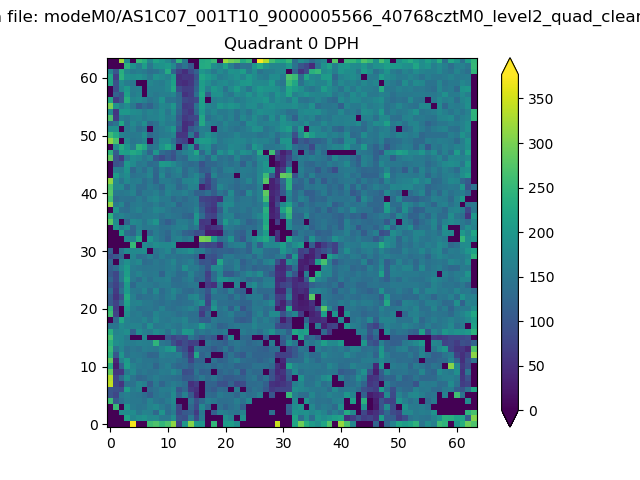 |
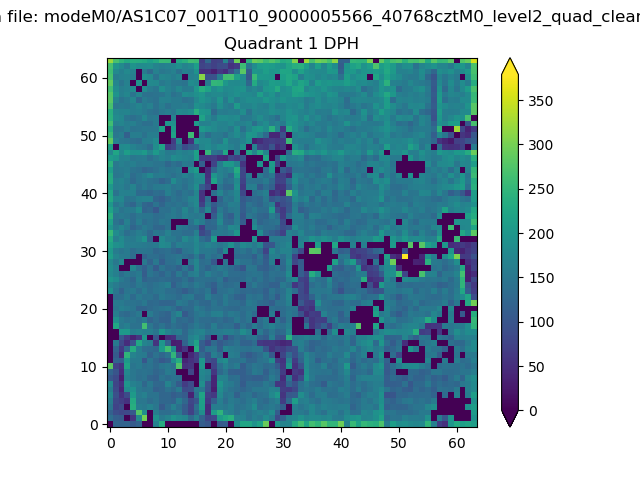 |
Quadrant B |
|---|---|---|---|
| Quadrant D | 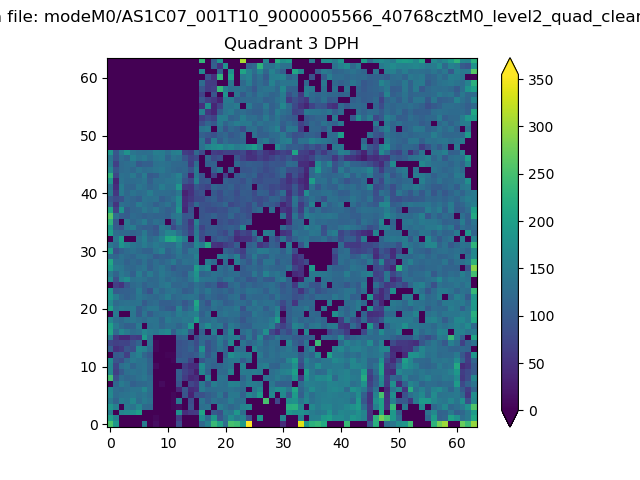 |
 |
Quadrant C |
| Plot type | Count rate plots | Images |
|---|---|---|
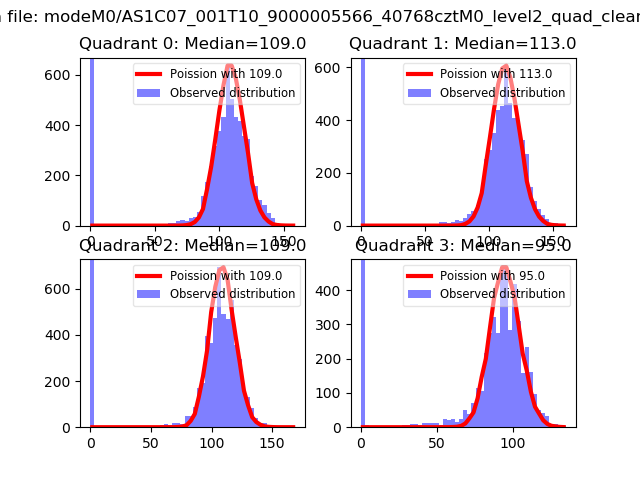
| Comparison with Poisson distribution Blue bars denote a histogram of data divided into 1 sec bins. Red curve is a Poisson curve with rate = median count rate of data. |
 |
 |
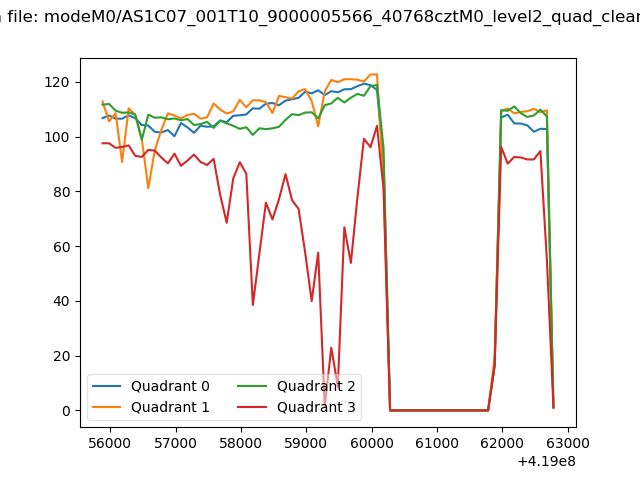
| Quadrant-wise count rates Data is divided into 100 sec bins |
 |
|
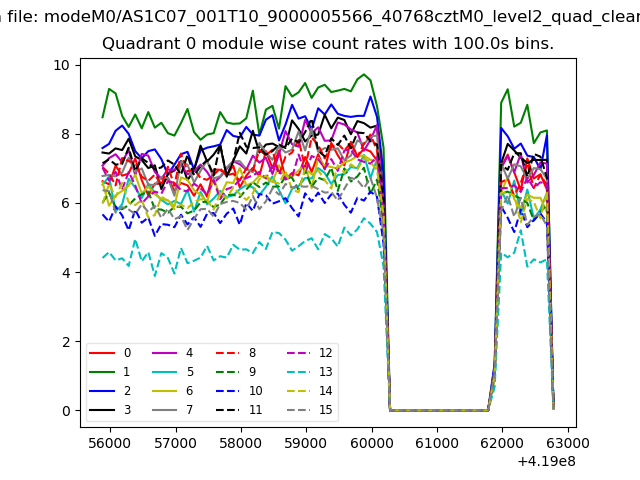
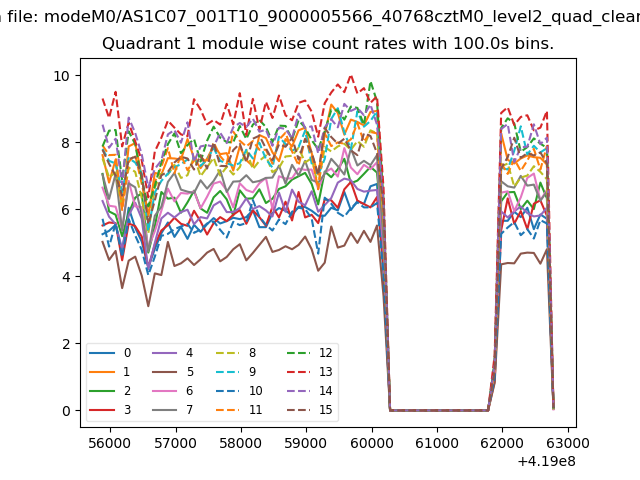
| Module-wise count rates for Quadrant A Data is divided into 100 sec bins |
 |
 |
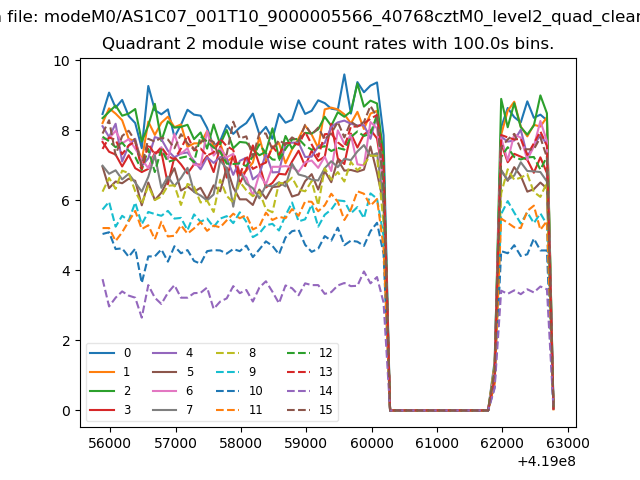
| Module-wise count rates for Quadrant B Data is divided into 100 sec bins |
 |
 |
| Module-wise count rates for Quadrant C Data is divided into 100 sec bins |
 |
 |
| Module-wise count rates for Quadrant D Data is divided into 100 sec bins |
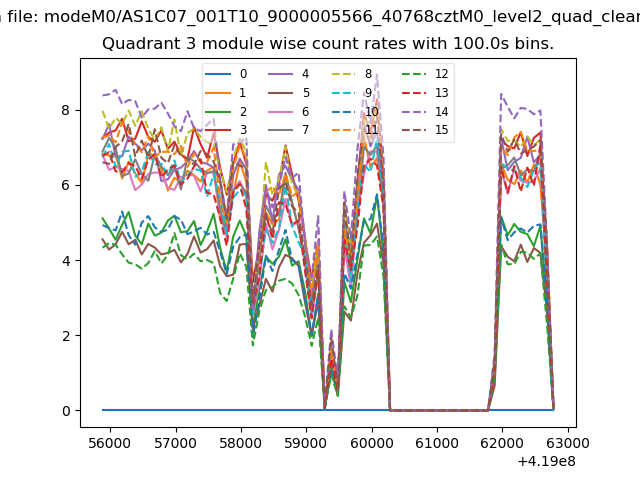 |
 |
| Parameter | Plot |
|---|---|
| CZT HV Monitor | 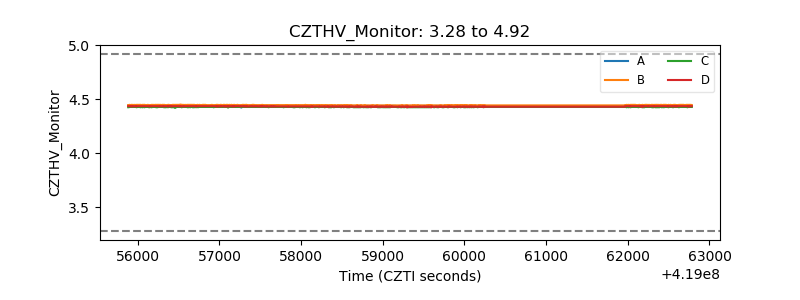 |
| D_VDD | 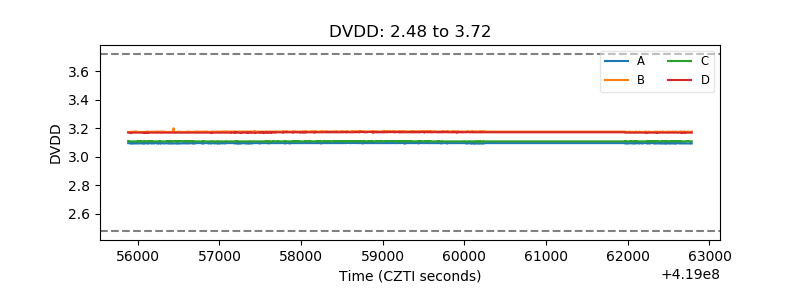 |
| Temperature 1 | 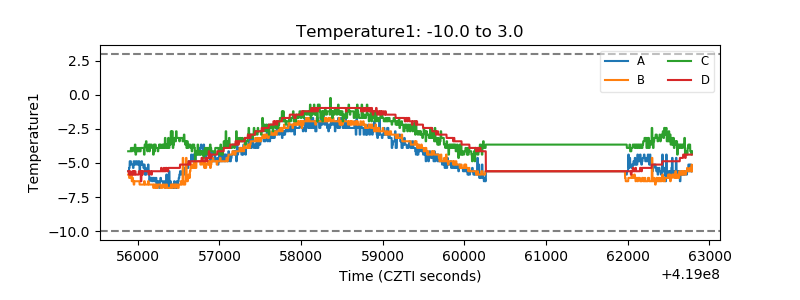 |
| Veto HV Monitor | 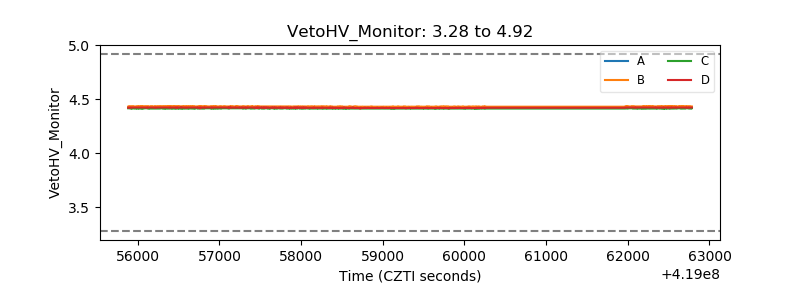 |
| Veto LLD | 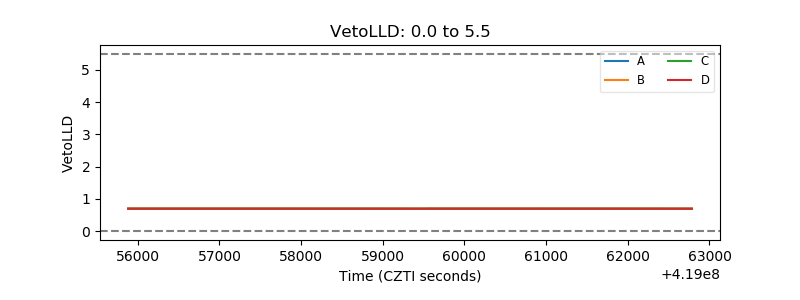 |
| Alpha Counter | 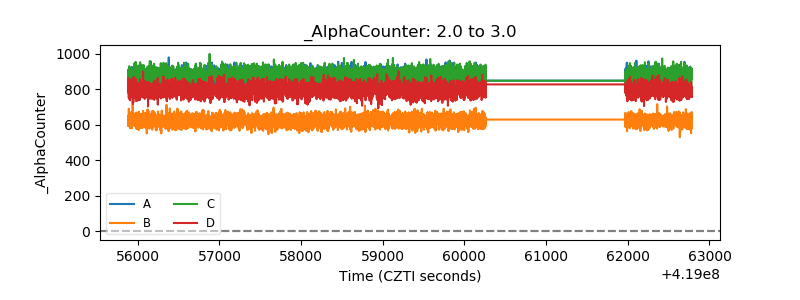 |
| _CPM_Rate | 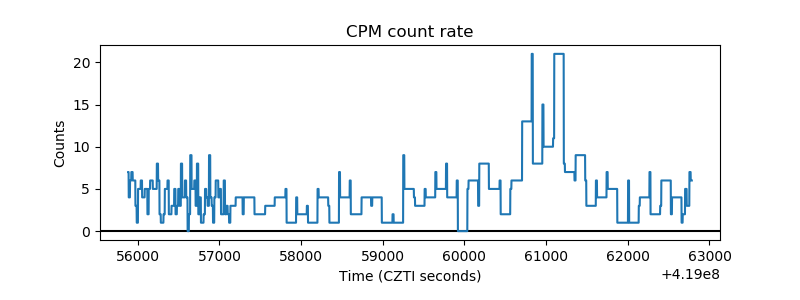 |
| CZT Counter | 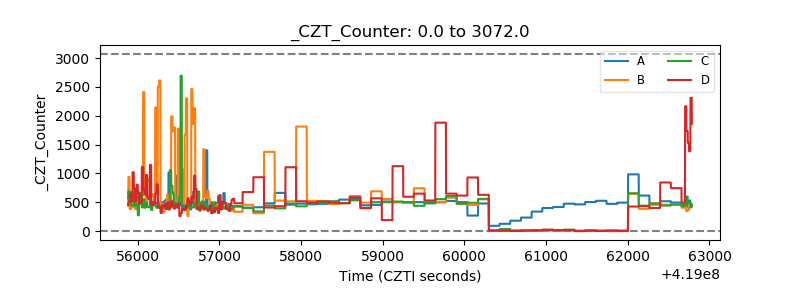 |
| +2.5 Volts monitor | 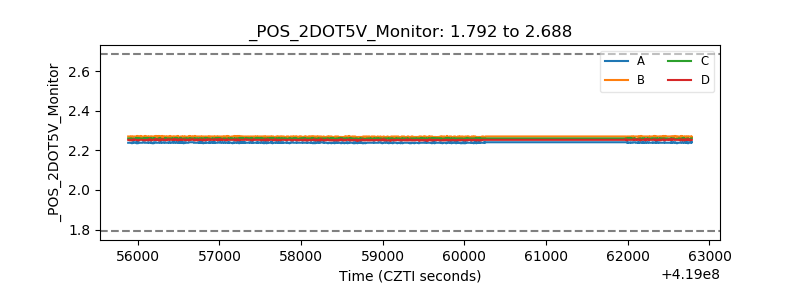 |
| +5 Volts monitor | 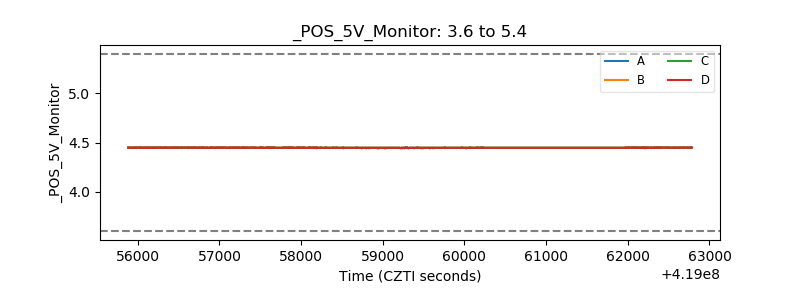 |
| _ROLL_ROT | 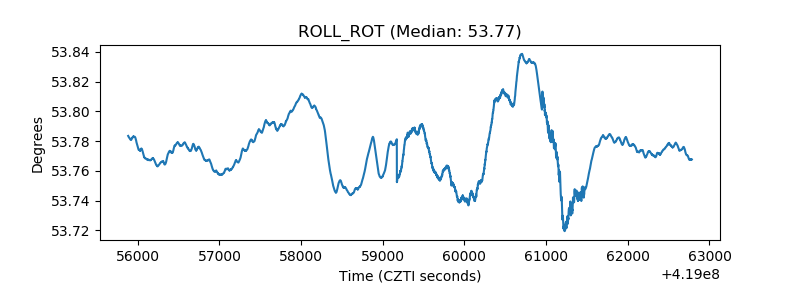 |
| _Roll_DEC | 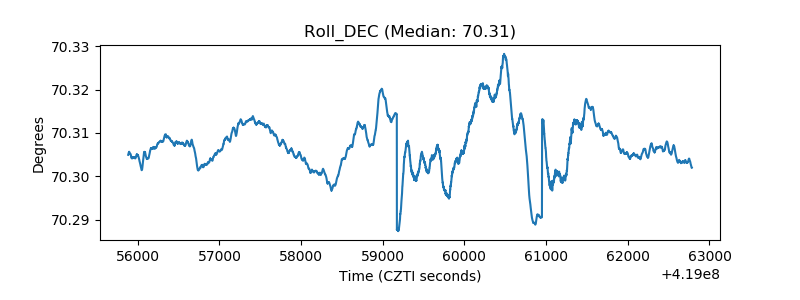 |
| _Roll_RA | 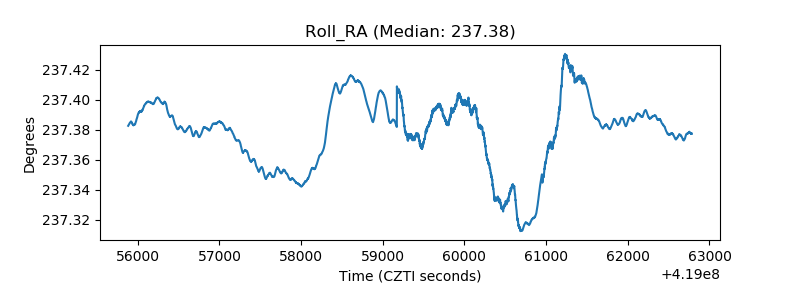 |
| Veto Counter | 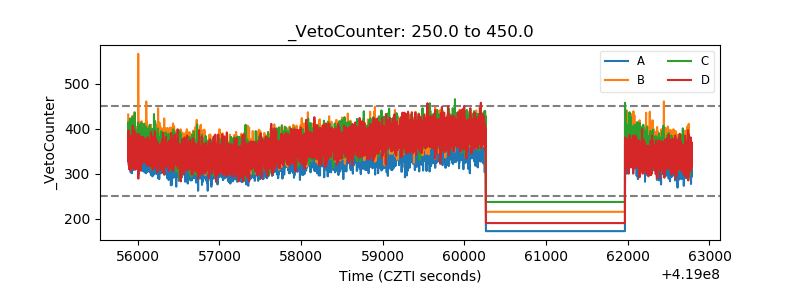 |