| Param | Original file | Final file |
|---|---|---|
| Filename | modeM0/AS1C07_001T10_9000005566_40769cztM0_level2.fits | modeM0/AS1C07_001T10_9000005566_40769cztM0_level2_quad_clean.evt |
| Size (bytes) | 429,759,360 | 87,736,320 |
| Size | 409.9 MB | 83.7 MB |
| Events in quadrant A | 2,971,165 | 614,218 |
| Events in quadrant B | 2,750,007 | 636,246 |
| Events in quadrant C | 5,400,174 | 560,823 |
| Events in quadrant D | 4,343,002 | 446,465 |
| Mode M9 | |||
|---|---|---|---|
| Quadrant | BADHDUFLAG | Total packets | Discarded packets |
| A | 0 | 23 | 0 |
| B | 0 | 23 | 0 |
| C | 0 | 23 | 0 |
| D | 0 | 24 | 0 |
| Mode M0 | |||
|---|---|---|---|
| Quadrant | BADHDUFLAG | Total packets | Discarded packets |
| A | 0 | 12163 | 3 |
| B | 0 | 12121 | 2 |
| C | 0 | 19861 | 2 |
| D | 0 | 16834 | 2 |
| Mode SS | |||
|---|---|---|---|
| Quadrant | BADHDUFLAG | Total packets | Discarded packets |
| A | 0 | 116 | 0 |
| B | 0 | 116 | 0 |
| C | 0 | 116 | 0 |
| D | 0 | 116 | 0 |
| Quadrant | Total seconds | Saturated seconds | Saturation percentage |
|---|---|---|---|
| A | 5698 | 8 | 0.140400% |
| B | 5698 | 41 | 0.719551% |
| C | 5698 | 608 | 10.670411% |
| D | 5698 | 1314 | 23.060723% |
Noise dominated data is calculated using 1-second bins in cleaned event files. If a bin has >2000 counts, and if more than 50% of those come from <1% of pixels, then it is considered to be noise-dominated and hence unusable.
| Quadrant | # 1 sec bins | Bins with >0 counts | Bins with >2000 counts | High rate bins dominated by noise | Noise dominated (total time) | Noise dominated (detector-on time) | Marked lightcurve |
|---|---|---|---|---|---|---|---|
| A | 7101 | 5699 | 4 | 4 | 0.06% | 0.07% | 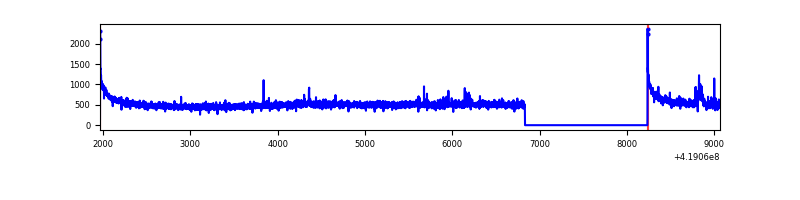 |
| B | 7101 | 5699 | 22 | 22 | 0.31% | 0.39% | 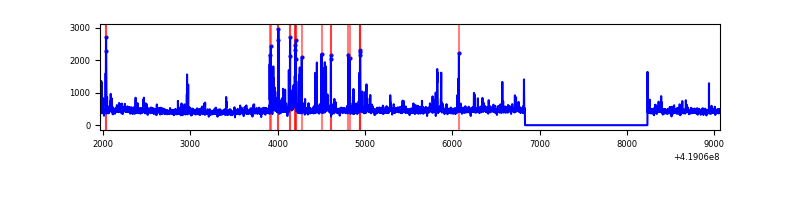 |
| C | 7101 | 5699 | 676 | 676 | 9.52% | 11.86% | 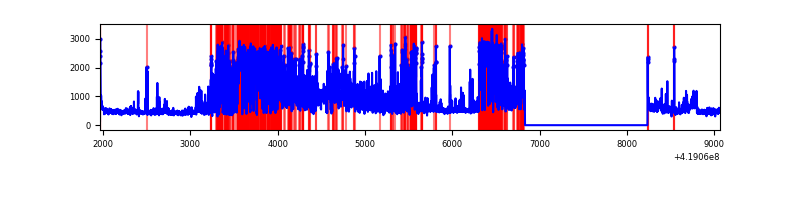 |
| D | 7101 | 5699 | 377 | 377 | 5.31% | 6.62% | 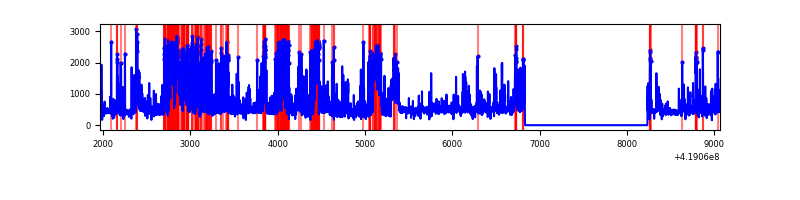 |
Top three noisy pixels from each quadrant. If the there are fewer than three noisy pixels in the level2.evt file, extra rows are filled as -1
| Pixel properties | Quadrant properties | ||||||
|---|---|---|---|---|---|---|---|
| Quadrant | DetID | PixID | Counts | Sigma | Mean | Median | Sigma |
| A | 10 | 83 | 527146 | 4127.66 | 614 | 600 | 127.6 |
| A | 12 | 189 | 54154 | 419.82 | 614 | 600 | 127.6 |
| A | 13 | 248 | 8798 | 64.27 | 614 | 600 | 127.6 |
| B | 5 | 255 | 141447 | 1182.45 | 614 | 598 | 119.1 |
| B | 0 | 190 | 80876 | 673.94 | 614 | 598 | 119.1 |
| B | 15 | 85 | 33697 | 277.87 | 614 | 598 | 119.1 |
| C | 9 | 187 | 2677739 | 20112.49 | 576 | 578 | 133.1 |
| C | 15 | 214 | 235858 | 1767.57 | 576 | 578 | 133.1 |
| C | 14 | 254 | 194093 | 1453.8 | 576 | 578 | 133.1 |
| D | 12 | 227 | 1062921 | 8110.84 | 531 | 517 | 131.0 |
| D | 1 | 47 | 613461 | 4679.47 | 531 | 517 | 131.0 |
| D | 12 | 191 | 204679 | 1558.66 | 531 | 517 | 131.0 |
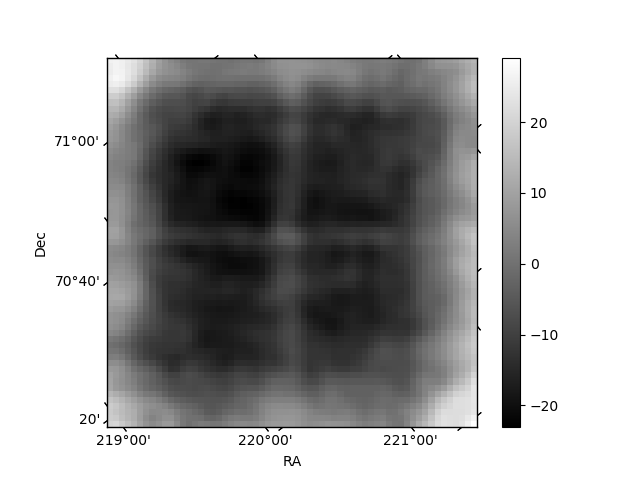
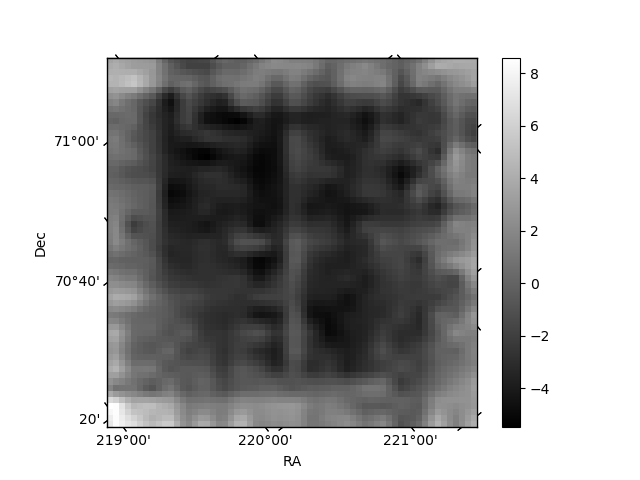
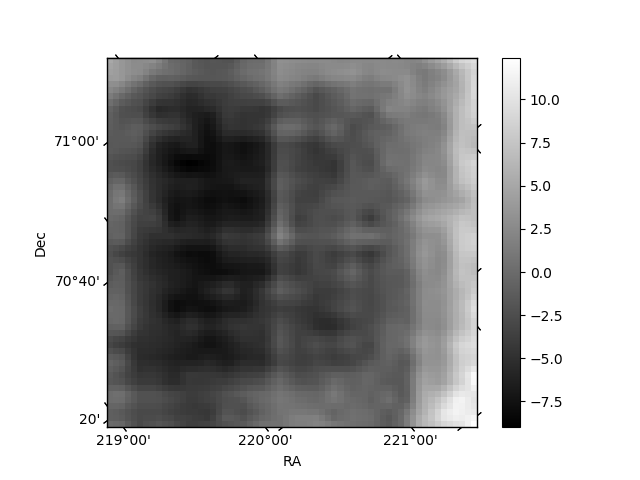
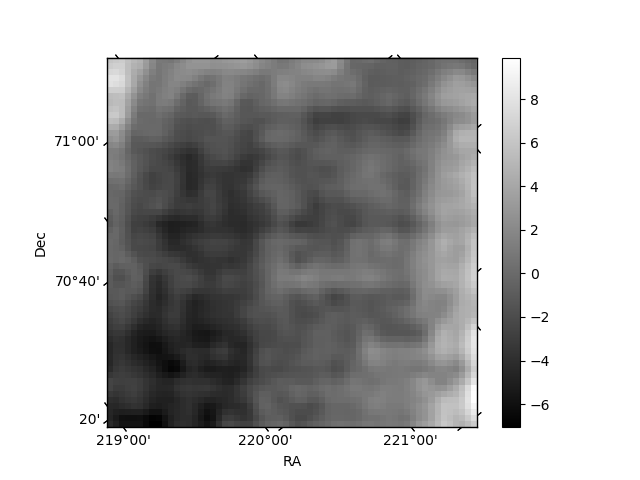
Histogram calculated using DETX and DETY for each event in the final _common_clean file
| Quadrant A | 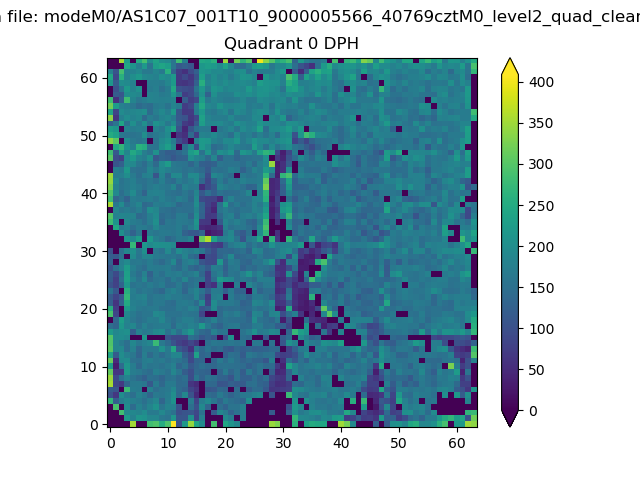 |
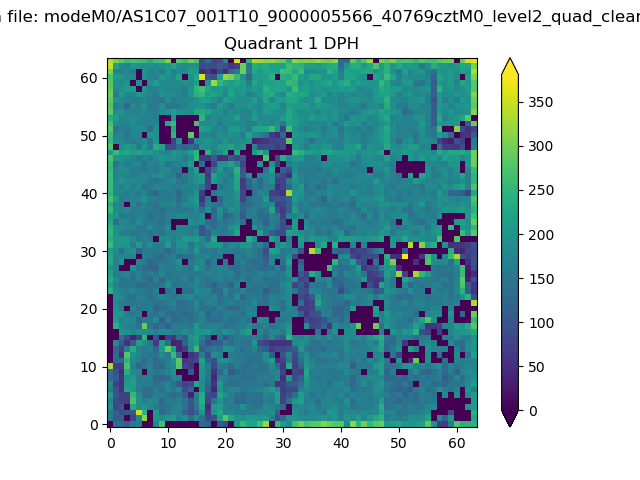 |
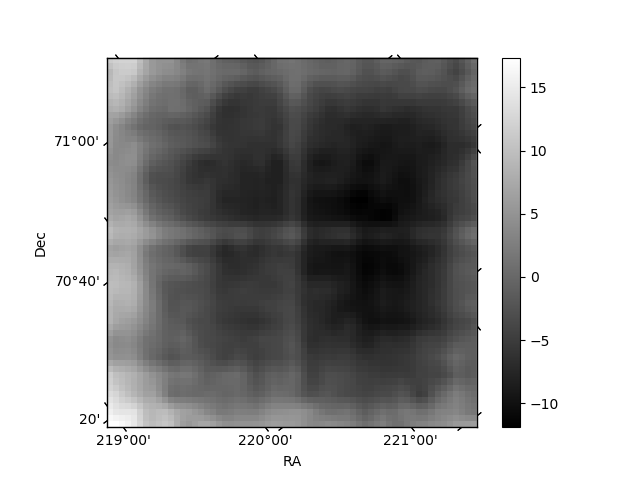
Quadrant B |
|---|---|---|---|
| Quadrant D | 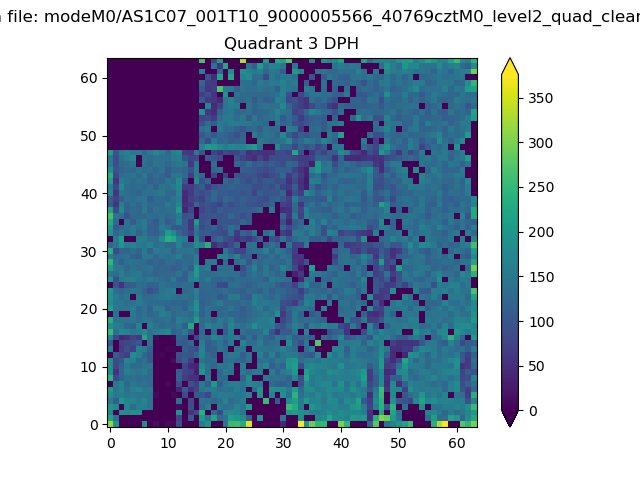 |
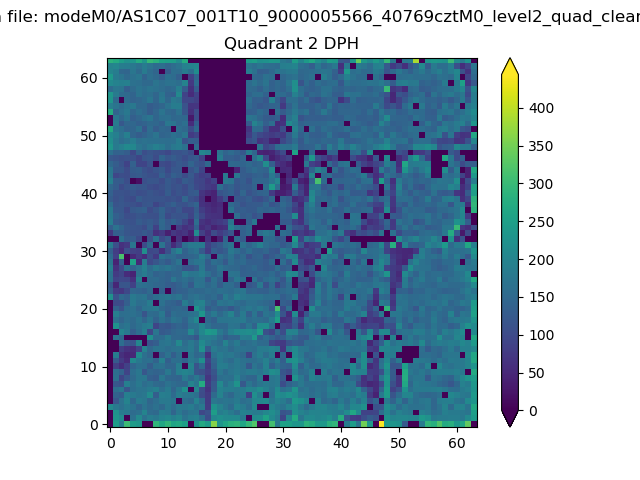 |
Quadrant C |
| Plot type | Count rate plots | Images |
|---|---|---|
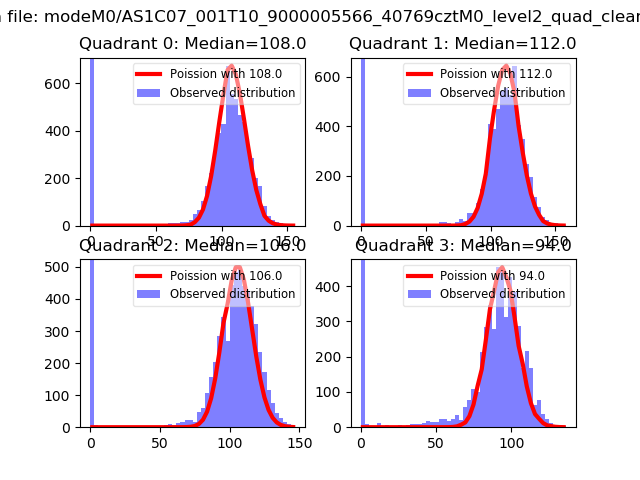
| Comparison with Poisson distribution Blue bars denote a histogram of data divided into 1 sec bins. Red curve is a Poisson curve with rate = median count rate of data. |
 |
 |
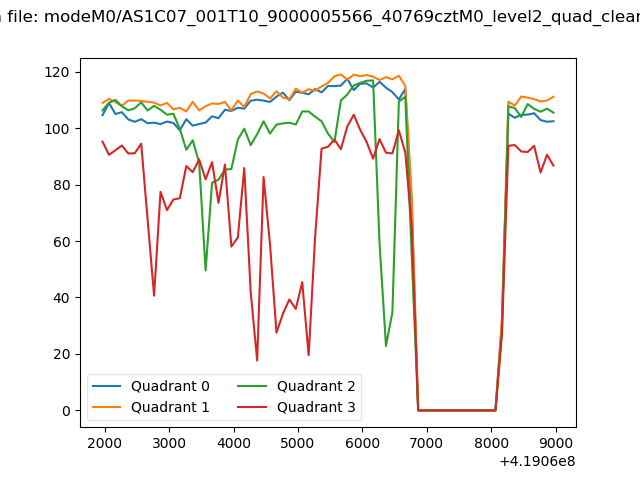
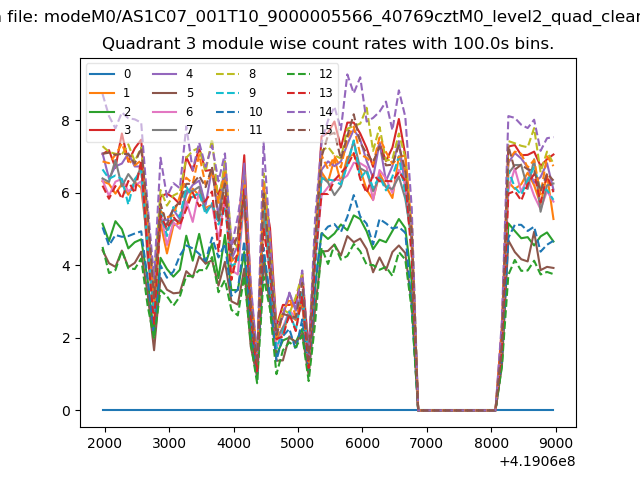
| Quadrant-wise count rates Data is divided into 100 sec bins |
 |
|
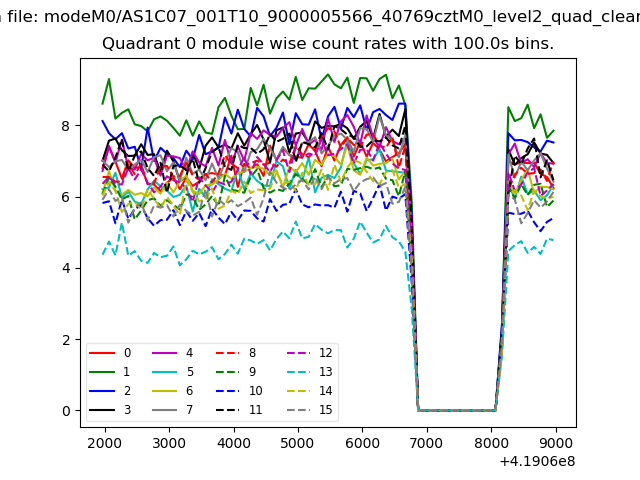
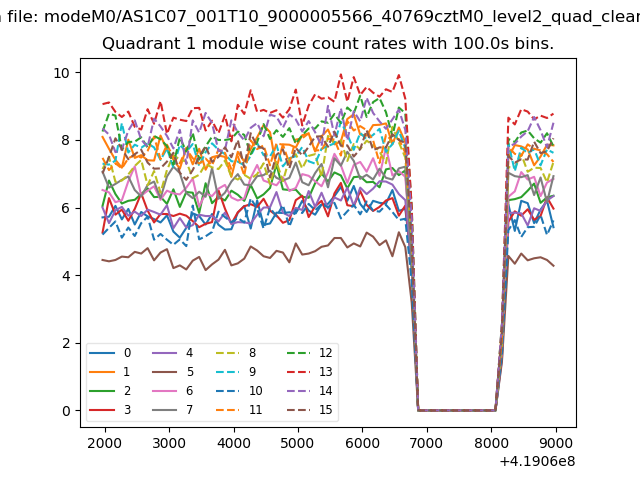
| Module-wise count rates for Quadrant A Data is divided into 100 sec bins |
 |
 |
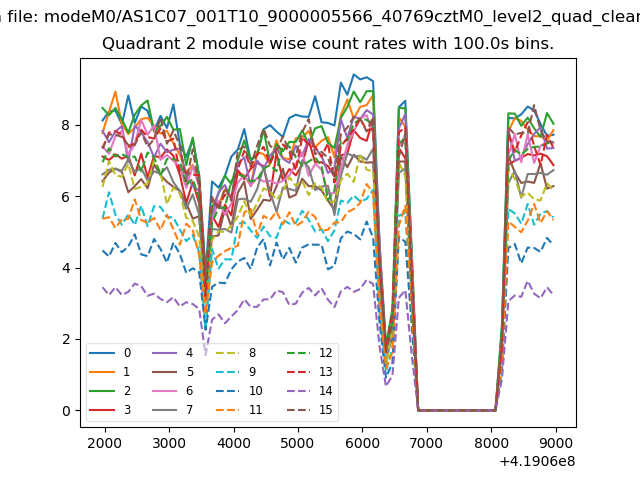
| Module-wise count rates for Quadrant B Data is divided into 100 sec bins |
 |
 |
| Module-wise count rates for Quadrant C Data is divided into 100 sec bins |
 |
 |
| Module-wise count rates for Quadrant D Data is divided into 100 sec bins |
 |
 |
| Parameter | Plot |
|---|---|
| CZT HV Monitor | 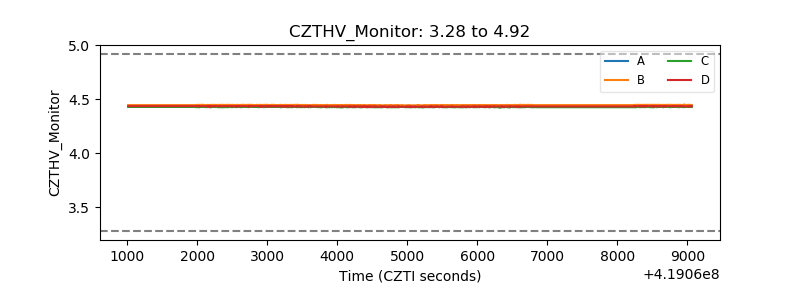 |
| D_VDD | 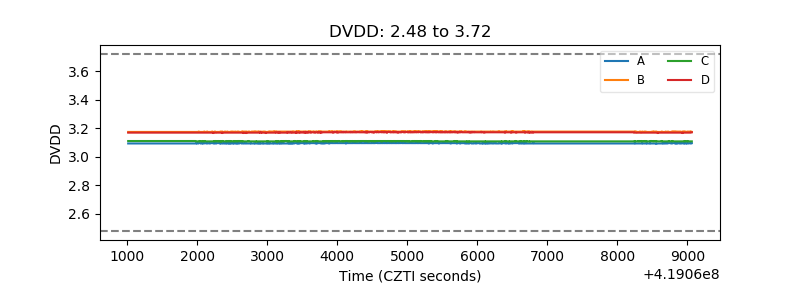 |
| Temperature 1 | 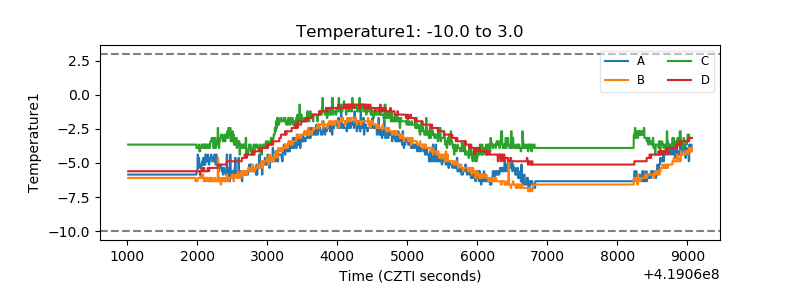 |
| Veto HV Monitor | 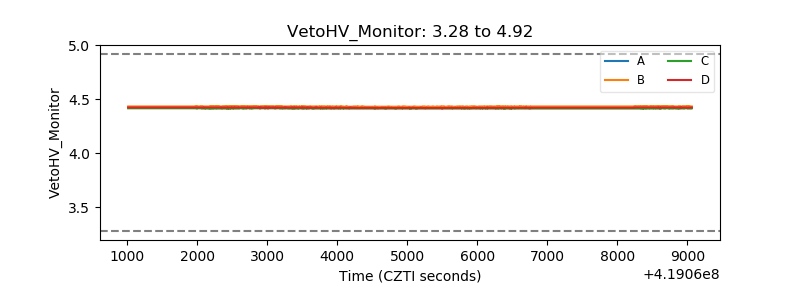 |
| Veto LLD | 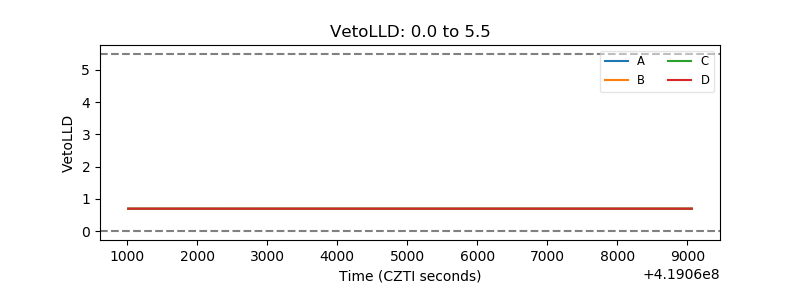 |
| Alpha Counter | 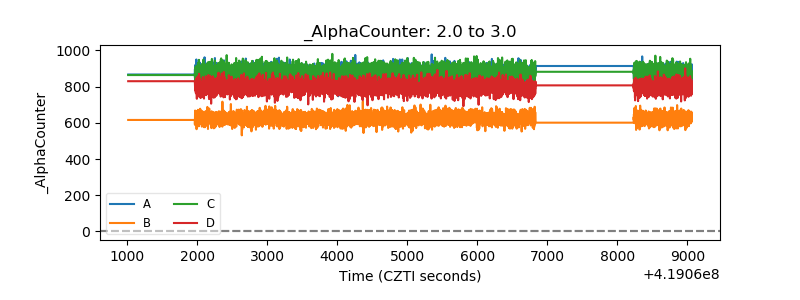 |
| _CPM_Rate | 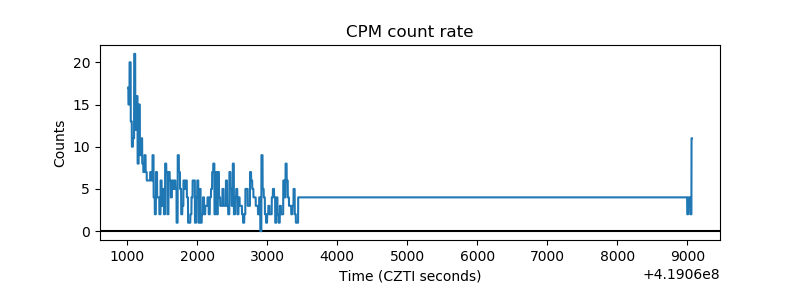 |
| CZT Counter | 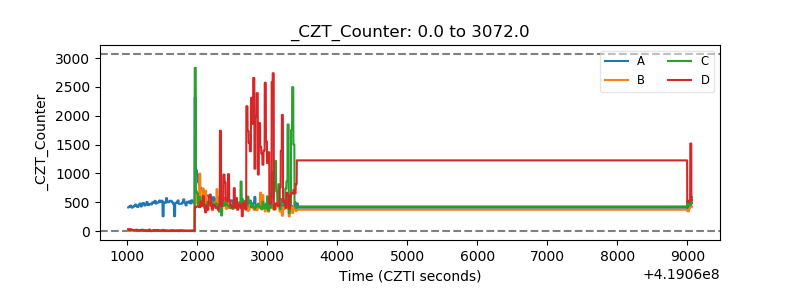 |
| +2.5 Volts monitor |  |
| +5 Volts monitor | 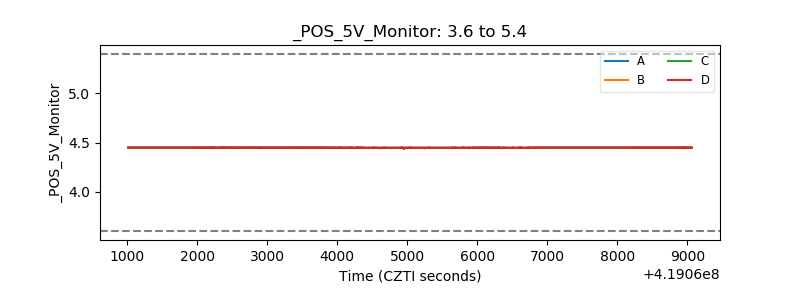 |
| _ROLL_ROT | 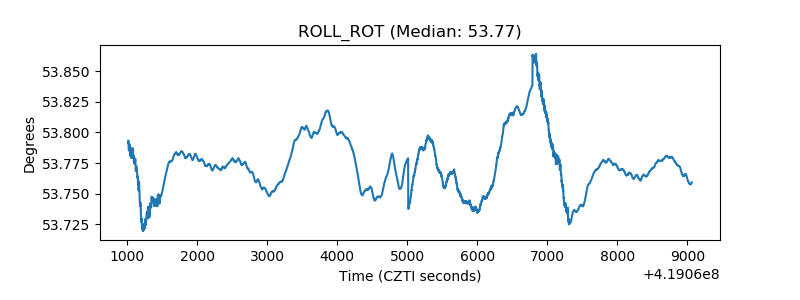 |
| _Roll_DEC | 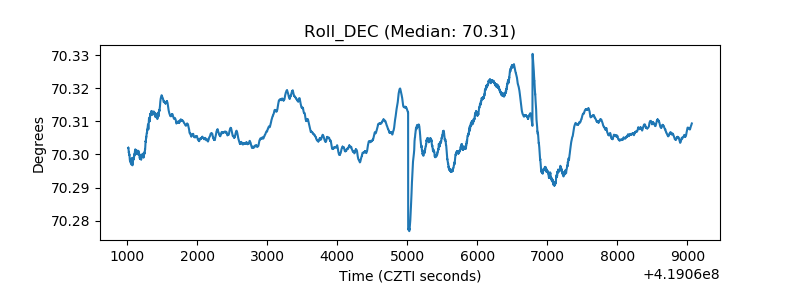 |
| _Roll_RA | 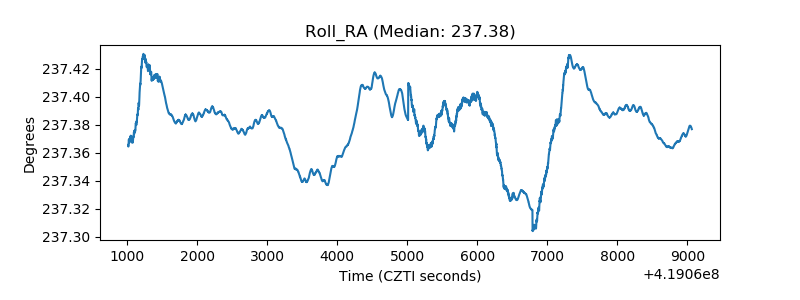 |
| Veto Counter | 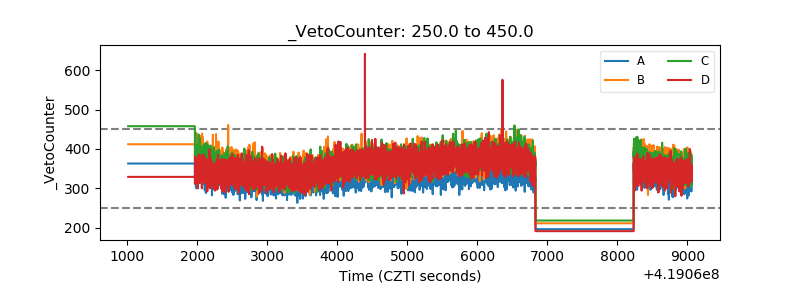 |