| Param | Original file | Final file |
|---|---|---|
| Filename | modeM0/AS1C07_001T10_9000005566_40770cztM0_level2.fits | modeM0/AS1C07_001T10_9000005566_40770cztM0_level2_quad_clean.evt |
| Size (bytes) | 383,745,600 | 91,388,160 |
| Size | 366.0 MB | 87.2 MB |
| Events in quadrant A | 3,214,516 | 619,212 |
| Events in quadrant B | 2,776,747 | 648,203 |
| Events in quadrant C | 3,104,692 | 617,310 |
| Events in quadrant D | 4,656,904 | 476,350 |
| Mode M9 | |||
|---|---|---|---|
| Quadrant | BADHDUFLAG | Total packets | Discarded packets |
| A | 0 | 13 | 0 |
| B | 0 | 13 | 0 |
| C | 0 | 13 | 0 |
| D | 0 | 13 | 0 |
| Mode M0 | |||
|---|---|---|---|
| Quadrant | BADHDUFLAG | Total packets | Discarded packets |
| A | 0 | 12910 | 3 |
| B | 0 | 12277 | 2 |
| C | 0 | 12866 | 2 |
| D | 0 | 17816 | 2 |
| Mode SS | |||
|---|---|---|---|
| Quadrant | BADHDUFLAG | Total packets | Discarded packets |
| A | 0 | 120 | 0 |
| B | 0 | 120 | 0 |
| C | 0 | 120 | 0 |
| D | 0 | 120 | 0 |
| Quadrant | Total seconds | Saturated seconds | Saturation percentage |
|---|---|---|---|
| A | 5800 | 46 | 0.793103% |
| B | 5800 | 28 | 0.482759% |
| C | 5800 | 13 | 0.224138% |
| D | 5800 | 1105 | 19.051724% |
Noise dominated data is calculated using 1-second bins in cleaned event files. If a bin has >2000 counts, and if more than 50% of those come from <1% of pixels, then it is considered to be noise-dominated and hence unusable.
| Quadrant | # 1 sec bins | Bins with >0 counts | Bins with >2000 counts | High rate bins dominated by noise | Noise dominated (total time) | Noise dominated (detector-on time) | Marked lightcurve |
|---|---|---|---|---|---|---|---|
| A | 7114 | 5801 | 37 | 37 | 0.52% | 0.64% | 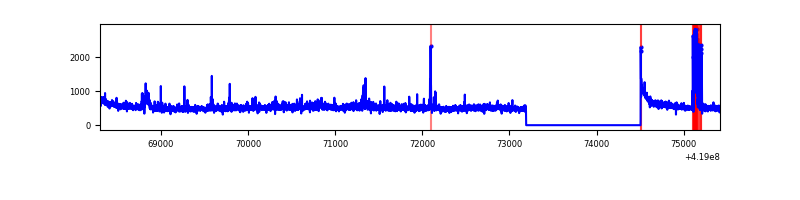 |
| B | 7114 | 5801 | 9 | 9 | 0.13% | 0.16% | 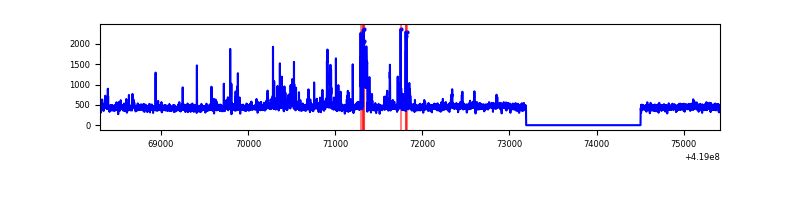 |
| C | 7114 | 5801 | 11 | 11 | 0.15% | 0.19% | 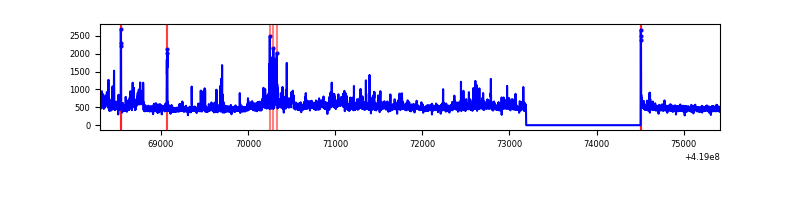 |
| D | 7114 | 5801 | 373 | 373 | 5.24% | 6.43% | 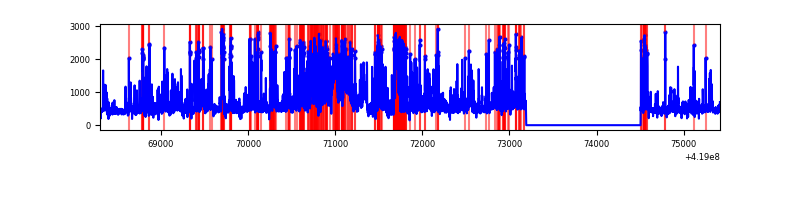 |
Top three noisy pixels from each quadrant. If the there are fewer than three noisy pixels in the level2.evt file, extra rows are filled as -1
| Pixel properties | Quadrant properties | ||||||
|---|---|---|---|---|---|---|---|
| Quadrant | DetID | PixID | Counts | Sigma | Mean | Median | Sigma |
| A | 10 | 83 | 502129 | 3914.5 | 628 | 613 | 128.1 |
| A | 12 | 189 | 132458 | 1029.09 | 628 | 613 | 128.1 |
| A | 13 | 248 | 123107 | 956.1 | 628 | 613 | 128.1 |
| B | 0 | 190 | 111589 | 905.38 | 628 | 609 | 122.6 |
| B | 0 | 229 | 68778 | 556.13 | 628 | 609 | 122.6 |
| B | 5 | 255 | 66989 | 541.53 | 628 | 609 | 122.6 |
| C | 9 | 187 | 287974 | 1999.55 | 617 | 622 | 143.7 |
| C | 15 | 214 | 247365 | 1716.97 | 617 | 622 | 143.7 |
| C | 14 | 254 | 88617 | 612.32 | 617 | 622 | 143.7 |
| D | 12 | 227 | 1107555 | 7913.2 | 562 | 545 | 139.9 |
| D | 2 | 249 | 697868 | 4984.65 | 562 | 545 | 139.9 |
| D | 2 | 153 | 269626 | 1923.46 | 562 | 545 | 139.9 |
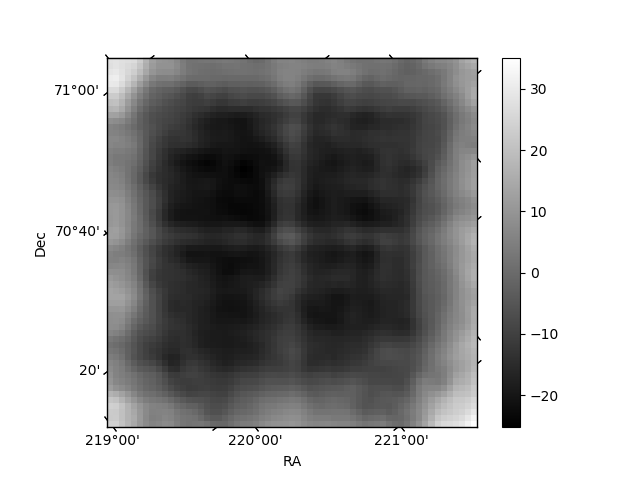
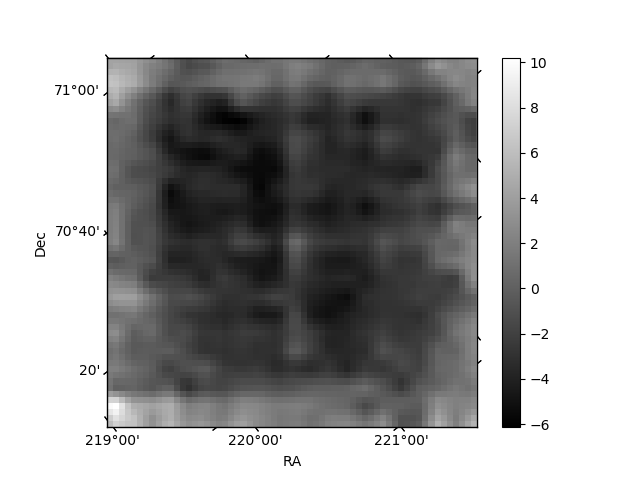
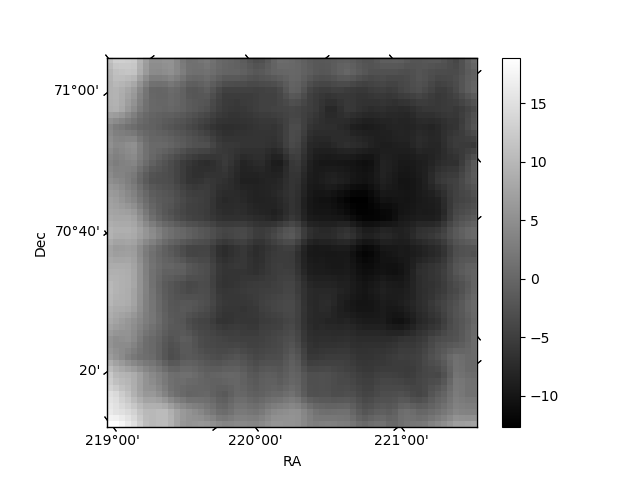
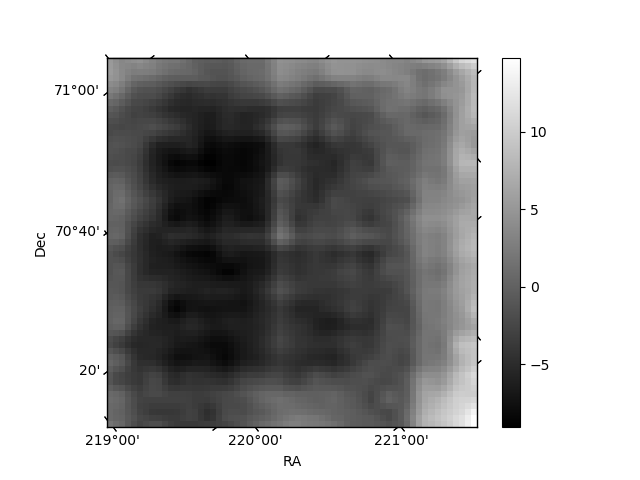
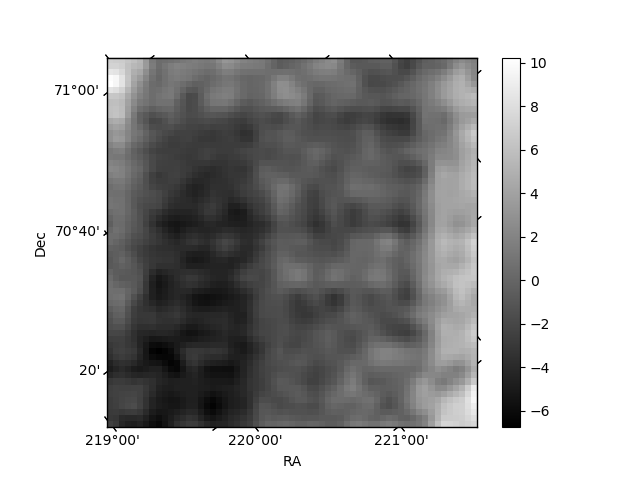
Histogram calculated using DETX and DETY for each event in the final _common_clean file
| Quadrant A | 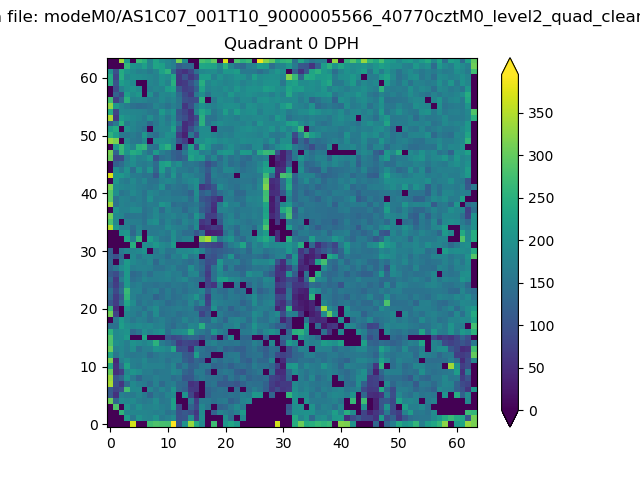 |
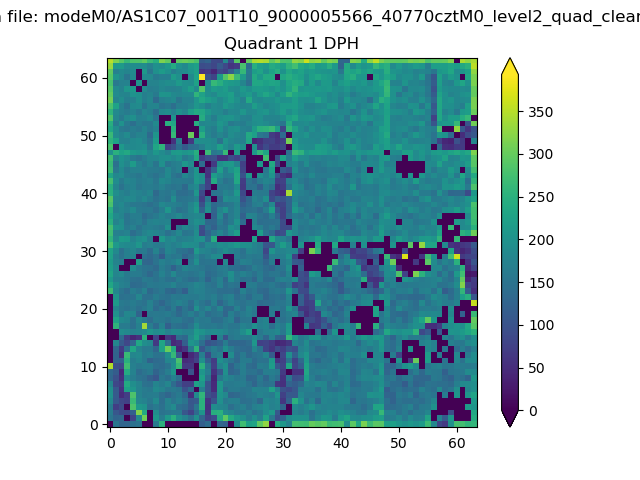 |
Quadrant B |
|---|---|---|---|
| Quadrant D | 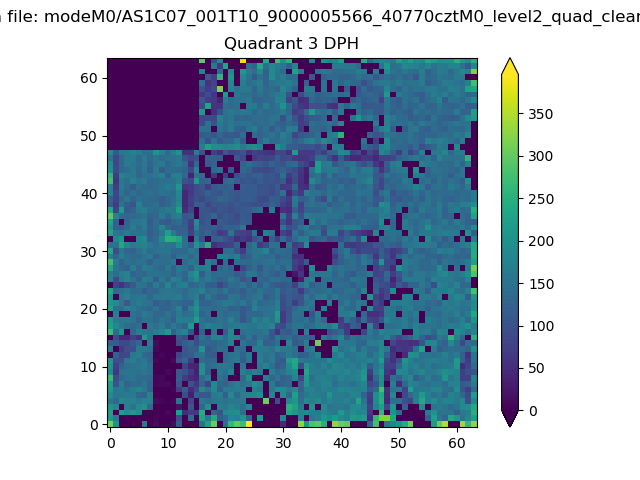 |
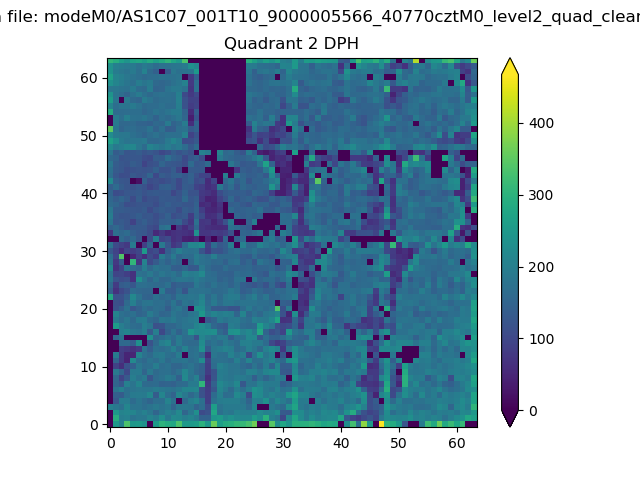 |
Quadrant C |
| Plot type | Count rate plots | Images |
|---|---|---|
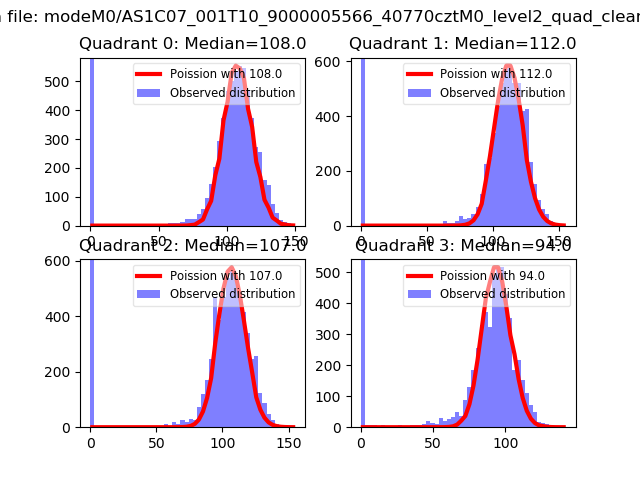
| Comparison with Poisson distribution Blue bars denote a histogram of data divided into 1 sec bins. Red curve is a Poisson curve with rate = median count rate of data. |
 |
 |
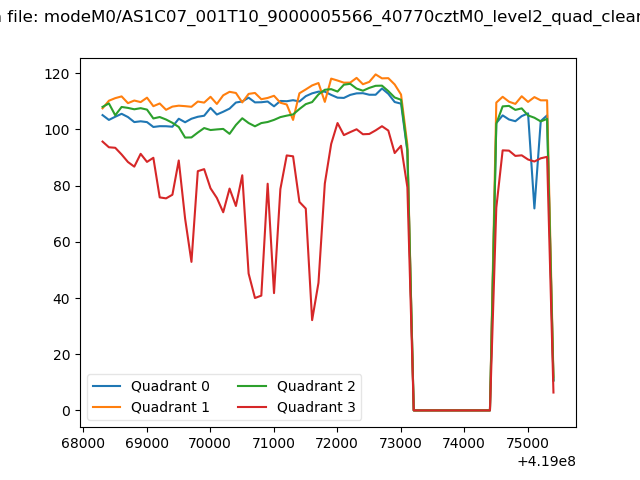
| Quadrant-wise count rates Data is divided into 100 sec bins |
 |
|
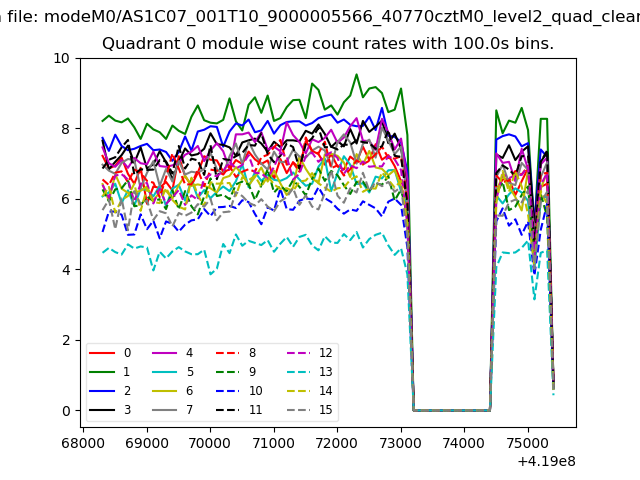
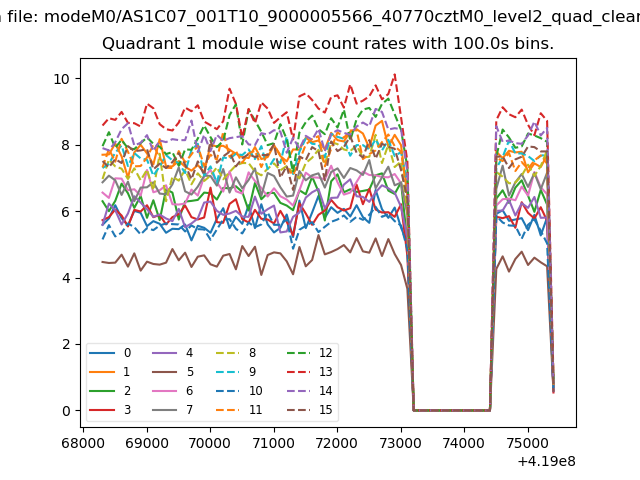
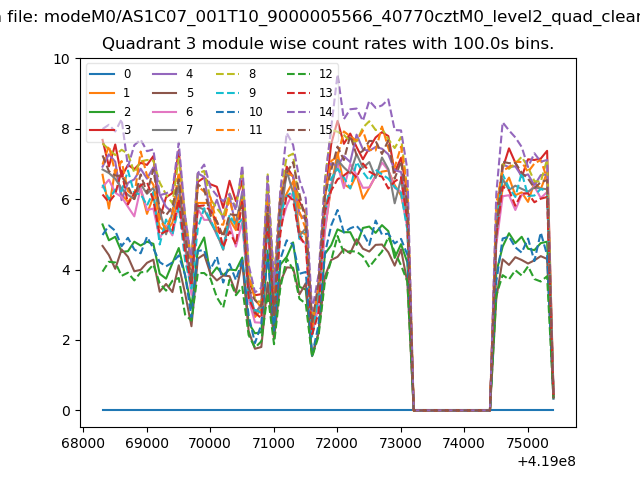
| Module-wise count rates for Quadrant A Data is divided into 100 sec bins |
 |
 |
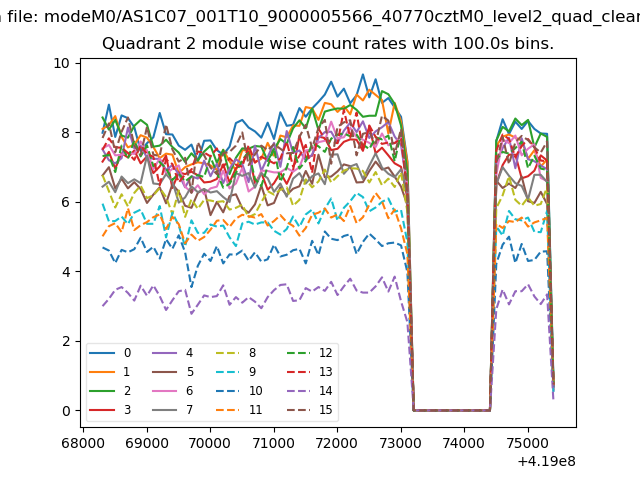
| Module-wise count rates for Quadrant B Data is divided into 100 sec bins |
 |
 |
| Module-wise count rates for Quadrant C Data is divided into 100 sec bins |
 |
 |
| Module-wise count rates for Quadrant D Data is divided into 100 sec bins |
 |
 |
| Parameter | Plot |
|---|---|
| CZT HV Monitor | 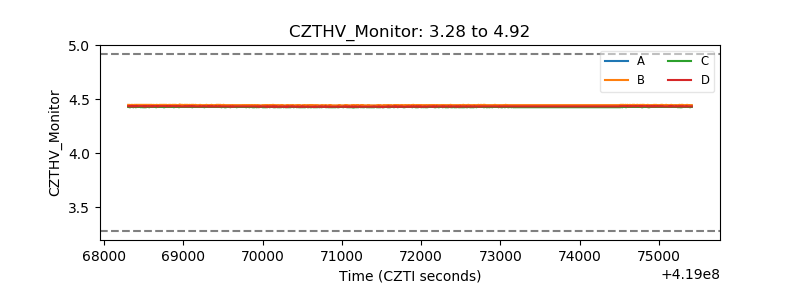 |
| D_VDD | 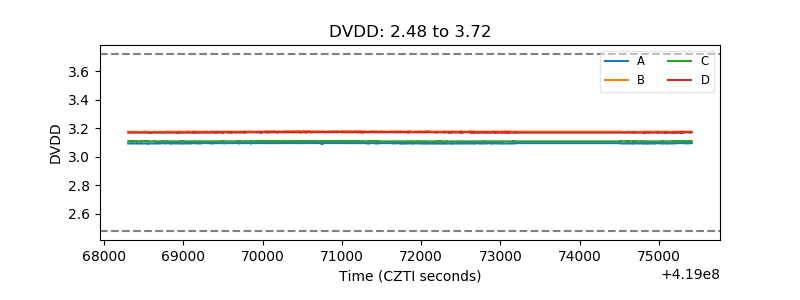 |
| Temperature 1 | 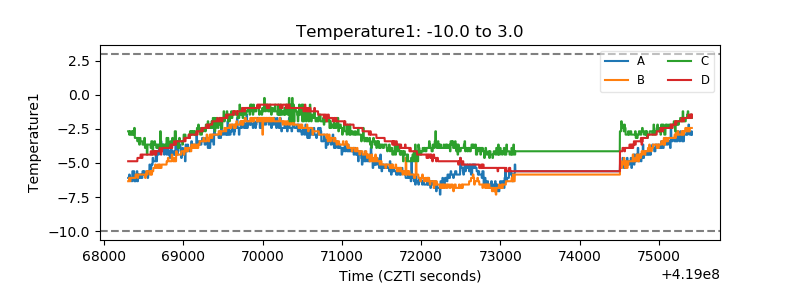 |
| Veto HV Monitor | 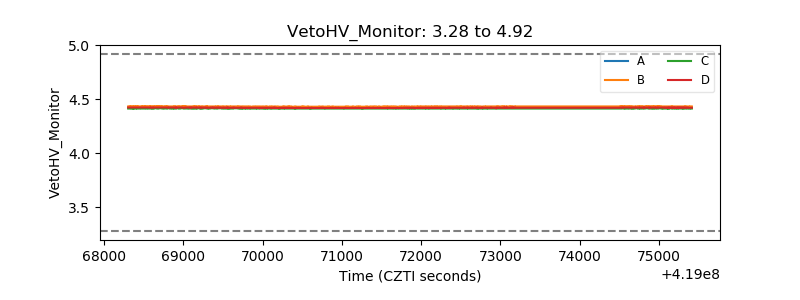 |
| Veto LLD | 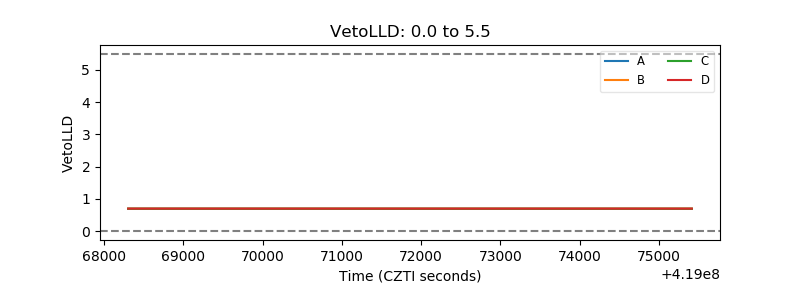 |
| Alpha Counter | 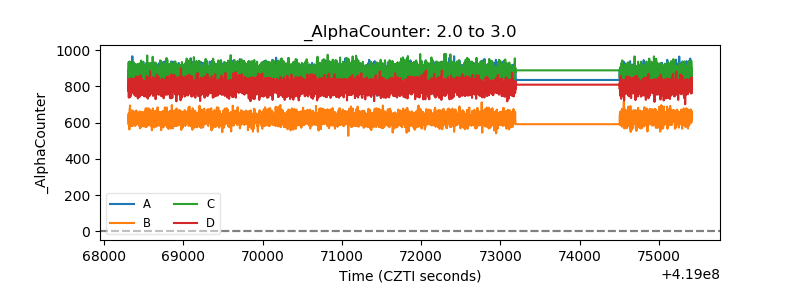 |
| _CPM_Rate | 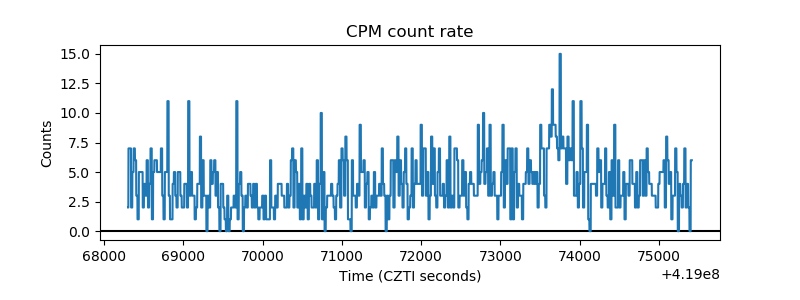 |
| CZT Counter | 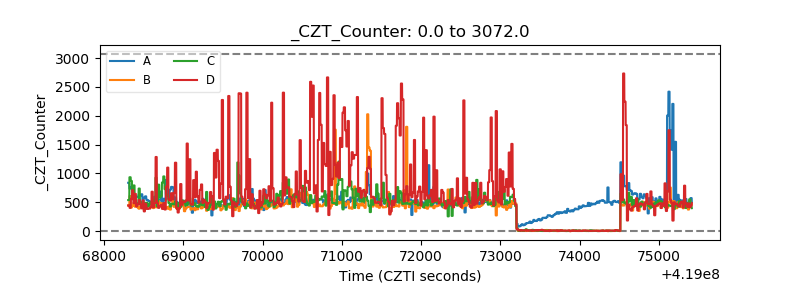 |
| +2.5 Volts monitor | 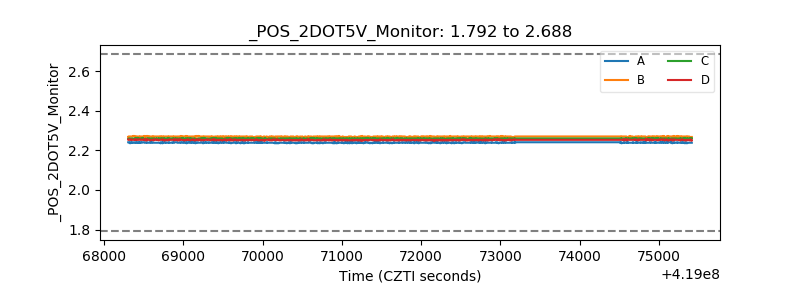 |
| +5 Volts monitor |  |
| _ROLL_ROT | 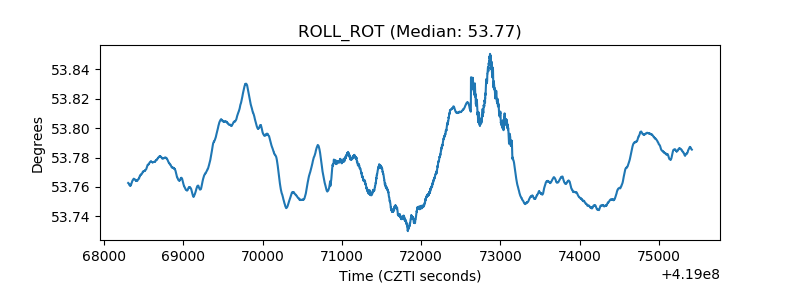 |
| _Roll_DEC | 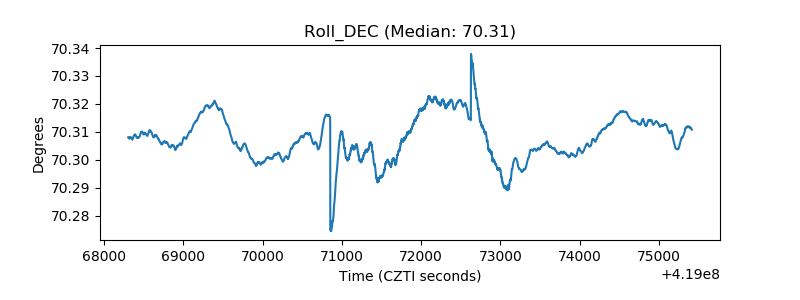 |
| _Roll_RA | 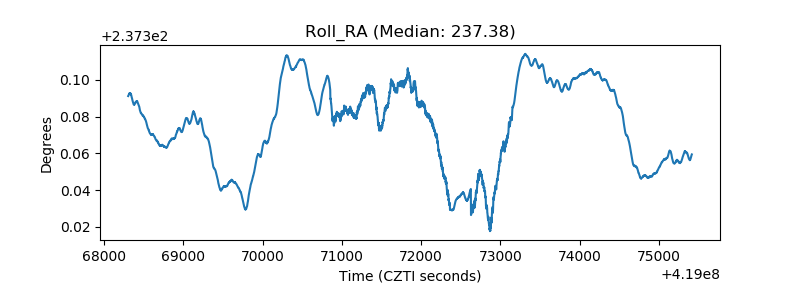 |
| Veto Counter | 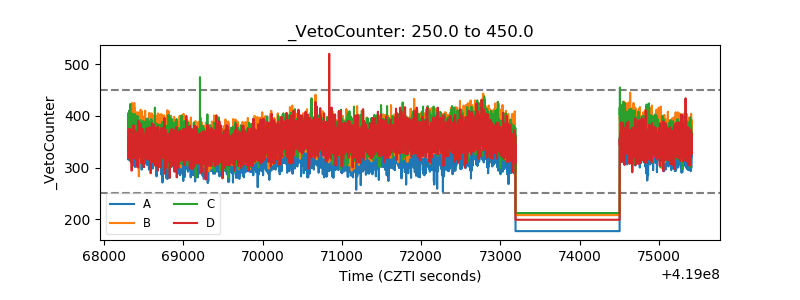 |