| Param | Original file | Final file |
|---|---|---|
| Filename | modeM0/AS1C07_001T10_9000005566_40773cztM0_level2.fits | modeM0/AS1C07_001T10_9000005566_40773cztM0_level2_quad_clean.evt |
| Size (bytes) | 1,104,056,640 | 237,625,920 |
| Size | 1.0 GB | 226.6 MB |
| Events in quadrant A | 8,328,186 | 1,664,603 |
| Events in quadrant B | 8,818,004 | 1,668,161 |
| Events in quadrant C | 11,081,734 | 1,553,731 |
| Events in quadrant D | 11,436,067 | 1,235,311 |
| Mode M9 | |||
|---|---|---|---|
| Quadrant | BADHDUFLAG | Total packets | Discarded packets |
| A | 0 | 42 | 0 |
| B | 0 | 42 | 0 |
| C | 0 | 42 | 0 |
| D | 0 | 42 | 0 |
| Mode M0 | |||
|---|---|---|---|
| Quadrant | BADHDUFLAG | Total packets | Discarded packets |
| A | 0 | 34099 | 4 |
| B | 0 | 36720 | 3 |
| C | 0 | 42944 | 3 |
| D | 0 | 44808 | 3 |
| Mode SS | |||
|---|---|---|---|
| Quadrant | BADHDUFLAG | Total packets | Discarded packets |
| A | 0 | 316 | 0 |
| B | 0 | 316 | 0 |
| C | 0 | 316 | 0 |
| D | 0 | 316 | 0 |
| Quadrant | Total seconds | Saturated seconds | Saturation percentage |
|---|---|---|---|
| A | 15537 | 79 | 0.508464% |
| B | 15537 | 573 | 3.687971% |
| C | 15537 | 884 | 5.689644% |
| D | 15537 | 3004 | 19.334492% |
Noise dominated data is calculated using 1-second bins in cleaned event files. If a bin has >2000 counts, and if more than 50% of those come from <1% of pixels, then it is considered to be noise-dominated and hence unusable.
| Quadrant | # 1 sec bins | Bins with >0 counts | Bins with >2000 counts | High rate bins dominated by noise | Noise dominated (total time) | Noise dominated (detector-on time) | Marked lightcurve |
|---|---|---|---|---|---|---|---|
| A | 19746 | 15540 | 53 | 53 | 0.27% | 0.34% | 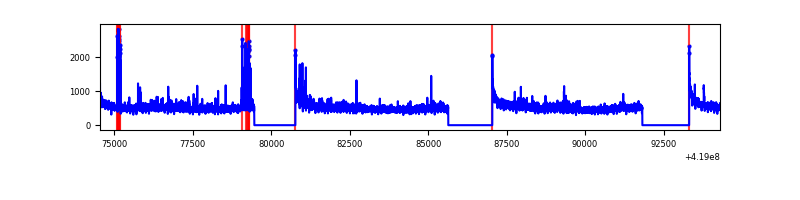 |
| B | 19746 | 15540 | 459 | 459 | 2.32% | 2.95% | 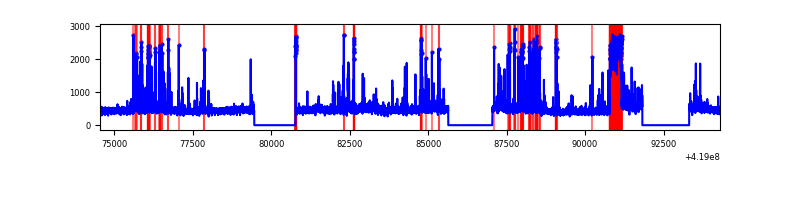 |
| C | 19745 | 15539 | 846 | 846 | 4.28% | 5.44% | 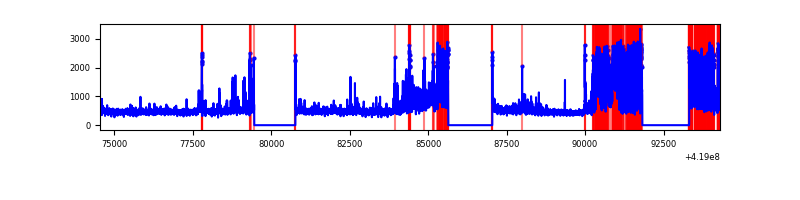 |
| D | 19745 | 15539 | 800 | 800 | 4.05% | 5.15% | 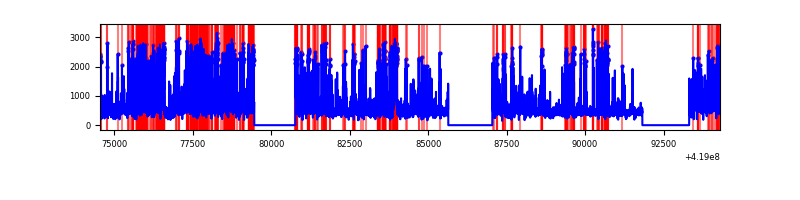 |
Top three noisy pixels from each quadrant. If the there are fewer than three noisy pixels in the level2.evt file, extra rows are filled as -1
| Pixel properties | Quadrant properties | ||||||
|---|---|---|---|---|---|---|---|
| Quadrant | DetID | PixID | Counts | Sigma | Mean | Median | Sigma |
| A | 10 | 83 | 1305993 | 3789.2 | 1691 | 1654 | 344.2 |
| A | 13 | 248 | 252556 | 728.89 | 1691 | 1654 | 344.2 |
| A | 12 | 189 | 150371 | 432.03 | 1691 | 1654 | 344.2 |
| B | 7 | 202 | 983542 | 3087.34 | 1666 | 1619 | 318.0 |
| B | 5 | 255 | 386356 | 1209.68 | 1666 | 1619 | 318.0 |
| B | 15 | 85 | 376844 | 1179.77 | 1666 | 1619 | 318.0 |
| C | 9 | 187 | 3898379 | 10317.54 | 1628 | 1640 | 377.7 |
| C | 15 | 214 | 647641 | 1710.44 | 1628 | 1640 | 377.7 |
| C | 14 | 254 | 75543 | 195.68 | 1628 | 1640 | 377.7 |
| D | 12 | 227 | 2834558 | 7702.25 | 1496 | 1453 | 367.8 |
| D | 2 | 249 | 776491 | 2107.07 | 1496 | 1453 | 367.8 |
| D | 12 | 191 | 540098 | 1464.39 | 1496 | 1453 | 367.8 |
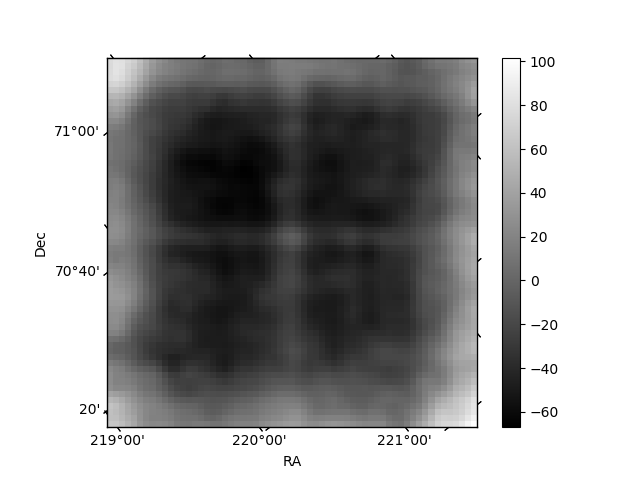
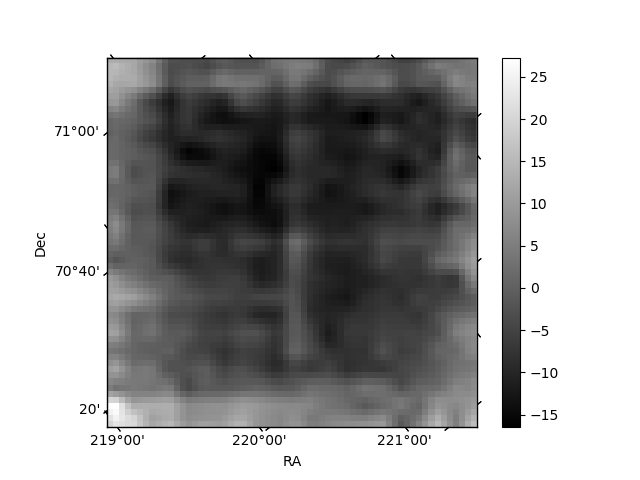
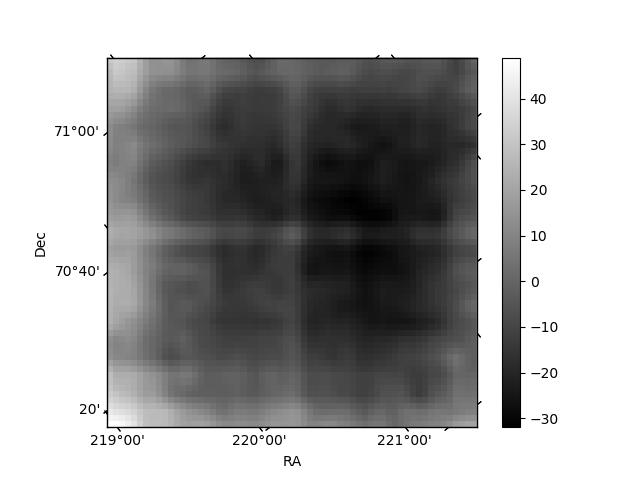
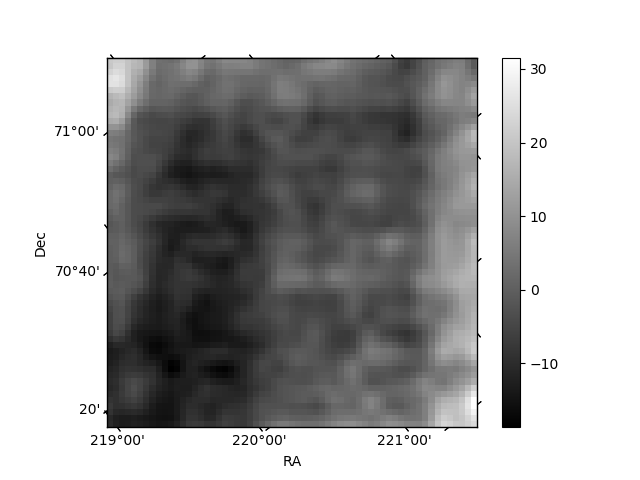
Histogram calculated using DETX and DETY for each event in the final _common_clean file
| Quadrant A | 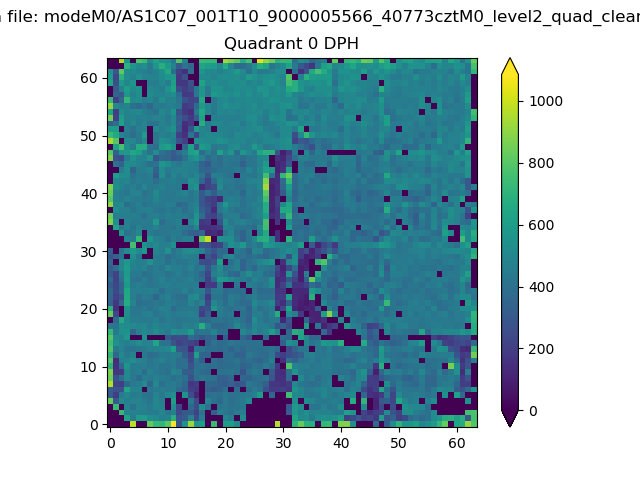 |
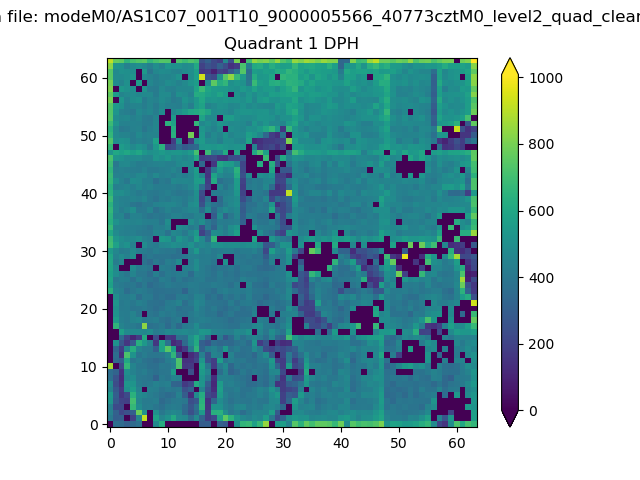 |
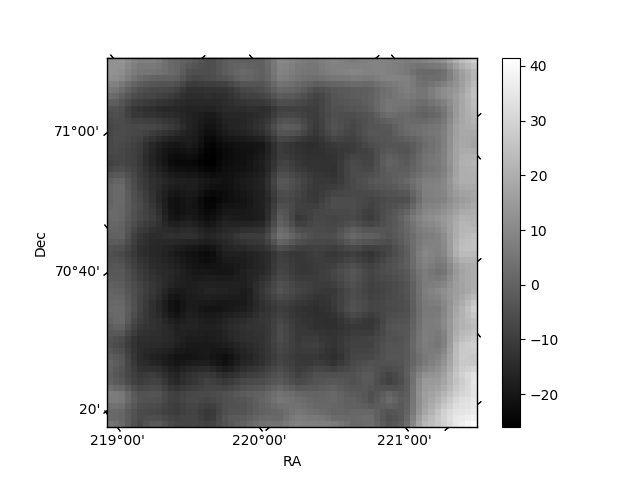
Quadrant B |
|---|---|---|---|
| Quadrant D | 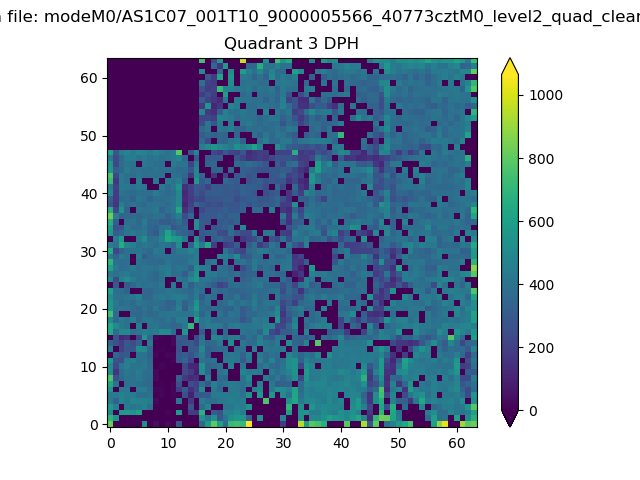 |
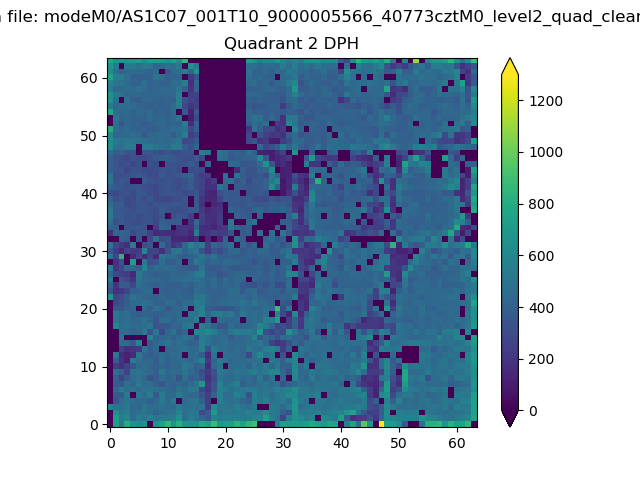 |
Quadrant C |
| Plot type | Count rate plots | Images |
|---|---|---|
| Comparison with Poisson distribution Blue bars denote a histogram of data divided into 1 sec bins. Red curve is a Poisson curve with rate = median count rate of data. |
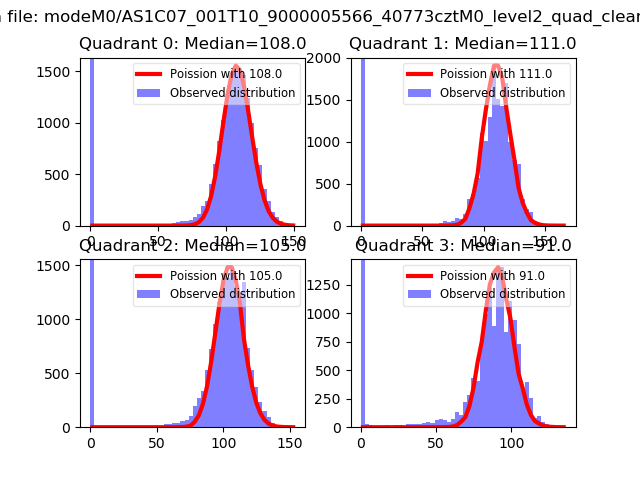 |
 |
| Quadrant-wise count rates Data is divided into 100 sec bins |
 |
|
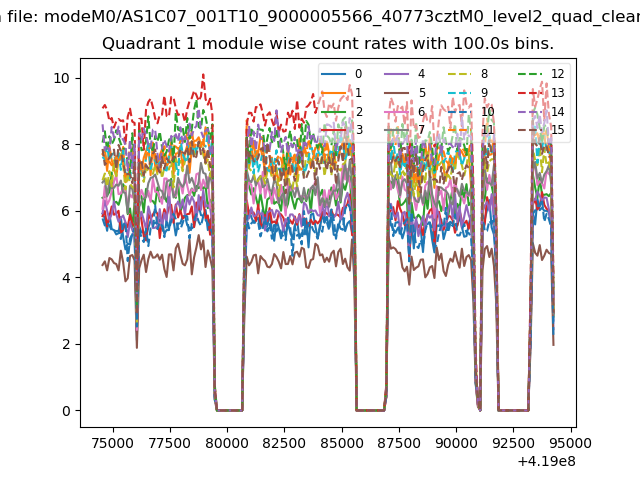
| Module-wise count rates for Quadrant A Data is divided into 100 sec bins |
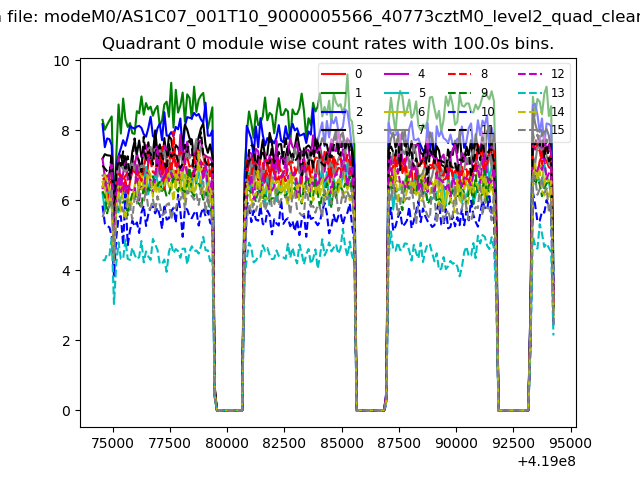 |
 |
| Module-wise count rates for Quadrant B Data is divided into 100 sec bins |
 |
 |
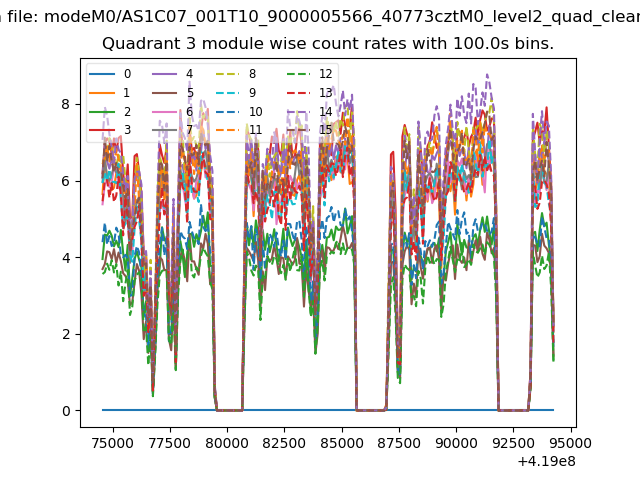
| Module-wise count rates for Quadrant C Data is divided into 100 sec bins |
 |
 |
| Module-wise count rates for Quadrant D Data is divided into 100 sec bins |
 |
 |
| Parameter | Plot |
|---|---|
| CZT HV Monitor |  |
| D_VDD | 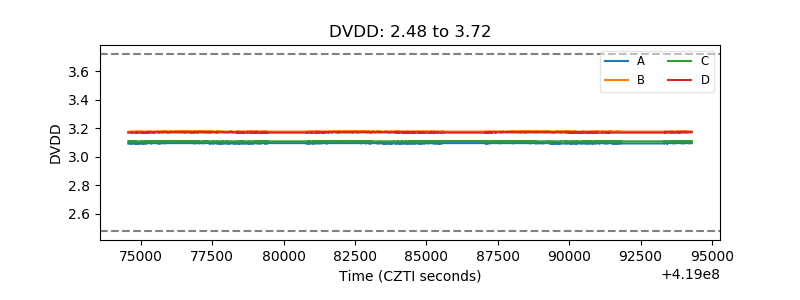 |
| Temperature 1 | 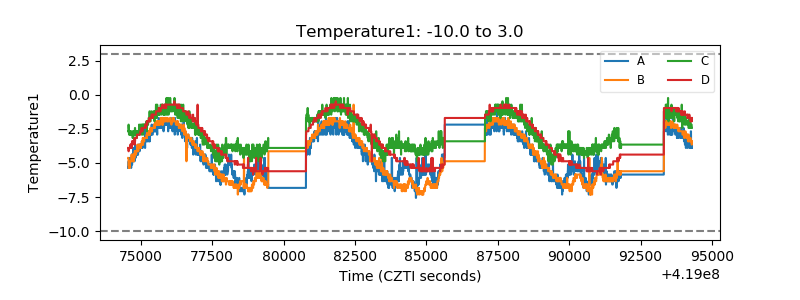 |
| Veto HV Monitor |  |
| Veto LLD | 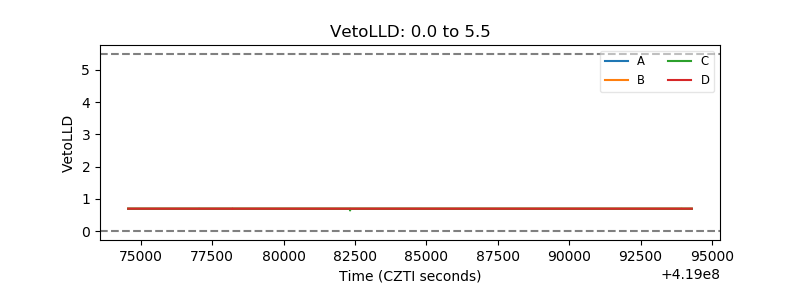 |
| Alpha Counter | 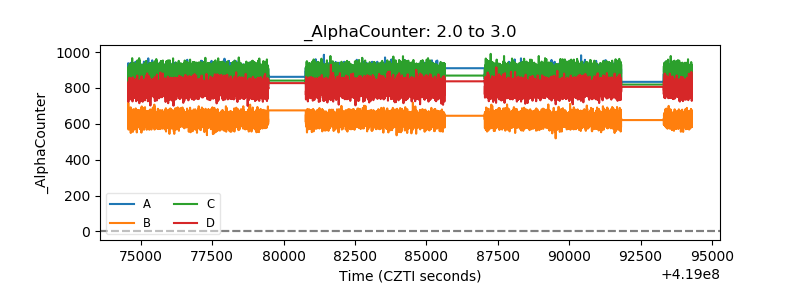 |
| _CPM_Rate | 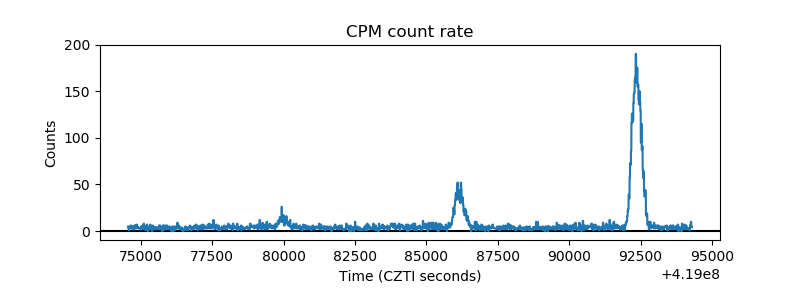 |
| CZT Counter | 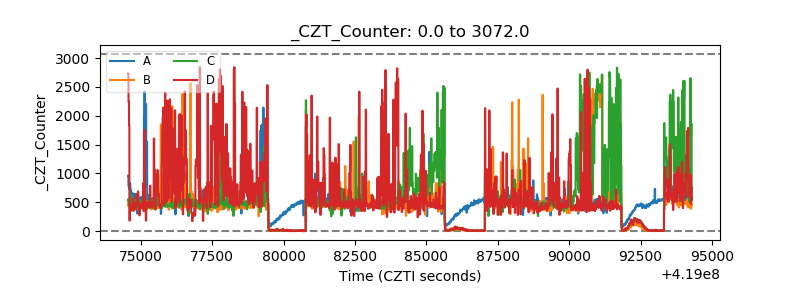 |
| +2.5 Volts monitor | 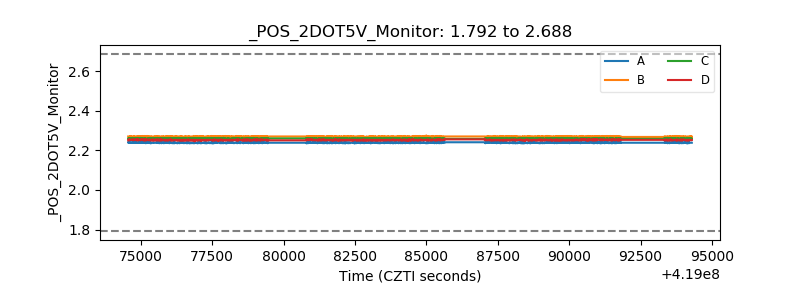 |
| +5 Volts monitor |  |
| _ROLL_ROT | 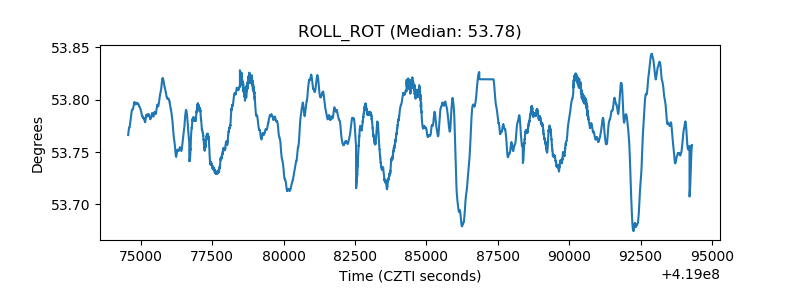 |
| _Roll_DEC | 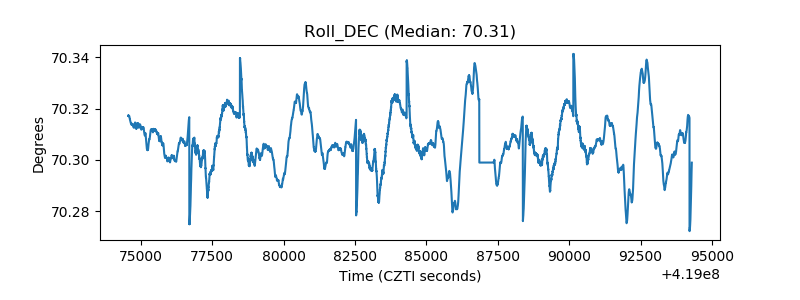 |
| _Roll_RA | 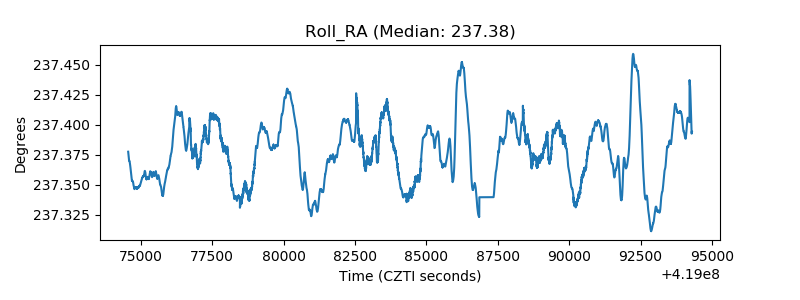 |
| Veto Counter |  |