| Param | Original file | Final file |
|---|---|---|
| Filename | modeM0/AS1C07_001T10_9000005566_40774cztM0_level2.fits | modeM0/AS1C07_001T10_9000005566_40774cztM0_level2_quad_clean.evt |
| Size (bytes) | 494,487,360 | 83,456,640 |
| Size | 471.6 MB | 79.6 MB |
| Events in quadrant A | 2,923,972 | 608,350 |
| Events in quadrant B | 3,556,477 | 599,152 |
| Events in quadrant C | 7,166,338 | 465,693 |
| Events in quadrant D | 4,224,502 | 463,859 |
| Mode M9 | |||
|---|---|---|---|
| Quadrant | BADHDUFLAG | Total packets | Discarded packets |
| A | 0 | 24 | 0 |
| B | 0 | 24 | 0 |
| C | 0 | 24 | 0 |
| D | 0 | 25 | 0 |
| Mode M0 | |||
|---|---|---|---|
| Quadrant | BADHDUFLAG | Total packets | Discarded packets |
| A | 0 | 12264 | 3 |
| B | 0 | 14397 | 2 |
| C | 0 | 25021 | 2 |
| D | 0 | 16354 | 2 |
| Mode SS | |||
|---|---|---|---|
| Quadrant | BADHDUFLAG | Total packets | Discarded packets |
| A | 0 | 114 | 0 |
| B | 0 | 114 | 0 |
| C | 0 | 114 | 0 |
| D | 0 | 114 | 0 |
| Quadrant | Total seconds | Saturated seconds | Saturation percentage |
|---|---|---|---|
| A | 5563 | 17 | 0.305591% |
| B | 5563 | 310 | 5.572533% |
| C | 5563 | 1474 | 26.496495% |
| D | 5563 | 1018 | 18.299479% |
Noise dominated data is calculated using 1-second bins in cleaned event files. If a bin has >2000 counts, and if more than 50% of those come from <1% of pixels, then it is considered to be noise-dominated and hence unusable.
| Quadrant | # 1 sec bins | Bins with >0 counts | Bins with >2000 counts | High rate bins dominated by noise | Noise dominated (total time) | Noise dominated (detector-on time) | Marked lightcurve |
|---|---|---|---|---|---|---|---|
| A | 7206 | 5564 | 4 | 4 | 0.06% | 0.07% | 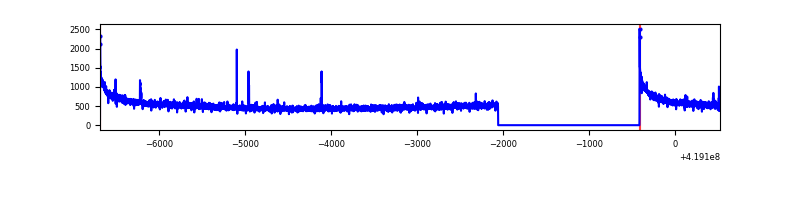 |
| B | 7206 | 5564 | 248 | 248 | 3.44% | 4.46% | 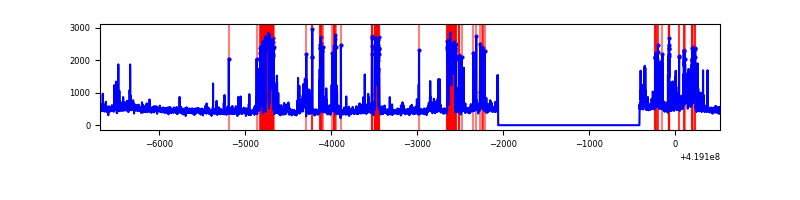 |
| C | 7206 | 5564 | 1432 | 1432 | 19.87% | 25.74% | 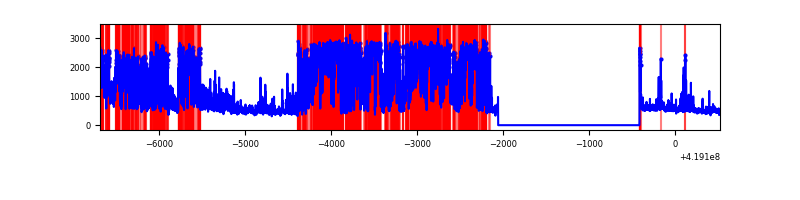 |
| D | 7206 | 5564 | 317 | 317 | 4.40% | 5.70% | 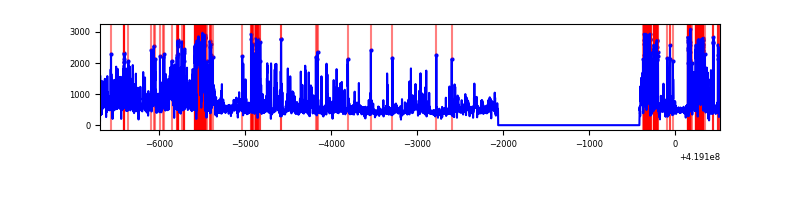 |
Top three noisy pixels from each quadrant. If the there are fewer than three noisy pixels in the level2.evt file, extra rows are filled as -1
| Pixel properties | Quadrant properties | ||||||
|---|---|---|---|---|---|---|---|
| Quadrant | DetID | PixID | Counts | Sigma | Mean | Median | Sigma |
| A | 10 | 83 | 528399 | 4224.82 | 607 | 594 | 124.9 |
| A | 12 | 189 | 21938 | 170.85 | 607 | 594 | 124.9 |
| A | 13 | 254 | 8202 | 60.9 | 607 | 594 | 124.9 |
| B | 5 | 255 | 919748 | 7940.98 | 593 | 576 | 115.8 |
| B | 0 | 229 | 202642 | 1745.7 | 593 | 576 | 115.8 |
| B | 4 | 171 | 39528 | 336.52 | 593 | 576 | 115.8 |
| C | 9 | 187 | 2876862 | 23187.98 | 535 | 537 | 124.0 |
| C | 14 | 254 | 1934193 | 15588.49 | 535 | 537 | 124.0 |
| C | 15 | 214 | 214583 | 1725.57 | 535 | 537 | 124.0 |
| D | 12 | 227 | 1383996 | 10319.79 | 542 | 526 | 134.1 |
| D | 12 | 191 | 176227 | 1310.61 | 542 | 526 | 134.1 |
| D | 2 | 153 | 154809 | 1150.85 | 542 | 526 | 134.1 |
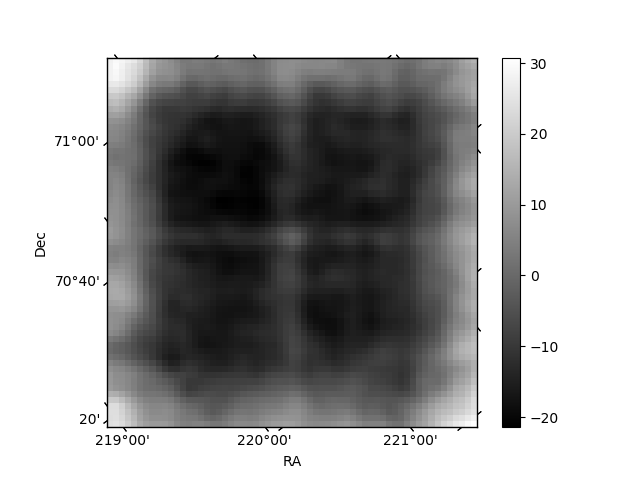
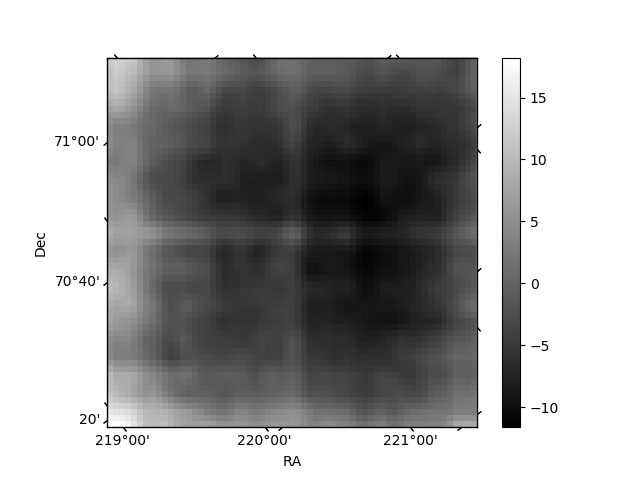
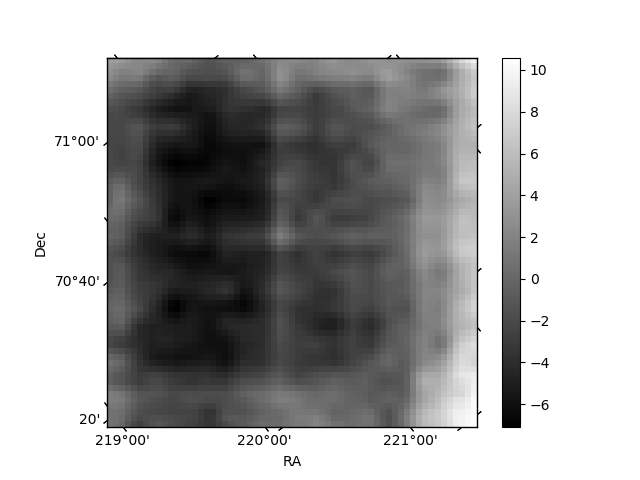
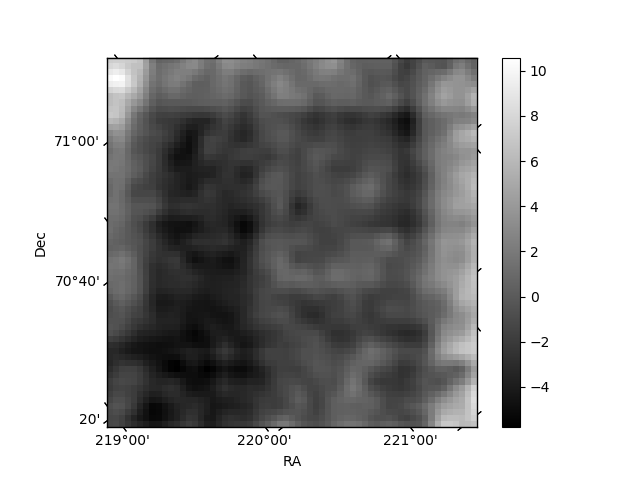
Histogram calculated using DETX and DETY for each event in the final _common_clean file
| Quadrant A | 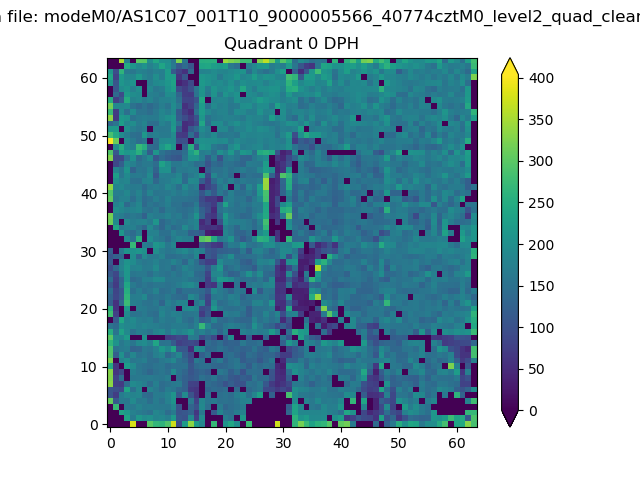 |
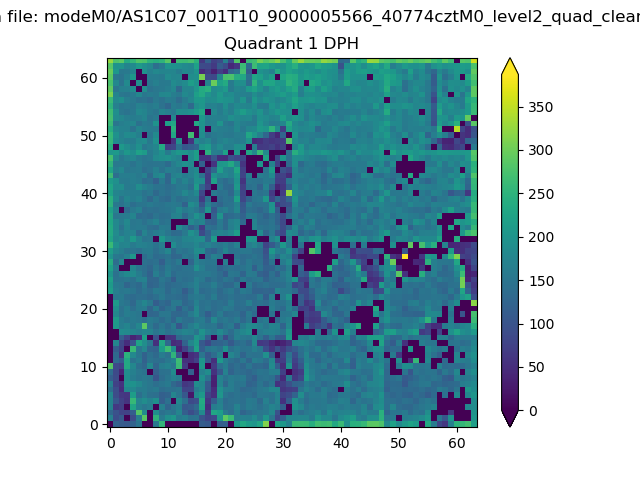 |
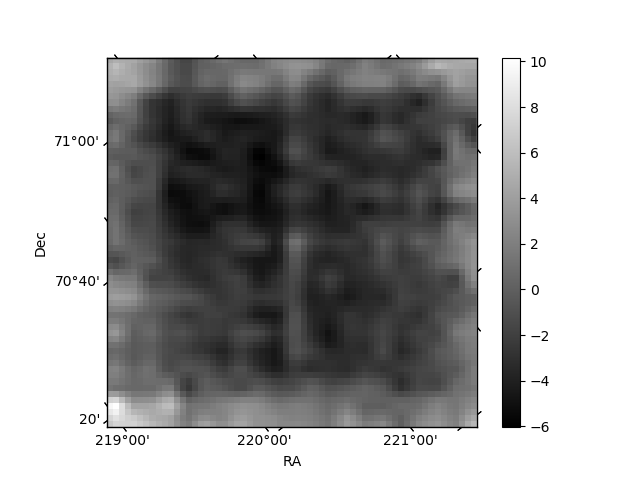
Quadrant B |
|---|---|---|---|
| Quadrant D | 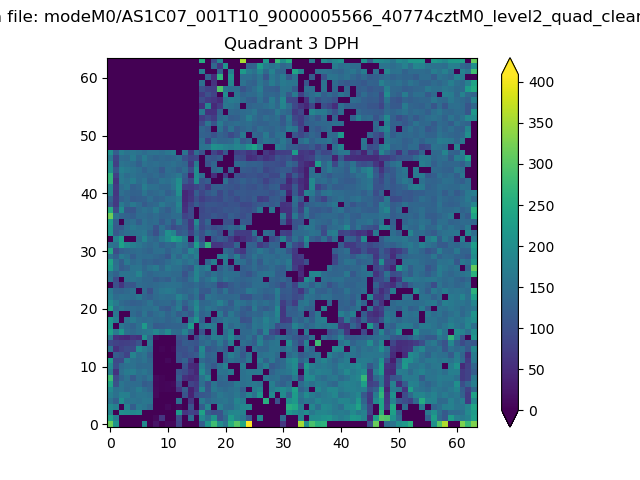 |
 |
Quadrant C |
| Plot type | Count rate plots | Images |
|---|---|---|
| Comparison with Poisson distribution Blue bars denote a histogram of data divided into 1 sec bins. Red curve is a Poisson curve with rate = median count rate of data. |
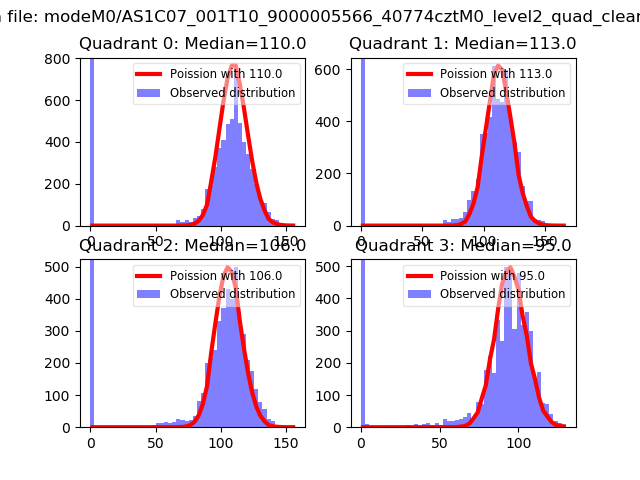 |
 |
| Quadrant-wise count rates Data is divided into 100 sec bins |
 |
|
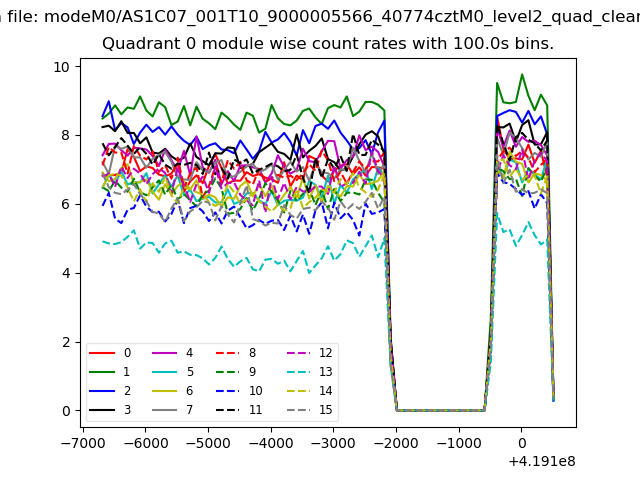
| Module-wise count rates for Quadrant A Data is divided into 100 sec bins |
 |
 |
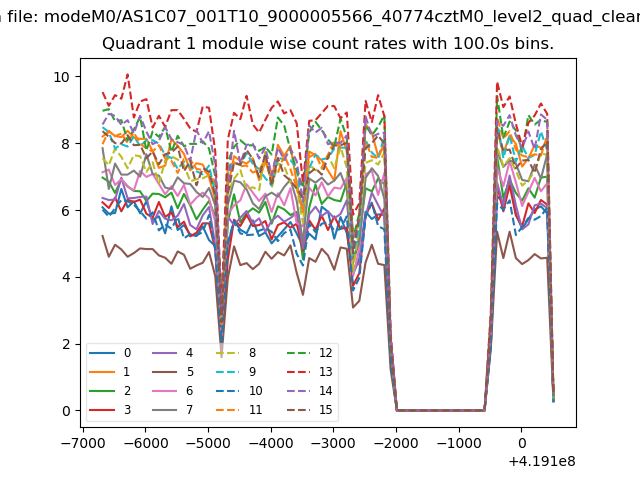
| Module-wise count rates for Quadrant B Data is divided into 100 sec bins |
 |
 |
| Module-wise count rates for Quadrant C Data is divided into 100 sec bins |
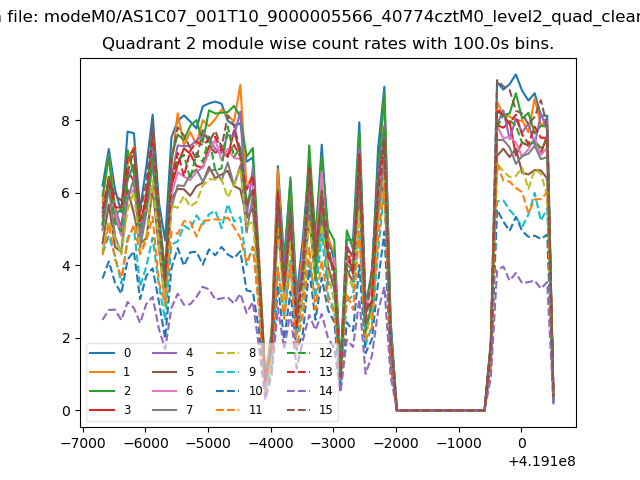 |
 |
| Module-wise count rates for Quadrant D Data is divided into 100 sec bins |
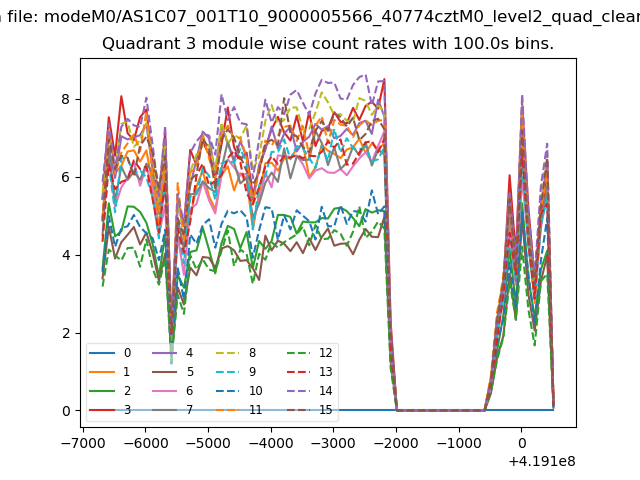 |
 |
| Parameter | Plot |
|---|---|
| CZT HV Monitor | 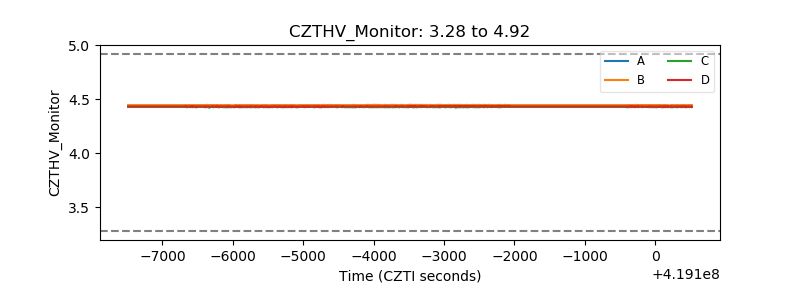 |
| D_VDD | 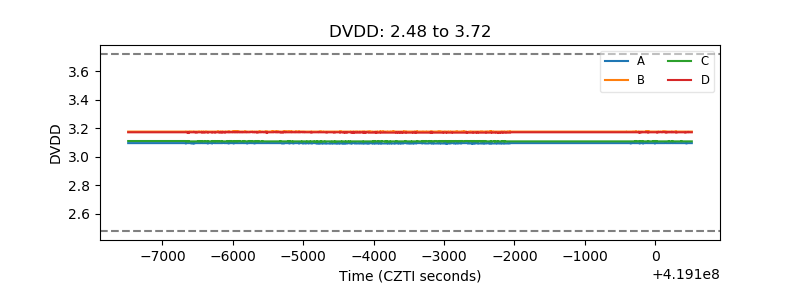 |
| Temperature 1 | 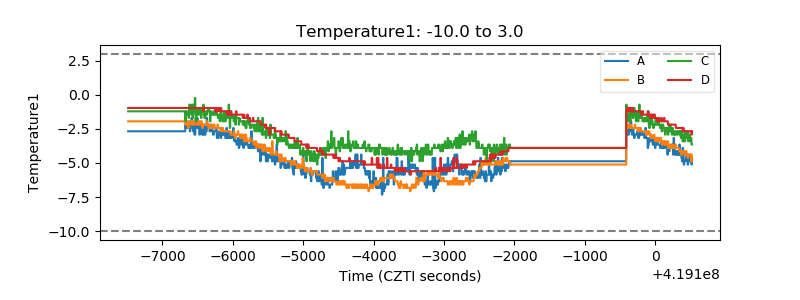 |
| Veto HV Monitor | 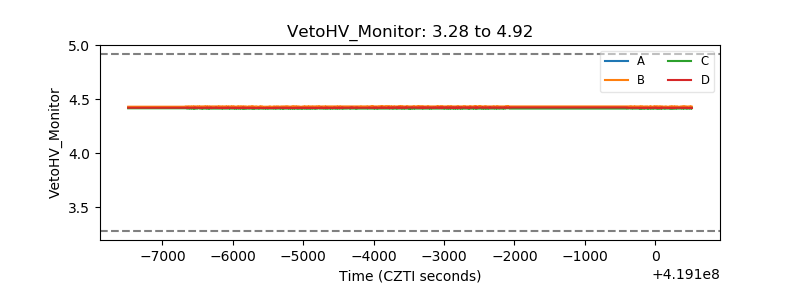 |
| Veto LLD | 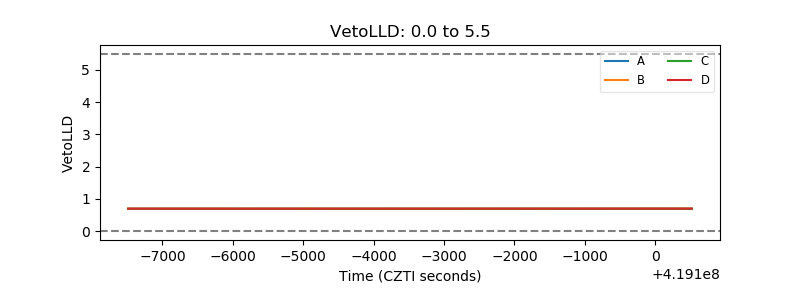 |
| Alpha Counter | 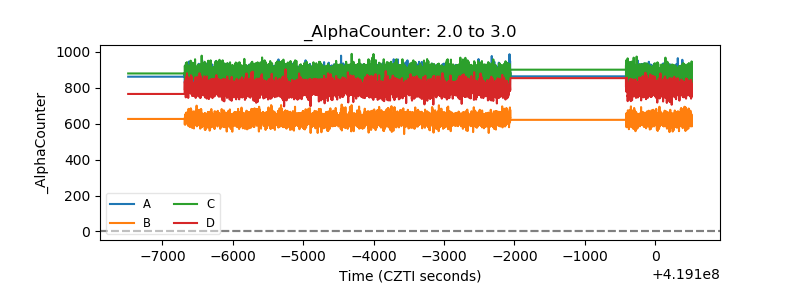 |
| _CPM_Rate | 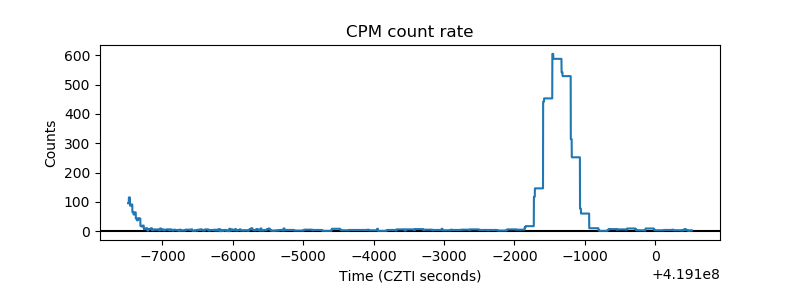 |
| CZT Counter | 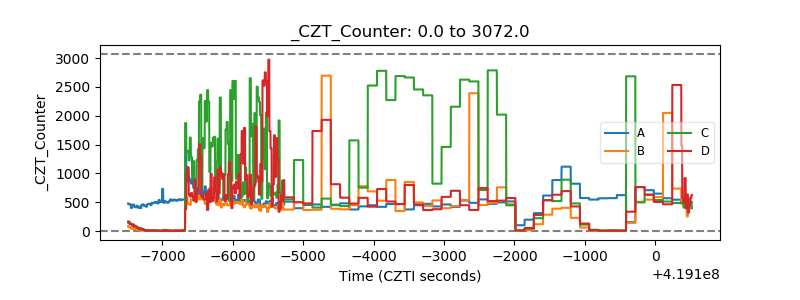 |
| +2.5 Volts monitor | 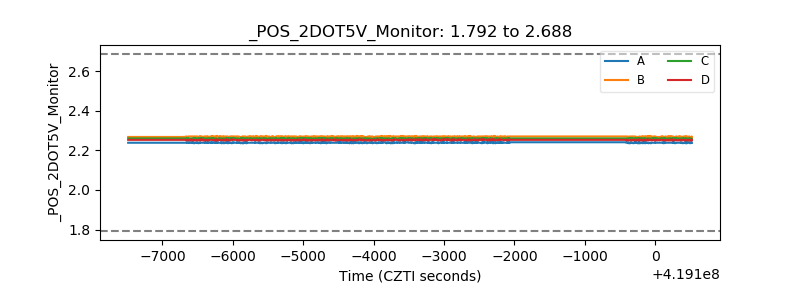 |
| +5 Volts monitor |  |
| _ROLL_ROT | 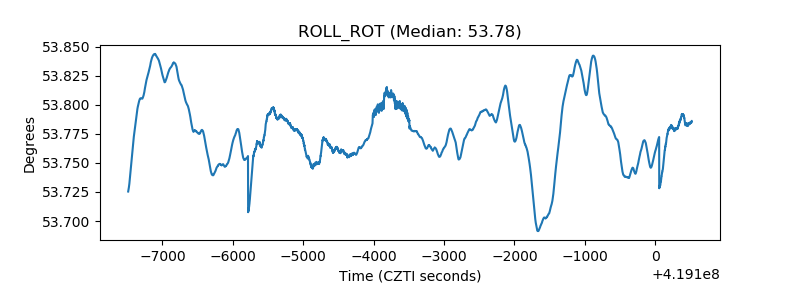 |
| _Roll_DEC | 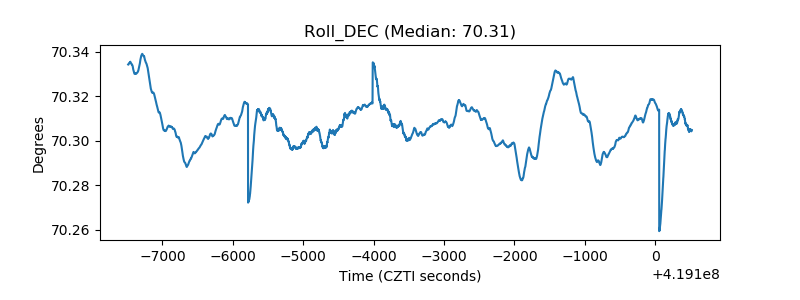 |
| _Roll_RA | 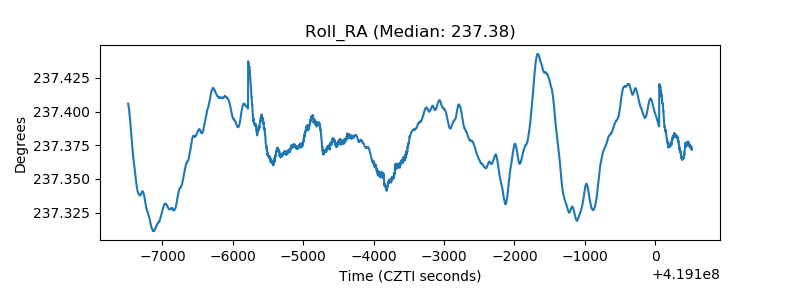 |
| Veto Counter | 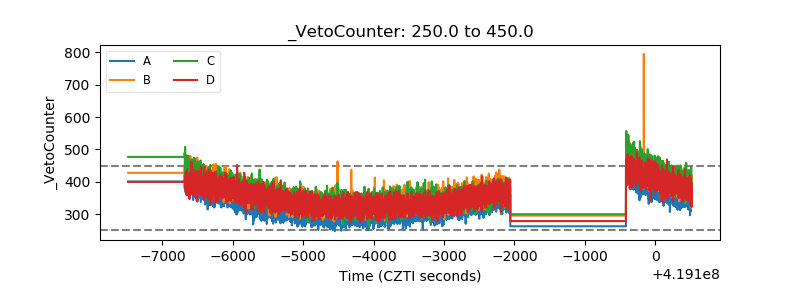 |