| Param | Original file | Final file |
|---|---|---|
| Filename | modeM0/AS1C07_001T10_9000005566_40776cztM0_level2.fits | modeM0/AS1C07_001T10_9000005566_40776cztM0_level2_quad_clean.evt |
| Size (bytes) | 397,051,200 | 87,024,960 |
| Size | 378.7 MB | 83.0 MB |
| Events in quadrant A | 2,874,506 | 608,493 |
| Events in quadrant B | 3,054,044 | 621,116 |
| Events in quadrant C | 4,914,194 | 548,124 |
| Events in quadrant D | 3,432,480 | 478,054 |
| Mode M9 | |||
|---|---|---|---|
| Quadrant | BADHDUFLAG | Total packets | Discarded packets |
| A | 0 | 28 | 0 |
| B | 0 | 28 | 0 |
| C | 0 | 28 | 0 |
| D | 0 | 29 | 0 |
| Mode M0 | |||
|---|---|---|---|
| Quadrant | BADHDUFLAG | Total packets | Discarded packets |
| A | 0 | 12044 | 3 |
| B | 0 | 12800 | 2 |
| C | 0 | 18130 | 2 |
| D | 0 | 14112 | 2 |
| Mode SS | |||
|---|---|---|---|
| Quadrant | BADHDUFLAG | Total packets | Discarded packets |
| A | 0 | 110 | 0 |
| B | 0 | 110 | 0 |
| C | 0 | 110 | 0 |
| D | 0 | 110 | 0 |
| Quadrant | Total seconds | Saturated seconds | Saturation percentage |
|---|---|---|---|
| A | 5417 | 19 | 0.350748% |
| B | 5417 | 128 | 2.362932% |
| C | 5417 | 662 | 12.220786% |
| D | 5417 | 888 | 16.392837% |
Noise dominated data is calculated using 1-second bins in cleaned event files. If a bin has >2000 counts, and if more than 50% of those come from <1% of pixels, then it is considered to be noise-dominated and hence unusable.
| Quadrant | # 1 sec bins | Bins with >0 counts | Bins with >2000 counts | High rate bins dominated by noise | Noise dominated (total time) | Noise dominated (detector-on time) | Marked lightcurve |
|---|---|---|---|---|---|---|---|
| A | 7150 | 5418 | 7 | 7 | 0.10% | 0.13% | 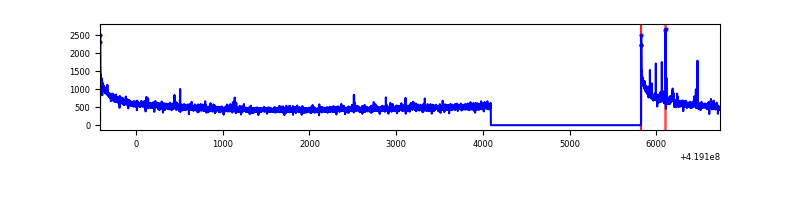 |
| B | 7150 | 5417 | 78 | 78 | 1.09% | 1.44% | 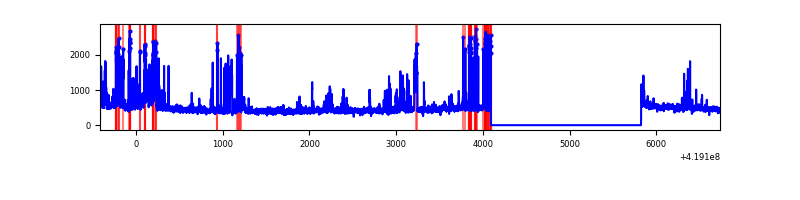 |
| C | 7150 | 5418 | 624 | 624 | 8.73% | 11.52% | 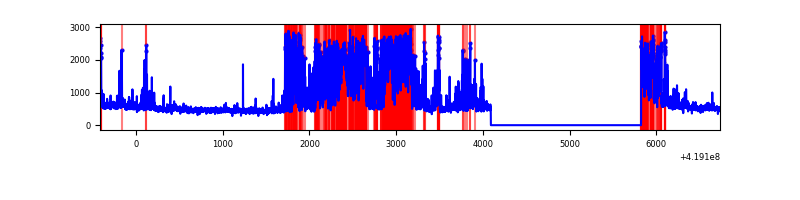 |
| D | 7150 | 5418 | 195 | 195 | 2.73% | 3.60% | 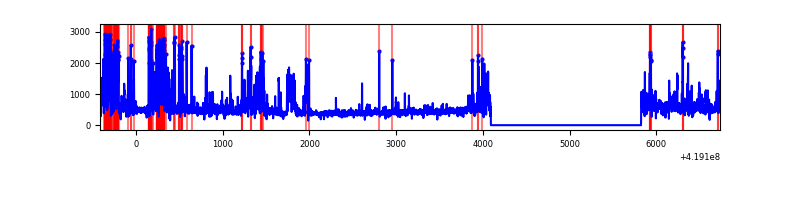 |
Top three noisy pixels from each quadrant. If the there are fewer than three noisy pixels in the level2.evt file, extra rows are filled as -1
| Pixel properties | Quadrant properties | ||||||
|---|---|---|---|---|---|---|---|
| Quadrant | DetID | PixID | Counts | Sigma | Mean | Median | Sigma |
| A | 10 | 83 | 510475 | 4211.14 | 592 | 580 | 121.1 |
| A | 12 | 189 | 40704 | 331.38 | 592 | 580 | 121.1 |
| A | 2 | 79 | 19560 | 156.75 | 592 | 580 | 121.1 |
| B | 0 | 229 | 384304 | 3359.33 | 589 | 572 | 114.2 |
| B | 5 | 255 | 137810 | 1201.43 | 589 | 572 | 114.2 |
| B | 7 | 202 | 124926 | 1088.64 | 589 | 572 | 114.2 |
| C | 9 | 187 | 2399409 | 18372.55 | 564 | 568 | 130.6 |
| C | 15 | 214 | 222624 | 1700.71 | 564 | 568 | 130.6 |
| C | 0 | 10 | 67732 | 514.4 | 564 | 568 | 130.6 |
| D | 12 | 227 | 782615 | 5954.27 | 533 | 519 | 131.4 |
| D | 12 | 191 | 180391 | 1369.4 | 533 | 519 | 131.4 |
| D | 2 | 153 | 169012 | 1282.77 | 533 | 519 | 131.4 |
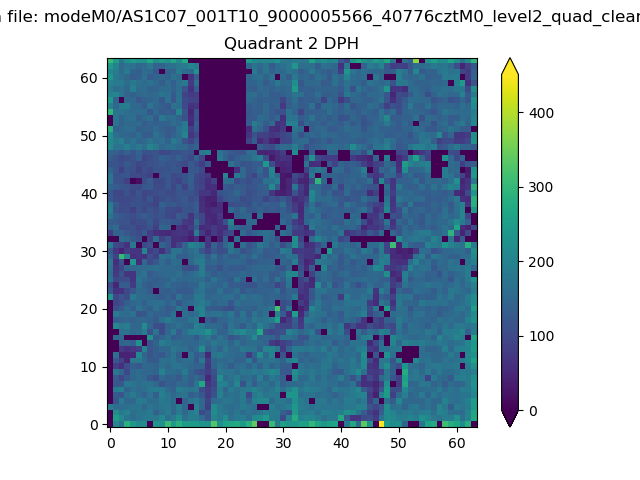
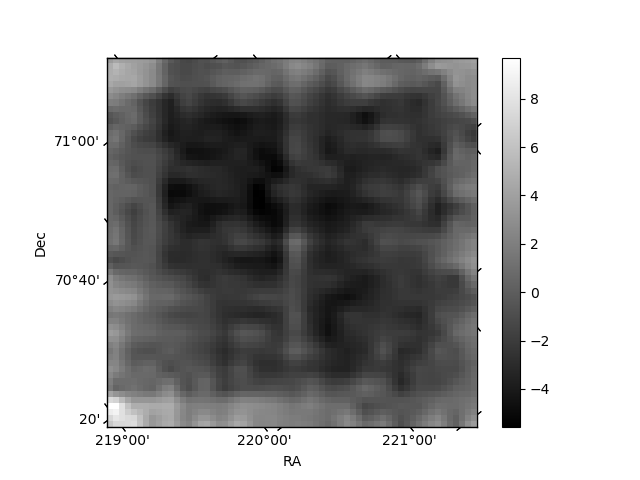
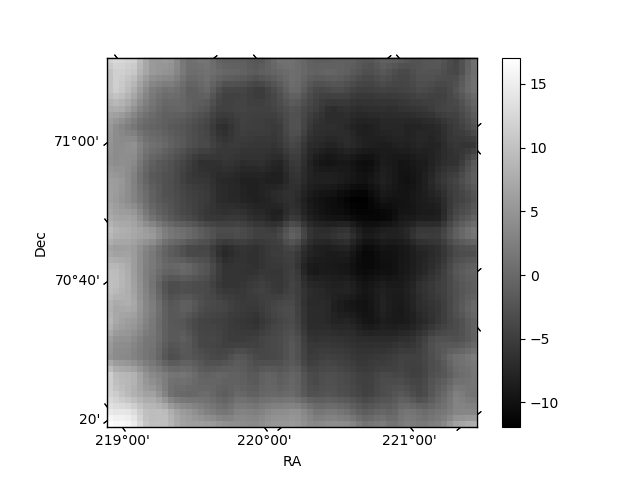
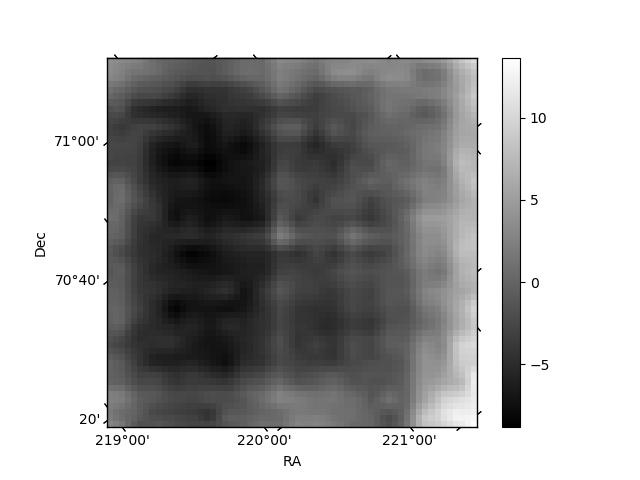
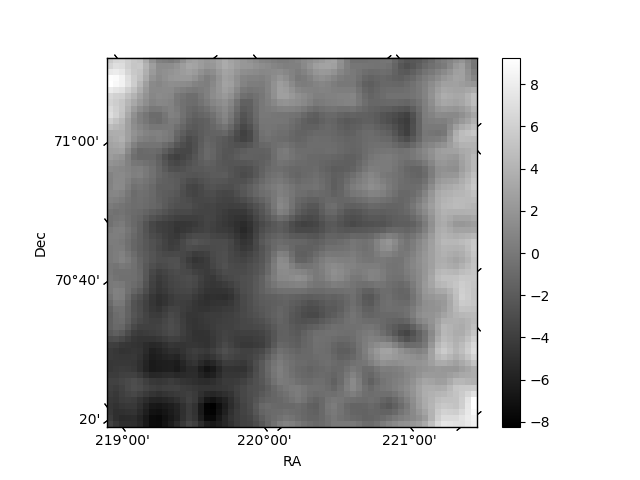
Histogram calculated using DETX and DETY for each event in the final _common_clean file
| Quadrant A | 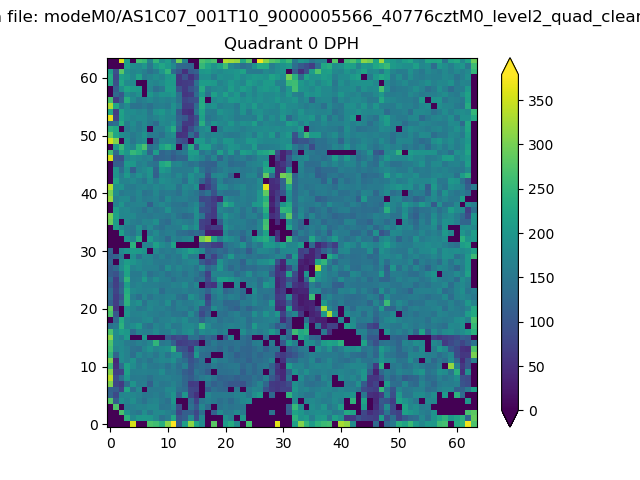 |
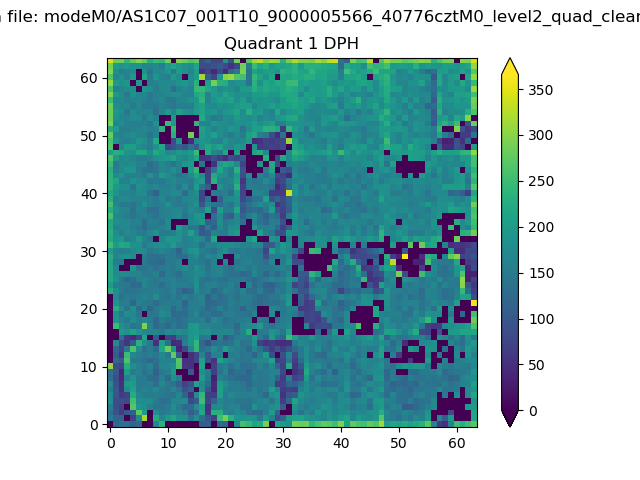 |
Quadrant B |
|---|---|---|---|
| Quadrant D | 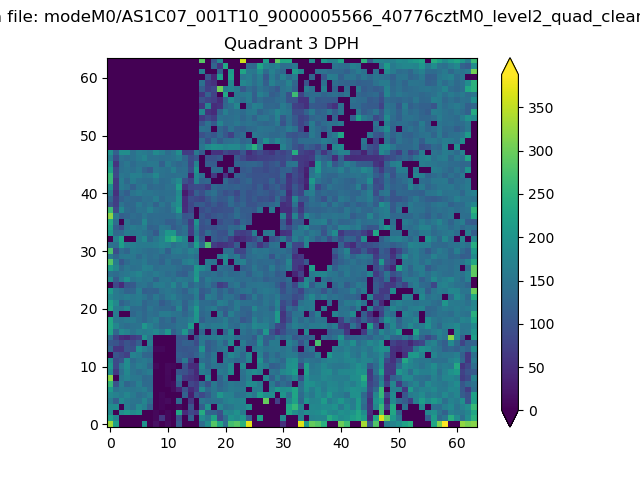 |
 |
Quadrant C |
| Plot type | Count rate plots | Images |
|---|---|---|
| Comparison with Poisson distribution Blue bars denote a histogram of data divided into 1 sec bins. Red curve is a Poisson curve with rate = median count rate of data. |
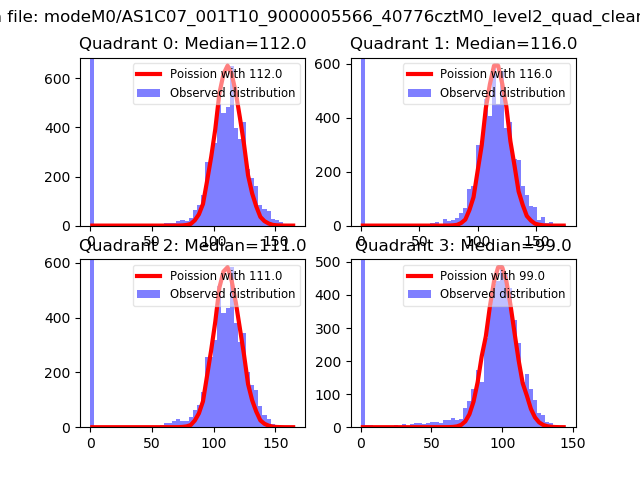 |
 |
| Quadrant-wise count rates Data is divided into 100 sec bins |
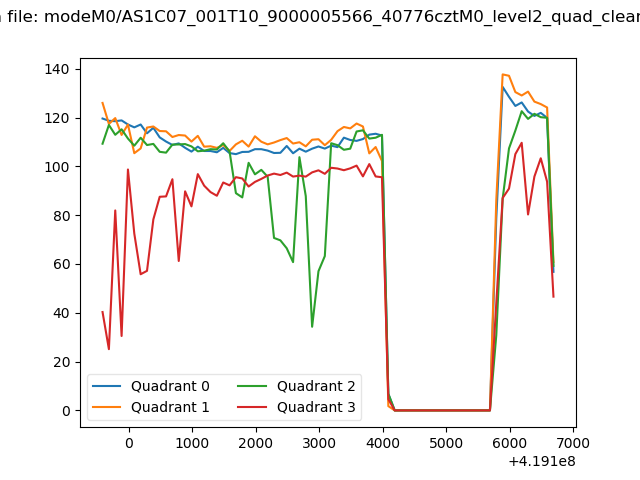 |
|
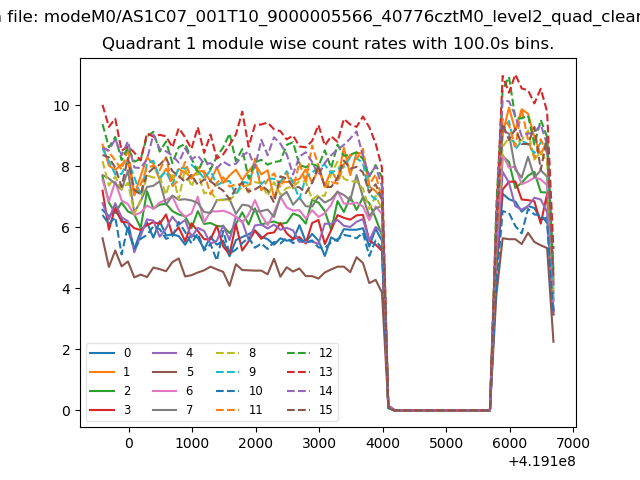
| Module-wise count rates for Quadrant A Data is divided into 100 sec bins |
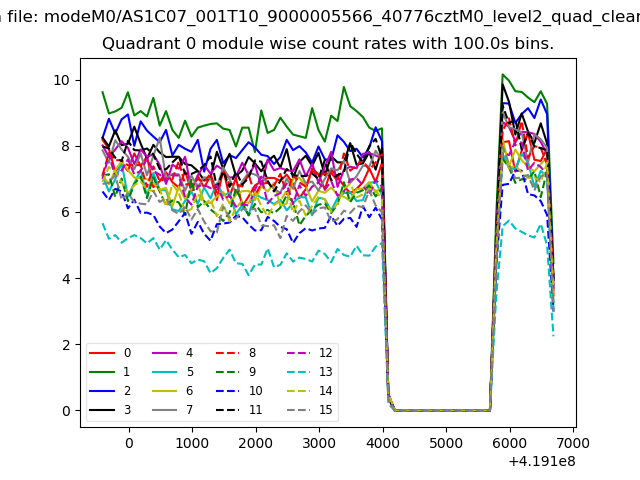 |
 |
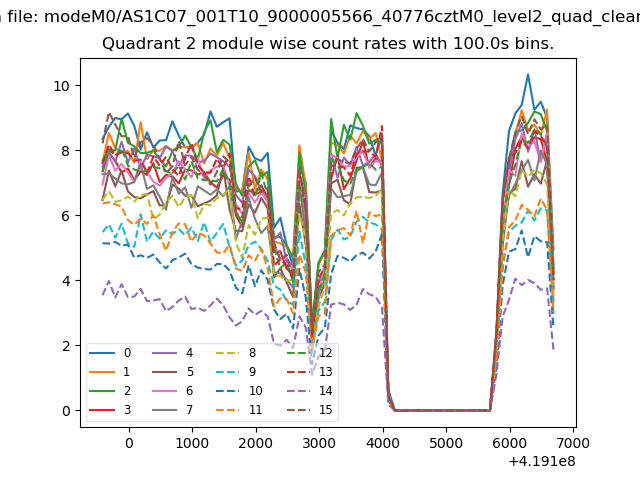
| Module-wise count rates for Quadrant B Data is divided into 100 sec bins |
 |
 |
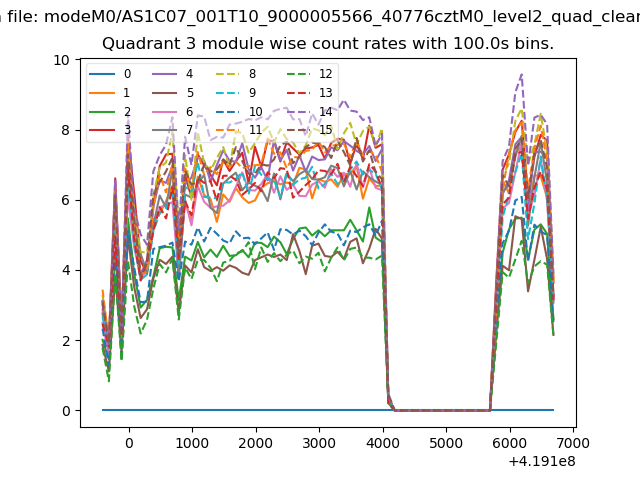
| Module-wise count rates for Quadrant C Data is divided into 100 sec bins |
 |
 |
| Module-wise count rates for Quadrant D Data is divided into 100 sec bins |
 |
 |
| Parameter | Plot |
|---|---|
| CZT HV Monitor | 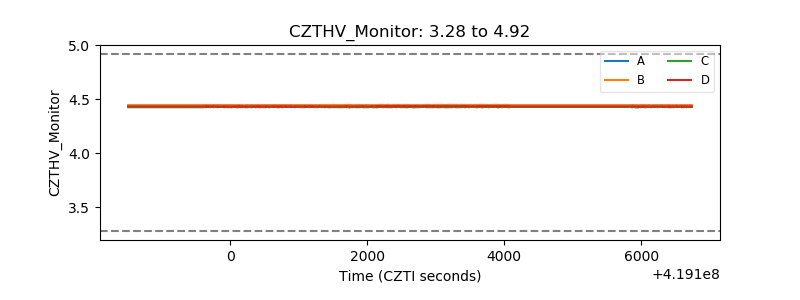 |
| D_VDD | 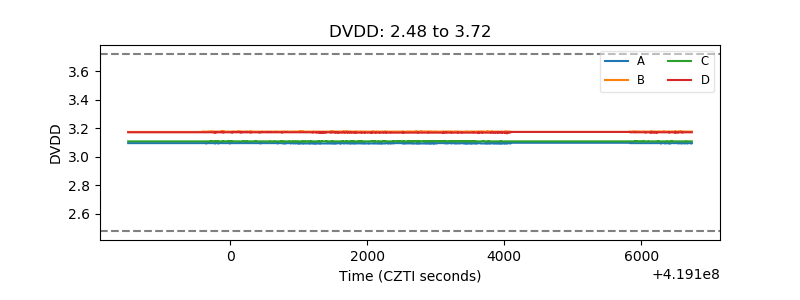 |
| Temperature 1 | 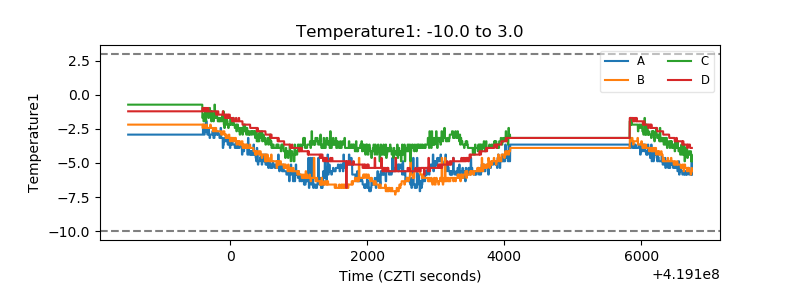 |
| Veto HV Monitor |  |
| Veto LLD | 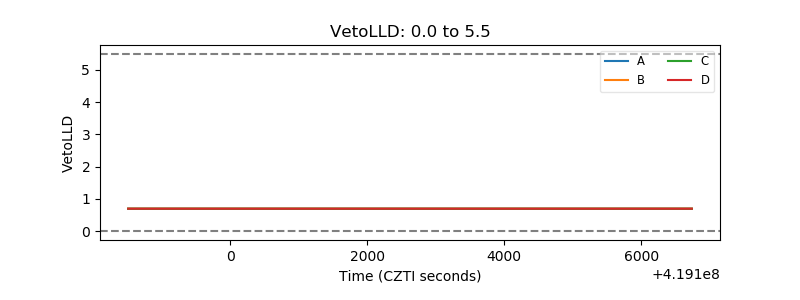 |
| Alpha Counter | 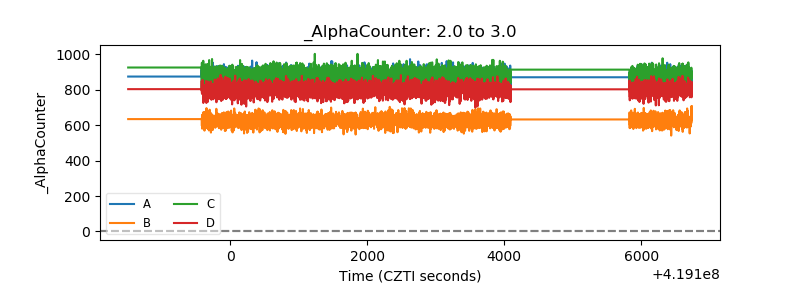 |
| _CPM_Rate | 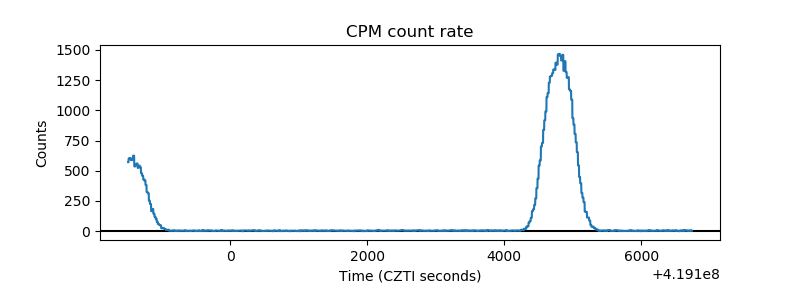 |
| CZT Counter | 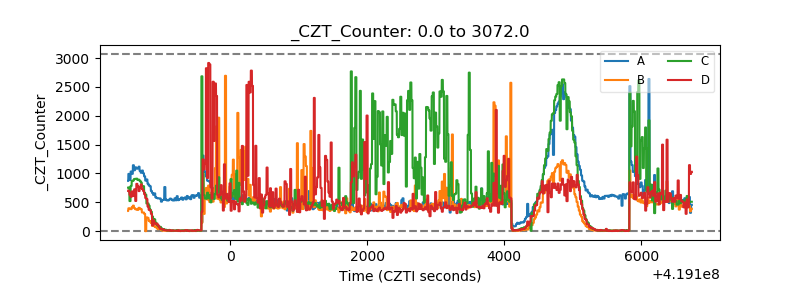 |
| +2.5 Volts monitor | 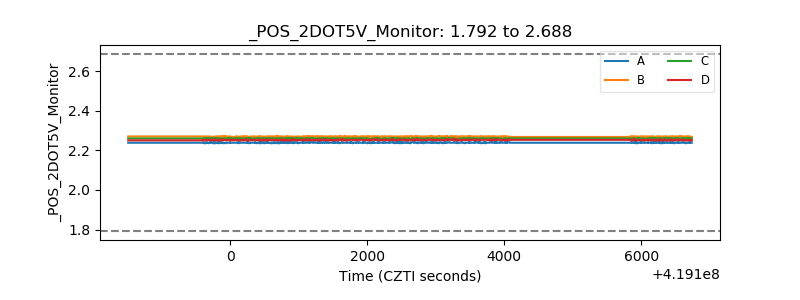 |
| +5 Volts monitor | 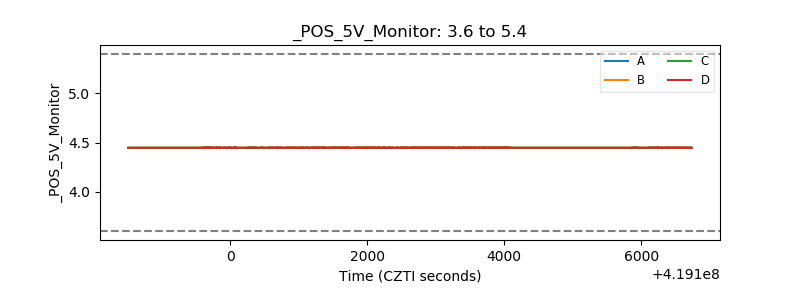 |
| _ROLL_ROT | 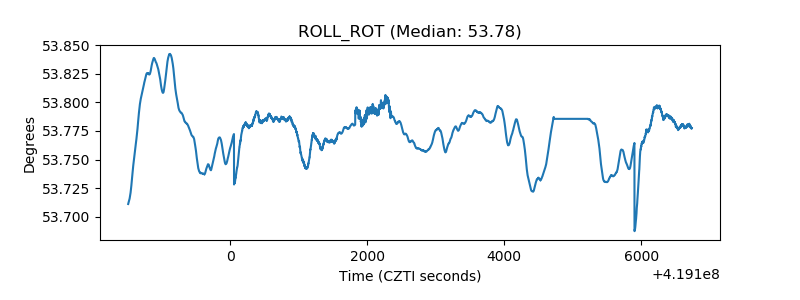 |
| _Roll_DEC | 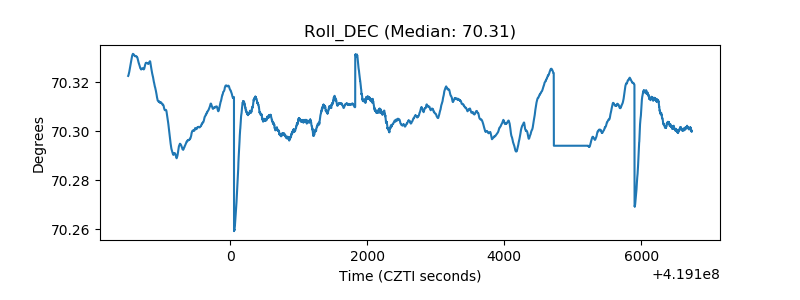 |
| _Roll_RA |  |
| Veto Counter |  |