| Param | Original file | Final file |
|---|---|---|
| Filename | modeM0/AS1C07_001T10_9000005566_40777cztM0_level2.fits | modeM0/AS1C07_001T10_9000005566_40777cztM0_level2_quad_clean.evt |
| Size (bytes) | 79,917,120 | 18,662,400 |
| Size | 76.2 MB | 17.8 MB |
| Events in quadrant A | 705,635 | 131,041 |
| Events in quadrant B | 560,522 | 137,033 |
| Events in quadrant C | 900,414 | 117,869 |
| Events in quadrant D | 706,172 | 98,654 |
| Mode M9 | |||
|---|---|---|---|
| Quadrant | BADHDUFLAG | Total packets | Discarded packets |
| A | 0 | 5 | 0 |
| B | 0 | 5 | 0 |
| C | 0 | 5 | 0 |
| D | 0 | 6 | 0 |
| Mode M0 | |||
|---|---|---|---|
| Quadrant | BADHDUFLAG | Total packets | Discarded packets |
| A | 0 | 2778 | 1 |
| B | 0 | 2298 | 1 |
| C | 0 | 3327 | 1 |
| D | 0 | 2807 | 1 |
| Mode SS | |||
|---|---|---|---|
| Quadrant | BADHDUFLAG | Total packets | Discarded packets |
| A | 0 | 20 | 0 |
| B | 0 | 20 | 0 |
| C | 0 | 20 | 0 |
| D | 0 | 20 | 0 |
| Quadrant | Total seconds | Saturated seconds | Saturation percentage |
|---|---|---|---|
| A | 1058 | 8 | 0.756144% |
| B | 1058 | 5 | 0.472590% |
| C | 1058 | 114 | 10.775047% |
| D | 1058 | 211 | 19.943289% |
Noise dominated data is calculated using 1-second bins in cleaned event files. If a bin has >2000 counts, and if more than 50% of those come from <1% of pixels, then it is considered to be noise-dominated and hence unusable.
| Quadrant | # 1 sec bins | Bins with >0 counts | Bins with >2000 counts | High rate bins dominated by noise | Noise dominated (total time) | Noise dominated (detector-on time) | Marked lightcurve |
|---|---|---|---|---|---|---|---|
| A | 1058 | 1058 | 5 | 5 | 0.47% | 0.47% | 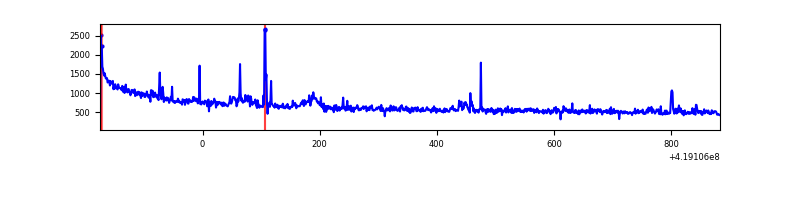 |
| B | 1058 | 1058 | 2 | 2 | 0.19% | 0.19% | 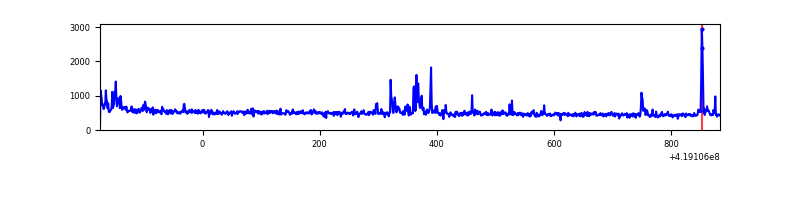 |
| C | 1058 | 1058 | 90 | 90 | 8.51% | 8.51% | 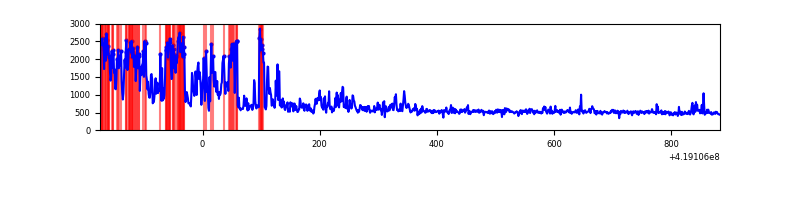 |
| D | 1058 | 1058 | 15 | 15 | 1.42% | 1.42% | 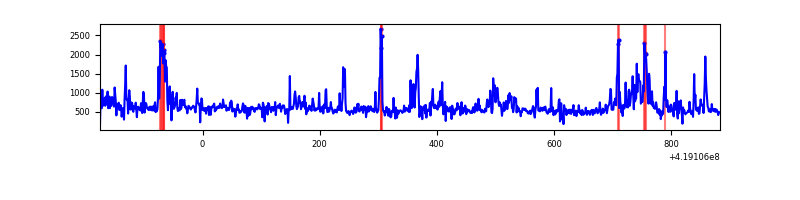 |
Top three noisy pixels from each quadrant. If the there are fewer than three noisy pixels in the level2.evt file, extra rows are filled as -1
| Pixel properties | Quadrant properties | ||||||
|---|---|---|---|---|---|---|---|
| Quadrant | DetID | PixID | Counts | Sigma | Mean | Median | Sigma |
| A | 10 | 83 | 163056 | 5755.62 | 127 | 124 | 28.3 |
| A | 12 | 189 | 27478 | 966.29 | 127 | 124 | 28.3 |
| A | 2 | 79 | 19415 | 681.46 | 127 | 124 | 28.3 |
| B | 0 | 190 | 27464 | 1031.97 | 128 | 124 | 26.5 |
| B | 5 | 255 | 11369 | 424.45 | 128 | 124 | 26.5 |
| B | 0 | 229 | 6302 | 233.19 | 128 | 124 | 26.5 |
| C | 9 | 187 | 315625 | 10208.93 | 124 | 125 | 30.9 |
| C | 0 | 10 | 49999 | 1613.82 | 124 | 125 | 30.9 |
| C | 15 | 214 | 47681 | 1538.81 | 124 | 125 | 30.9 |
| D | 12 | 227 | 88244 | 2879.25 | 117 | 113 | 30.6 |
| D | 2 | 249 | 48788 | 1590.22 | 117 | 113 | 30.6 |
| D | 12 | 191 | 43361 | 1412.92 | 117 | 113 | 30.6 |
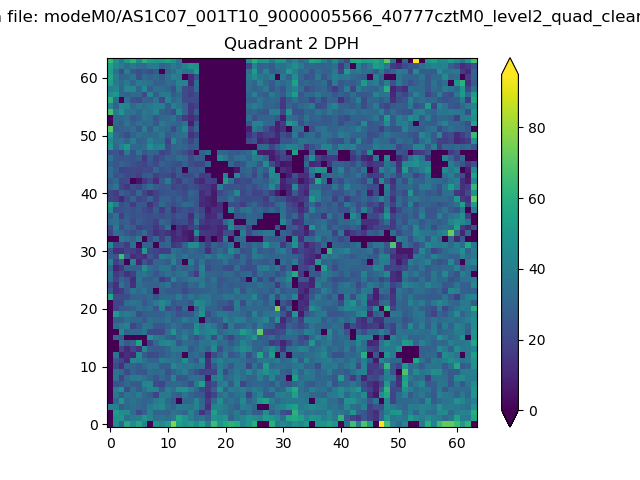
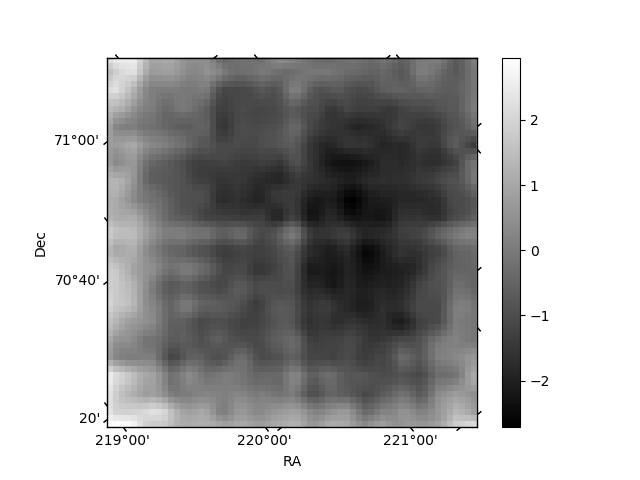
Histogram calculated using DETX and DETY for each event in the final _common_clean file
| Quadrant A | 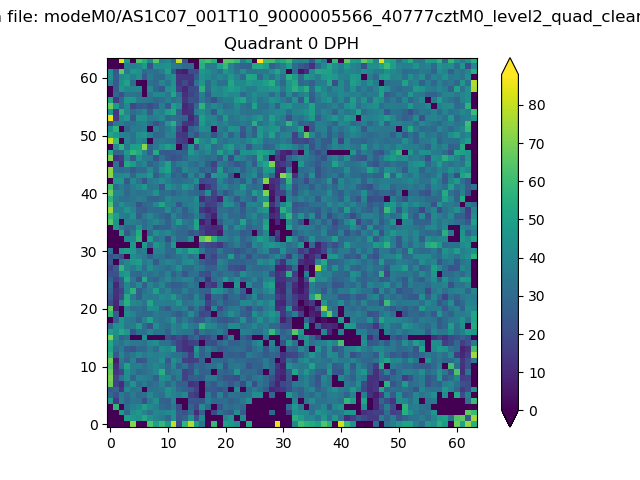 |
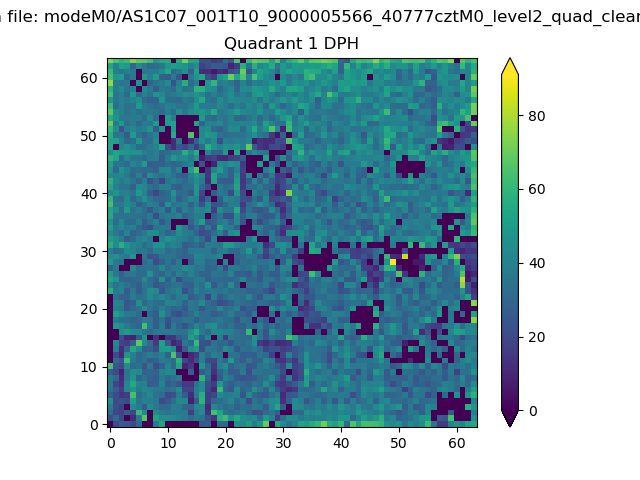 |
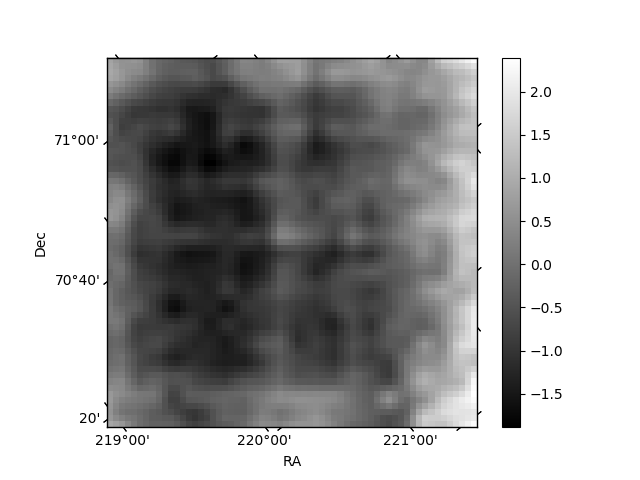
Quadrant B |
|---|---|---|---|
| Quadrant D | 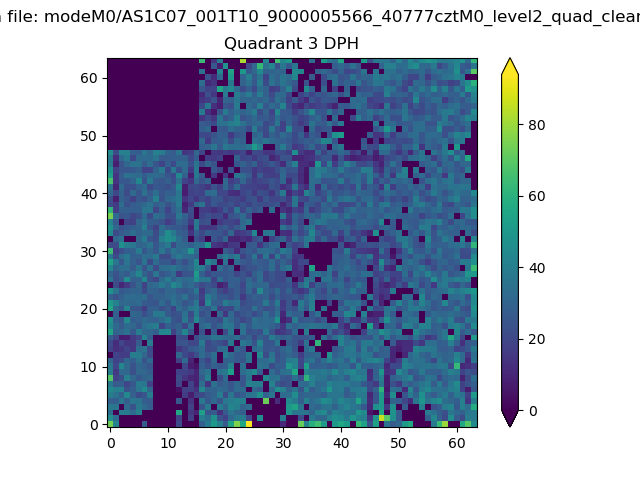 |
 |
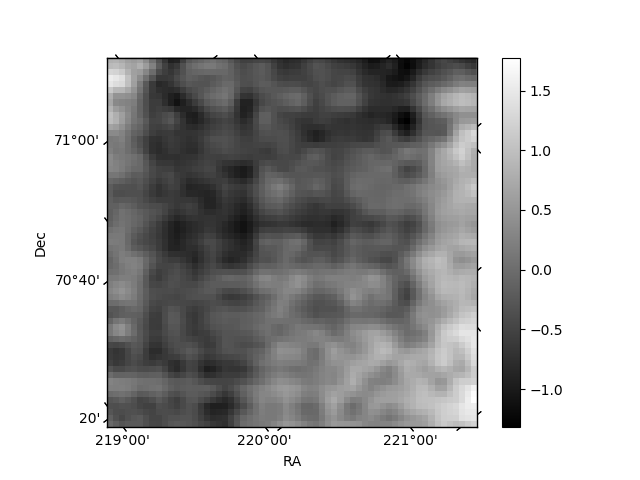
Quadrant C |
| Plot type | Count rate plots | Images |
|---|---|---|
| Comparison with Poisson distribution Blue bars denote a histogram of data divided into 1 sec bins. Red curve is a Poisson curve with rate = median count rate of data. |
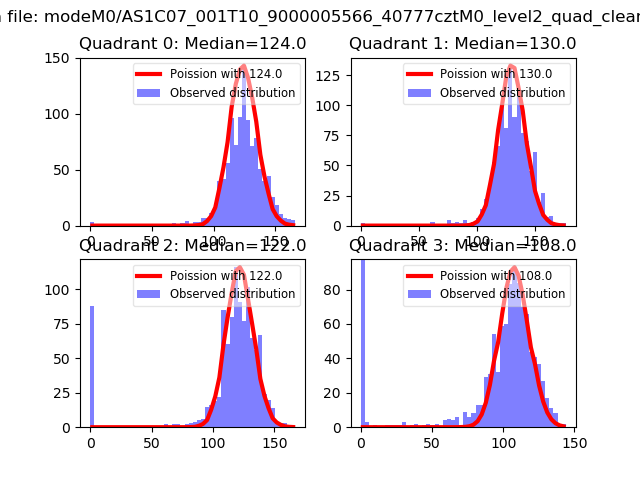 |
 |
| Quadrant-wise count rates Data is divided into 100 sec bins |
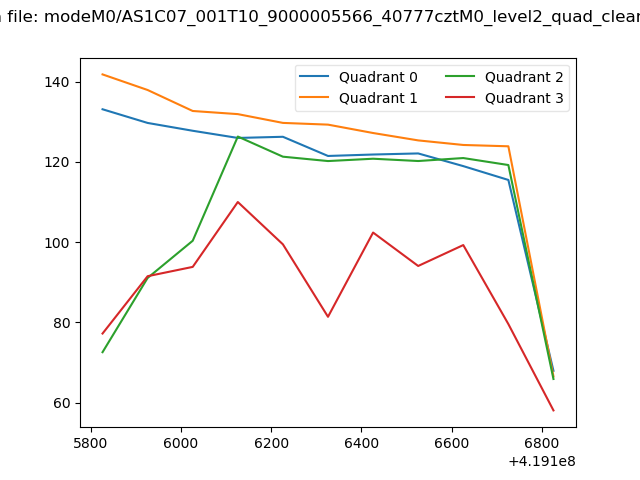 |
|
| Module-wise count rates for Quadrant A Data is divided into 100 sec bins |
 |
 |
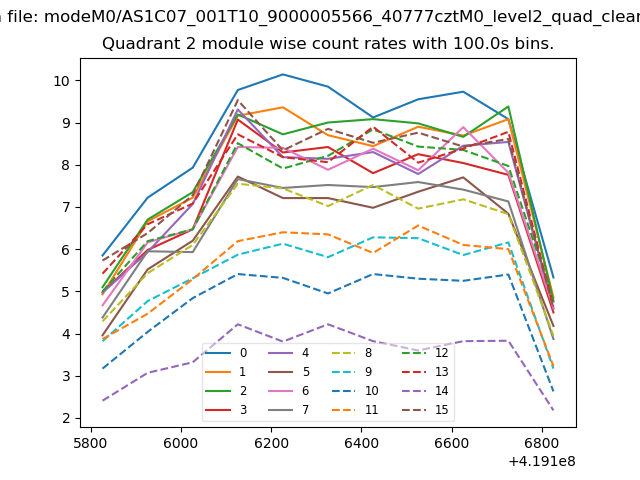
| Module-wise count rates for Quadrant B Data is divided into 100 sec bins |
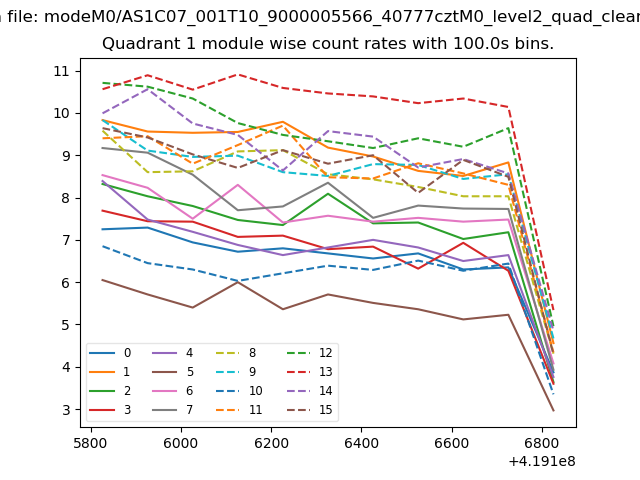 |
 |
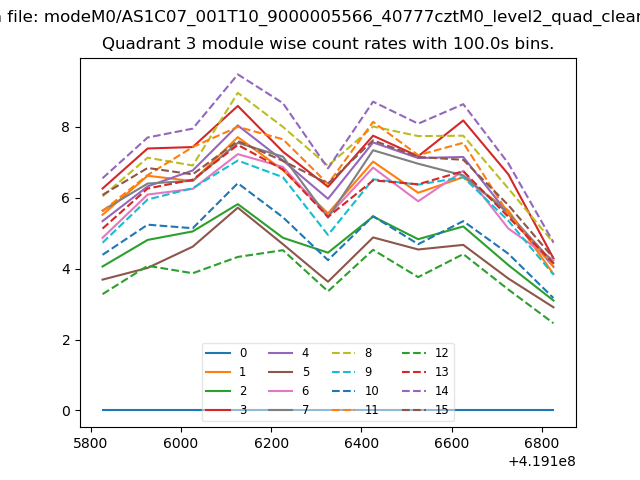
| Module-wise count rates for Quadrant C Data is divided into 100 sec bins |
 |
 |
| Module-wise count rates for Quadrant D Data is divided into 100 sec bins |
 |
 |
| Parameter | Plot |
|---|---|
| CZT HV Monitor | 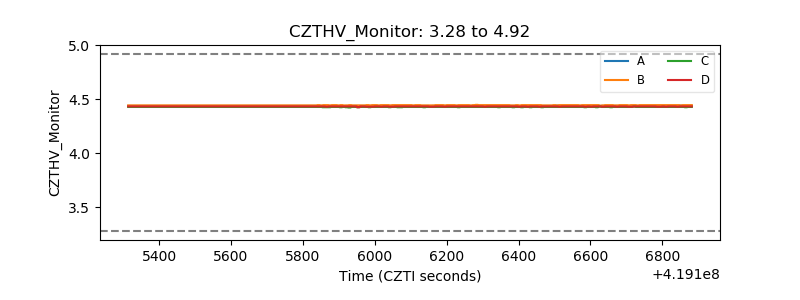 |
| D_VDD | 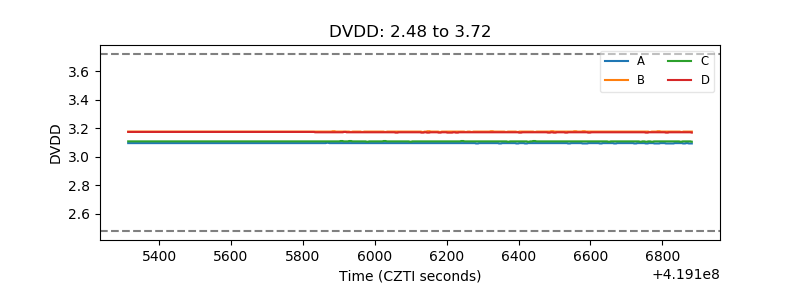 |
| Temperature 1 | 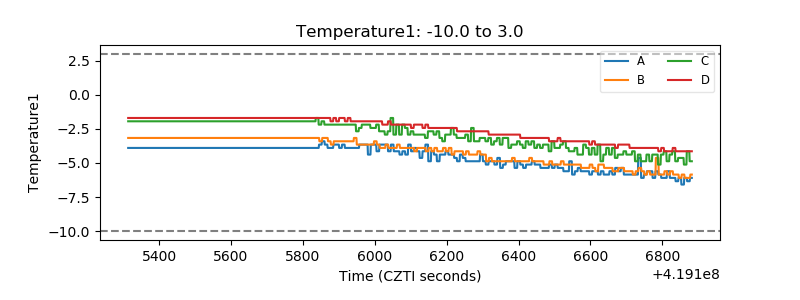 |
| Veto HV Monitor | 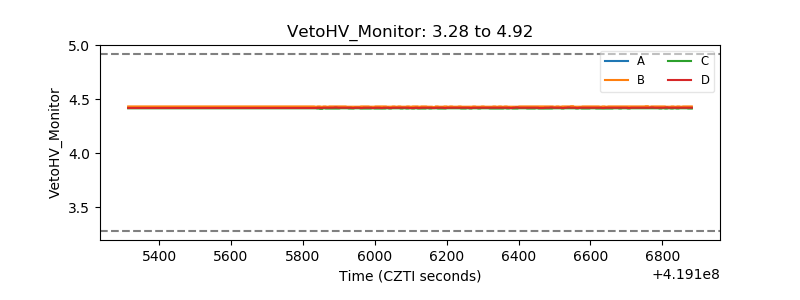 |
| Veto LLD | 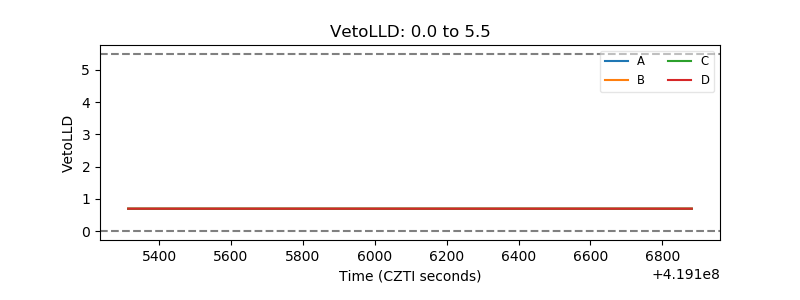 |
| Alpha Counter | 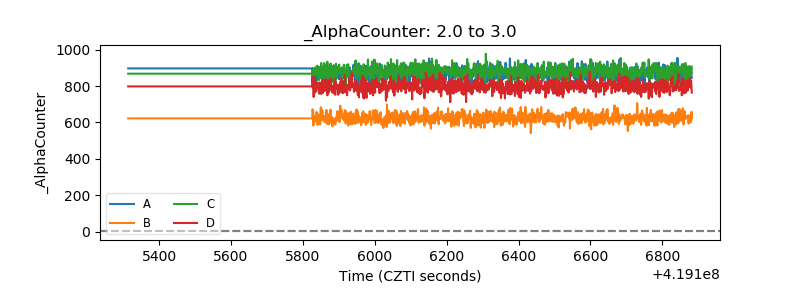 |
| _CPM_Rate | 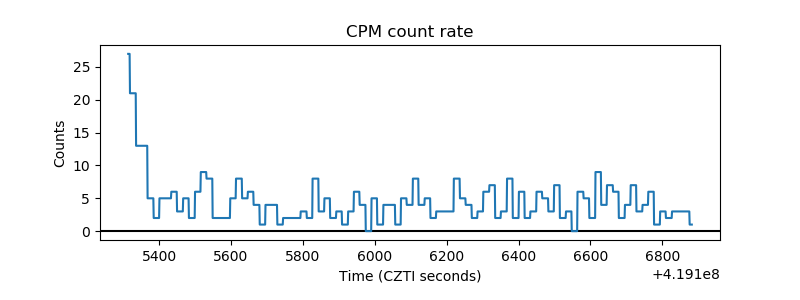 |
| CZT Counter | 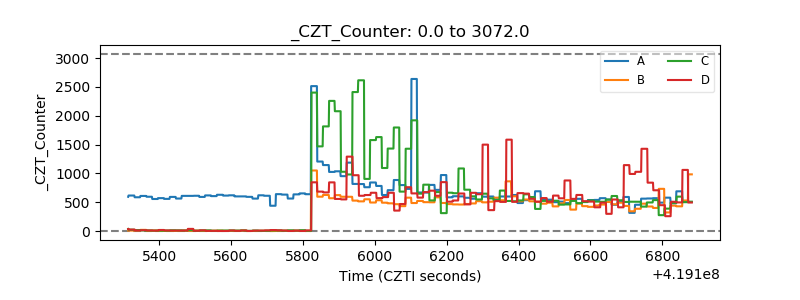 |
| +2.5 Volts monitor | 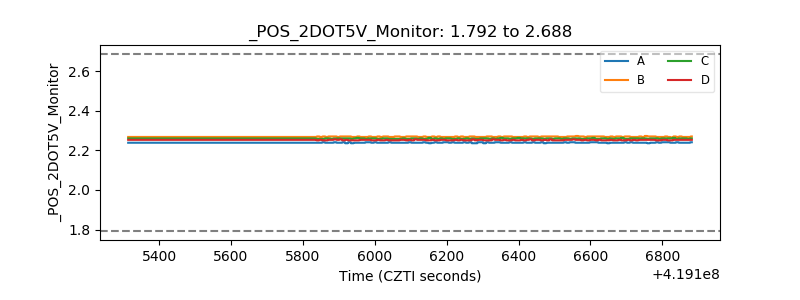 |
| +5 Volts monitor | 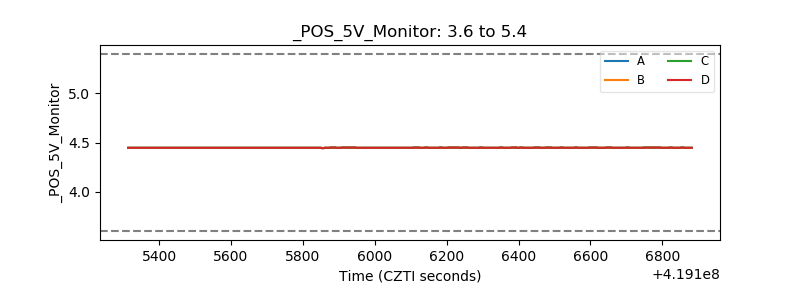 |
| _ROLL_ROT | 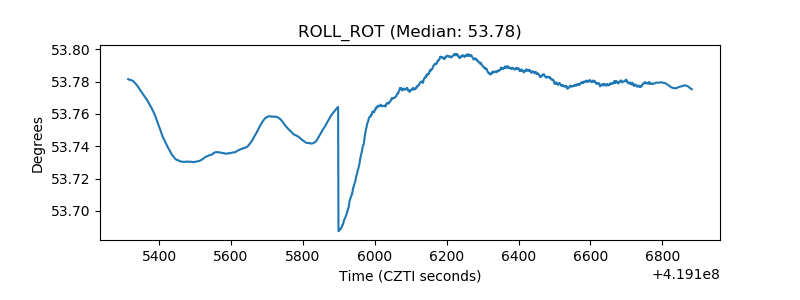 |
| _Roll_DEC | 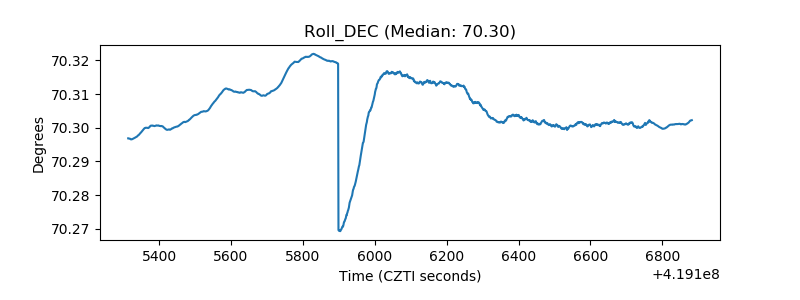 |
| _Roll_RA |  |
| Veto Counter | 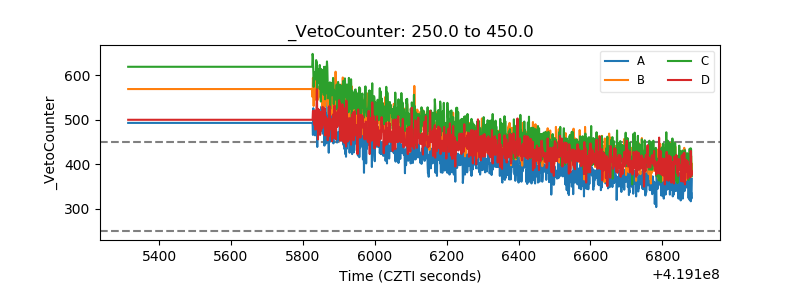 |