| Param | Original file | Final file |
|---|---|---|
| Filename | modeM0/AS1A12_095T02_9000005568_40777cztM0_level2.fits | modeM0/AS1A12_095T02_9000005568_40777cztM0_level2_quad_clean.evt |
| Size (bytes) | 245,531,520 | 54,829,440 |
| Size | 234.2 MB | 52.3 MB |
| Events in quadrant A | 1,790,161 | 379,188 |
| Events in quadrant B | 1,833,172 | 390,954 |
| Events in quadrant C | 2,795,240 | 352,515 |
| Events in quadrant D | 2,413,656 | 304,418 |
| Mode M9 | |||
|---|---|---|---|
| Quadrant | BADHDUFLAG | Total packets | Discarded packets |
| A | 0 | 18 | 0 |
| B | 0 | 18 | 0 |
| C | 0 | 18 | 0 |
| D | 0 | 18 | 0 |
| Mode SS | |||
|---|---|---|---|
| Quadrant | BADHDUFLAG | Total packets | Discarded packets |
| A | 0 | 68 | 0 |
| B | 0 | 68 | 0 |
| C | 0 | 68 | 0 |
| D | 0 | 68 | 0 |
| Mode M0 | |||
|---|---|---|---|
| Quadrant | BADHDUFLAG | Total packets | Discarded packets |
| A | 0 | 7377 | 2 |
| B | 0 | 7519 | 1 |
| C | 0 | 10313 | 1 |
| D | 0 | 9408 | 1 |
| Quadrant | Total seconds | Saturated seconds | Saturation percentage |
|---|---|---|---|
| A | 3277 | 6 | 0.183094% |
| B | 3277 | 65 | 1.983522% |
| C | 3277 | 300 | 9.154715% |
| D | 3277 | 466 | 14.220323% |
Noise dominated data is calculated using 1-second bins in cleaned event files. If a bin has >2000 counts, and if more than 50% of those come from <1% of pixels, then it is considered to be noise-dominated and hence unusable.
| Quadrant | # 1 sec bins | Bins with >0 counts | Bins with >2000 counts | High rate bins dominated by noise | Noise dominated (total time) | Noise dominated (detector-on time) | Marked lightcurve |
|---|---|---|---|---|---|---|---|
| A | 5160 | 3278 | 4 | 4 | 0.08% | 0.12% | 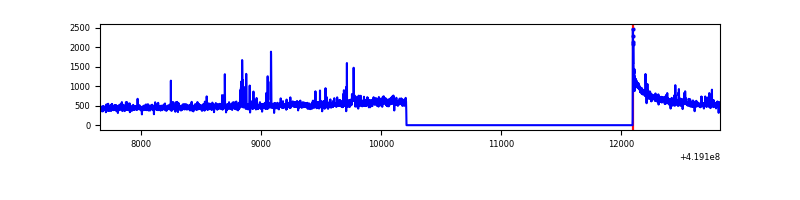 |
| B | 5160 | 3278 | 42 | 42 | 0.81% | 1.28% | 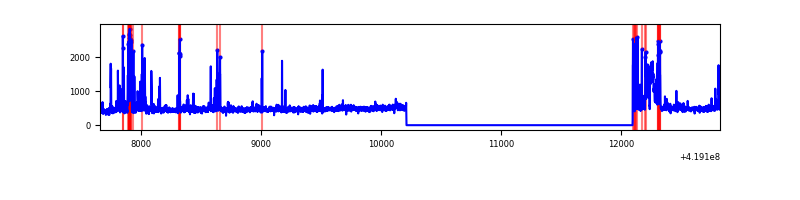 |
| C | 5160 | 3278 | 314 | 314 | 6.09% | 9.58% | 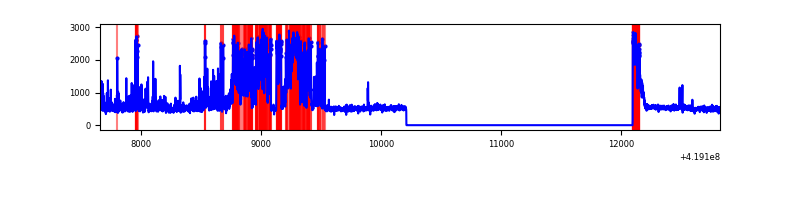 |
| D | 5159 | 3277 | 123 | 123 | 2.38% | 3.75% | 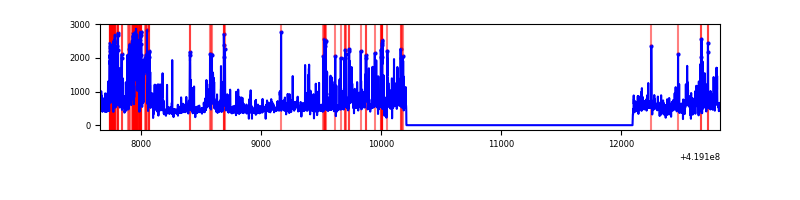 |
Top three noisy pixels from each quadrant. If the there are fewer than three noisy pixels in the level2.evt file, extra rows are filled as -1
| Pixel properties | Quadrant properties | ||||||
|---|---|---|---|---|---|---|---|
| Quadrant | DetID | PixID | Counts | Sigma | Mean | Median | Sigma |
| A | 10 | 83 | 272260 | 3517.99 | 369 | 361 | 77.3 |
| A | 2 | 79 | 42771 | 548.73 | 369 | 361 | 77.3 |
| A | 12 | 189 | 28618 | 365.61 | 369 | 361 | 77.3 |
| B | 5 | 255 | 150931 | 2052.17 | 371 | 359 | 73.4 |
| B | 0 | 229 | 144148 | 1959.72 | 371 | 359 | 73.4 |
| B | 0 | 190 | 25502 | 342.68 | 371 | 359 | 73.4 |
| C | 9 | 187 | 1124599 | 13429.19 | 355 | 357 | 83.7 |
| C | 0 | 10 | 137198 | 1634.58 | 355 | 357 | 83.7 |
| C | 15 | 214 | 136143 | 1621.98 | 355 | 357 | 83.7 |
| D | 12 | 227 | 641379 | 7607.99 | 336 | 326 | 84.3 |
| D | 1 | 47 | 180411 | 2137.24 | 336 | 326 | 84.3 |
| D | 12 | 191 | 103580 | 1225.41 | 336 | 326 | 84.3 |
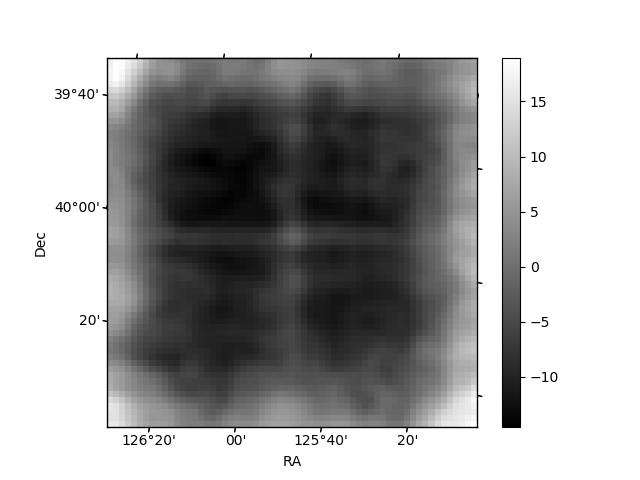
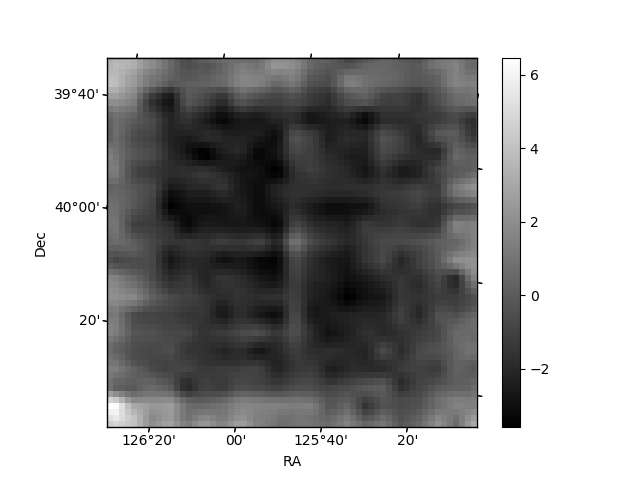
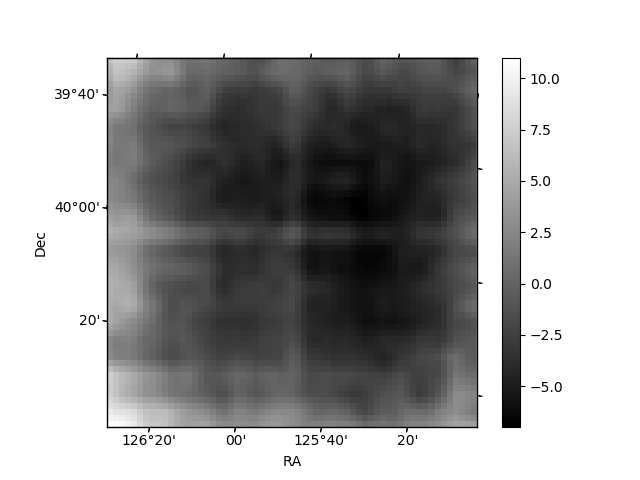
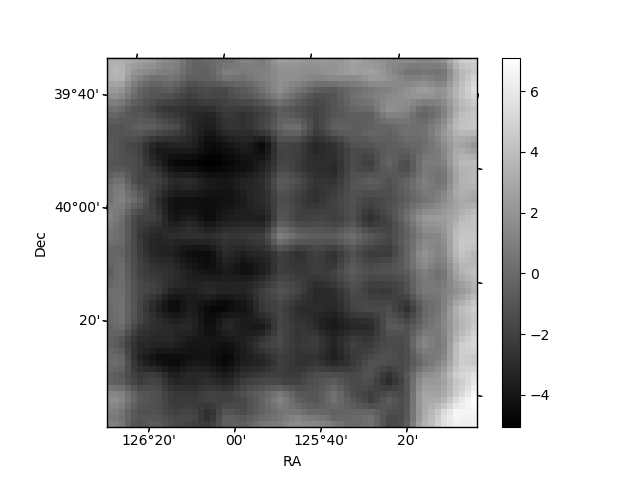
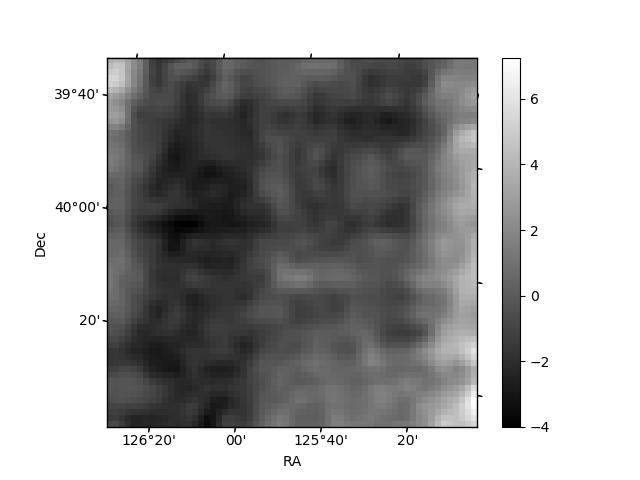
Histogram calculated using DETX and DETY for each event in the final _common_clean file
| Quadrant A | 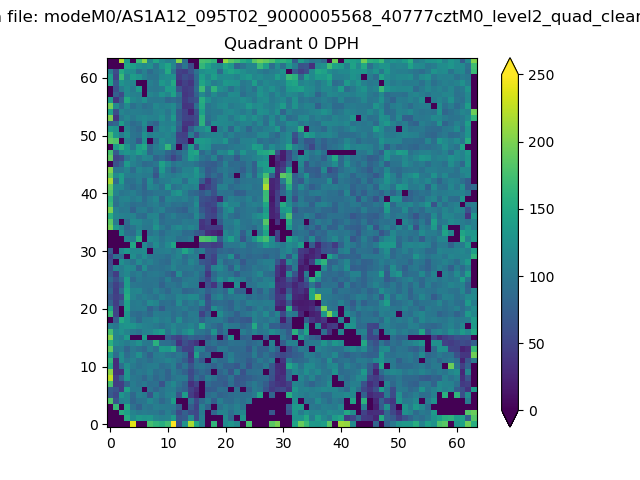 |
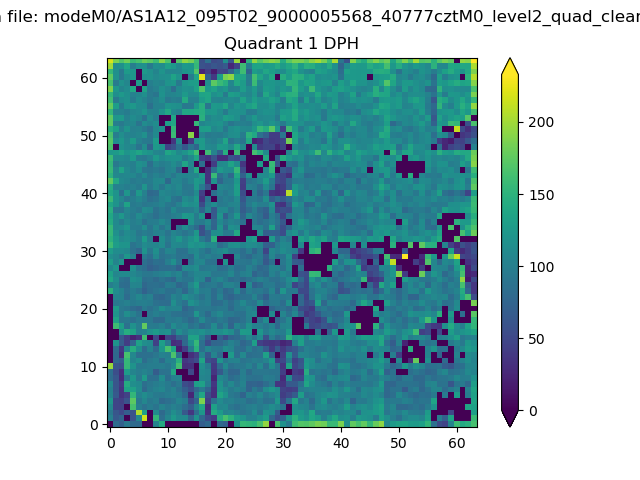 |
Quadrant B |
|---|---|---|---|
| Quadrant D | 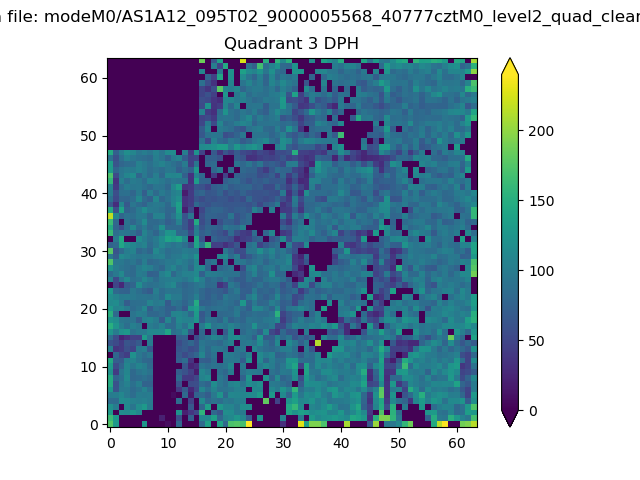 |
 |
Quadrant C |
| Plot type | Count rate plots | Images |
|---|---|---|
| Comparison with Poisson distribution Blue bars denote a histogram of data divided into 1 sec bins. Red curve is a Poisson curve with rate = median count rate of data. |
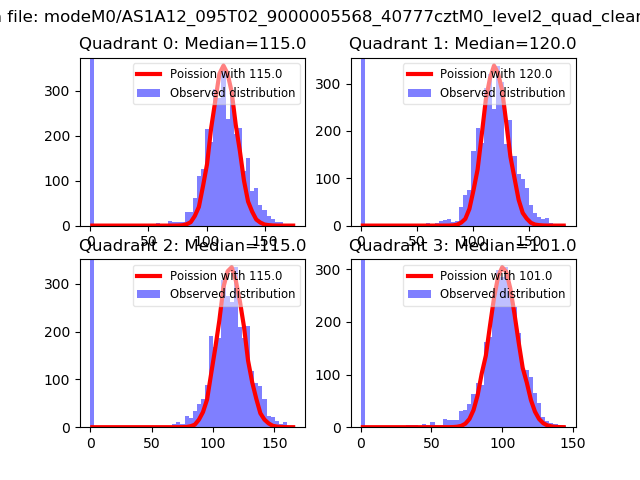 |
 |
| Quadrant-wise count rates Data is divided into 100 sec bins |
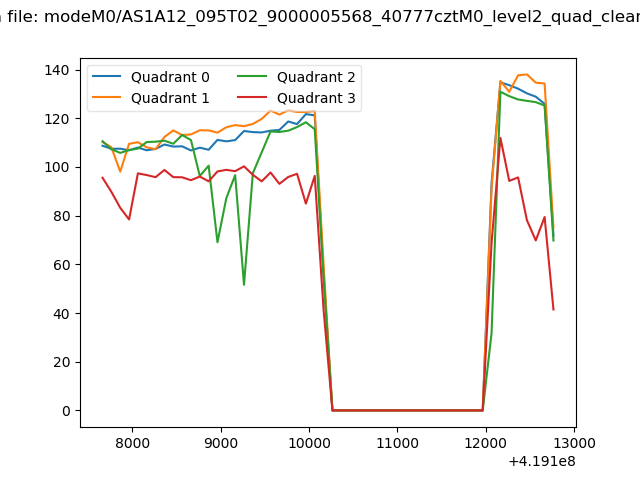 |
|
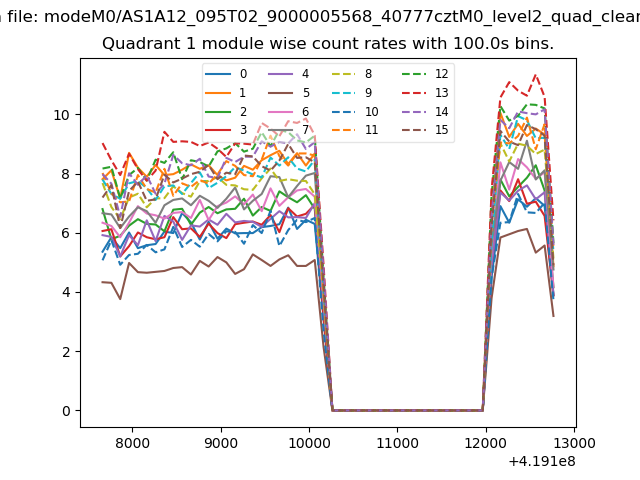
| Module-wise count rates for Quadrant A Data is divided into 100 sec bins |
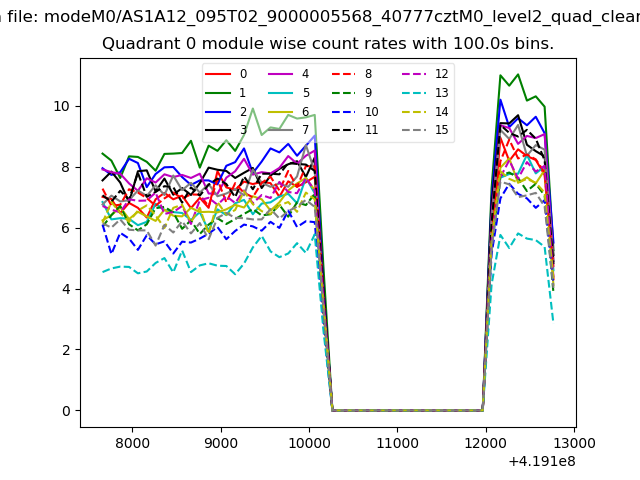 |
 |
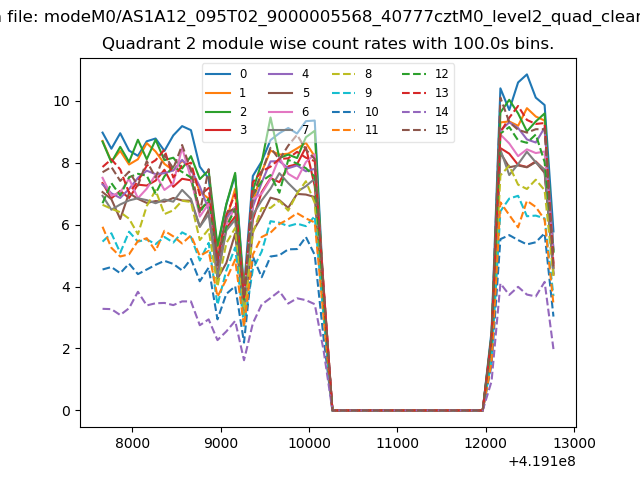
| Module-wise count rates for Quadrant B Data is divided into 100 sec bins |
 |
 |
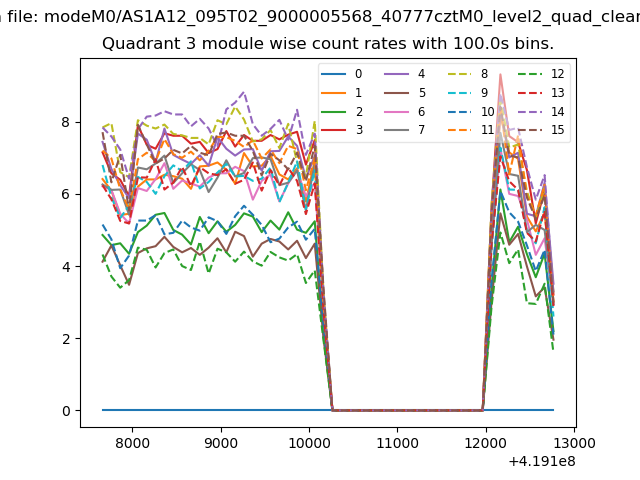
| Module-wise count rates for Quadrant C Data is divided into 100 sec bins |
 |
 |
| Module-wise count rates for Quadrant D Data is divided into 100 sec bins |
 |
 |
| Parameter | Plot |
|---|---|
| CZT HV Monitor | 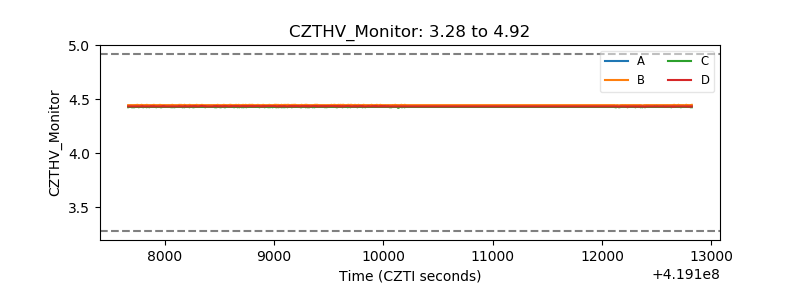 |
| D_VDD | 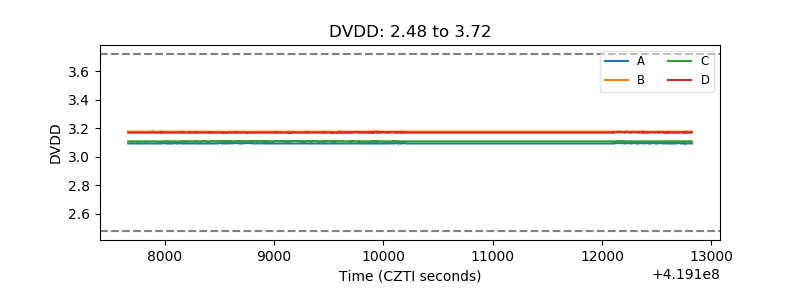 |
| Temperature 1 | 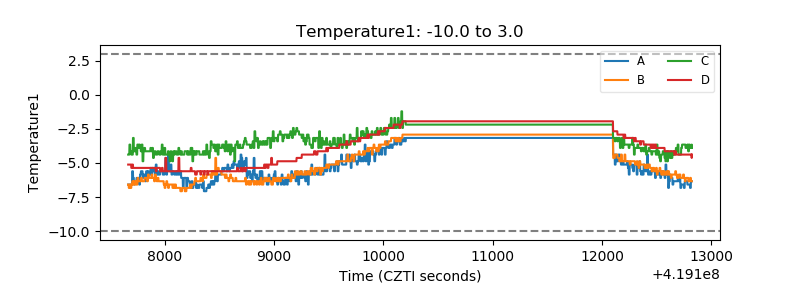 |
| Veto HV Monitor | 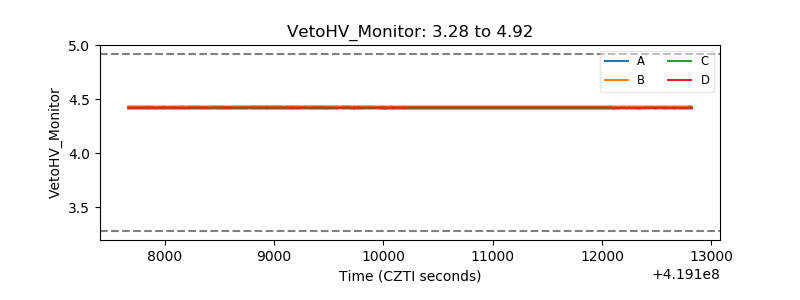 |
| Veto LLD | 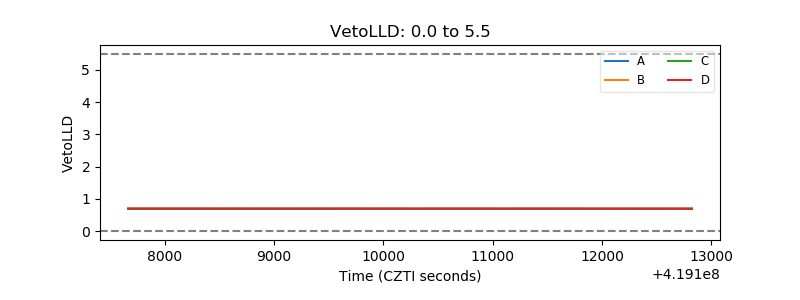 |
| Alpha Counter | 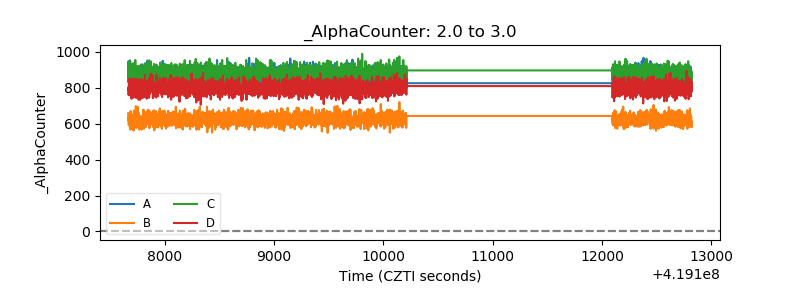 |
| _CPM_Rate | 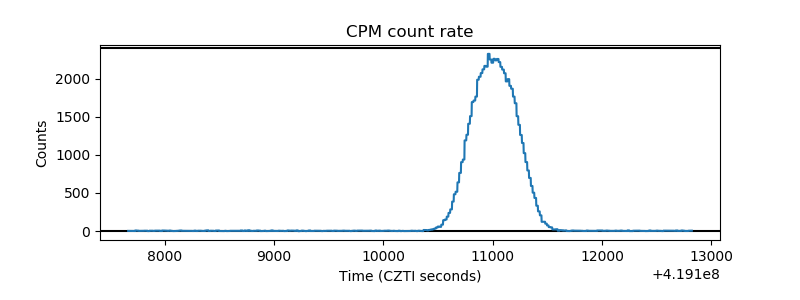 |
| CZT Counter | 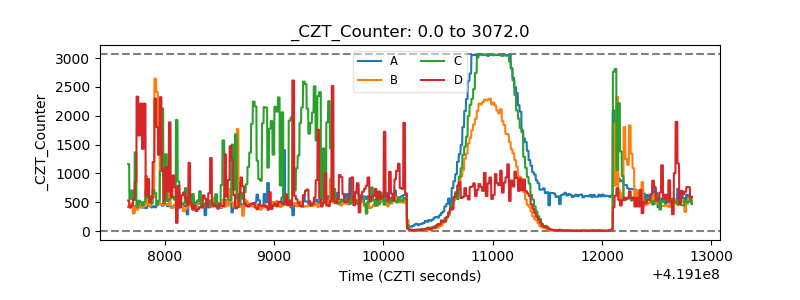 |
| +2.5 Volts monitor | 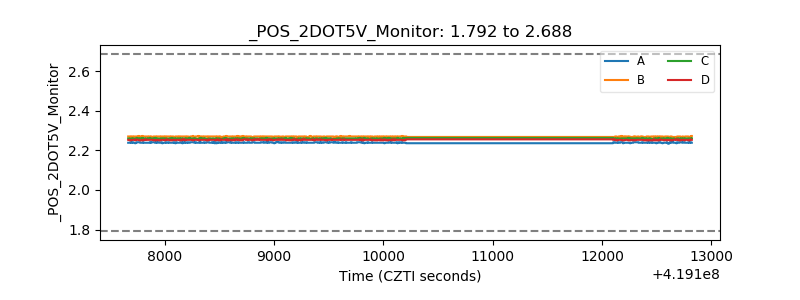 |
| +5 Volts monitor | 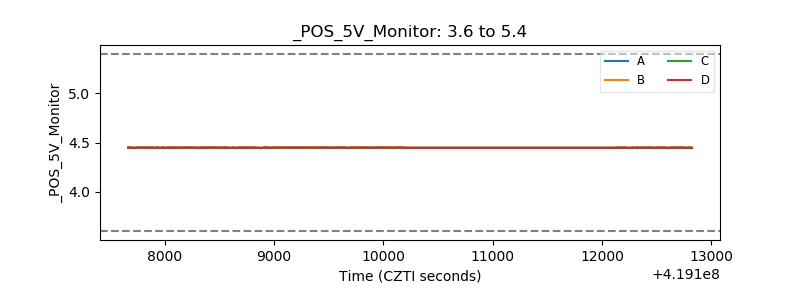 |
| _ROLL_ROT |  |
| _Roll_DEC | 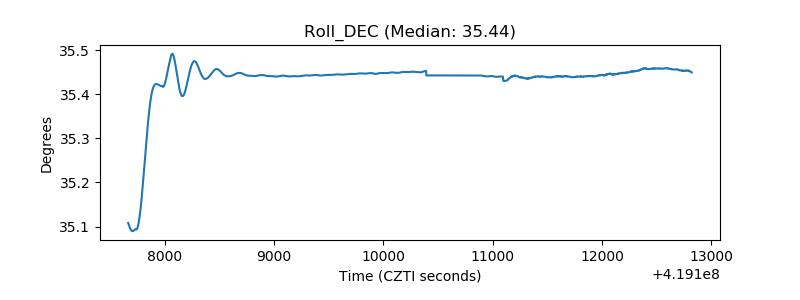 |
| _Roll_RA | 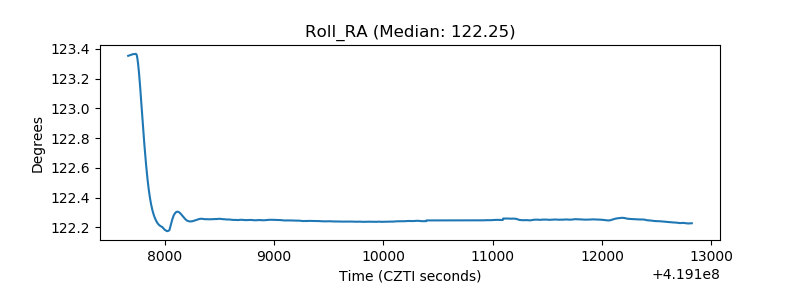 |
| Veto Counter | 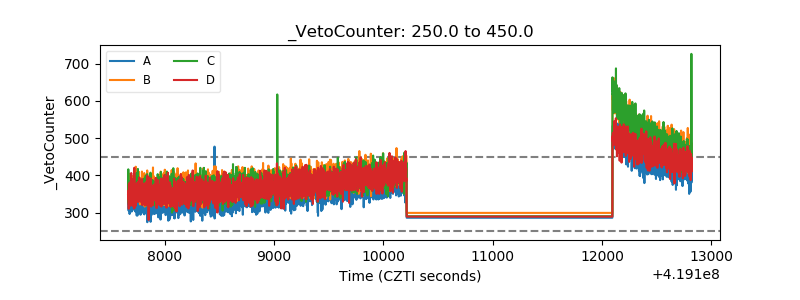 |