| Param | Original file | Final file |
|---|---|---|
| Filename | modeM0/AS1A12_095T02_9000005568_40780cztM0_level2.fits | modeM0/AS1A12_095T02_9000005568_40780cztM0_level2_quad_clean.evt |
| Size (bytes) | 377,948,160 | 83,531,520 |
| Size | 360.4 MB | 79.7 MB |
| Events in quadrant A | 3,264,049 | 568,357 |
| Events in quadrant B | 2,612,803 | 602,364 |
| Events in quadrant C | 4,013,255 | 541,939 |
| Events in quadrant D | 3,718,801 | 473,087 |
| Mode M9 | |||
|---|---|---|---|
| Quadrant | BADHDUFLAG | Total packets | Discarded packets |
| A | 0 | 39 | 0 |
| B | 0 | 39 | 0 |
| C | 0 | 39 | 0 |
| D | 0 | 40 | 0 |
| Mode SS | |||
|---|---|---|---|
| Quadrant | BADHDUFLAG | Total packets | Discarded packets |
| A | 0 | 100 | 0 |
| B | 0 | 100 | 0 |
| C | 0 | 100 | 0 |
| D | 0 | 100 | 0 |
| Mode M0 | |||
|---|---|---|---|
| Quadrant | BADHDUFLAG | Total packets | Discarded packets |
| A | 0 | 12659 | 3 |
| B | 0 | 10861 | 2 |
| C | 0 | 14997 | 2 |
| D | 0 | 14340 | 2 |
| Quadrant | Total seconds | Saturated seconds | Saturation percentage |
|---|---|---|---|
| A | 4898 | 148 | 3.021641% |
| B | 4898 | 69 | 1.408738% |
| C | 4898 | 398 | 8.125766% |
| D | 4898 | 531 | 10.841160% |
Noise dominated data is calculated using 1-second bins in cleaned event files. If a bin has >2000 counts, and if more than 50% of those come from <1% of pixels, then it is considered to be noise-dominated and hence unusable.
| Quadrant | # 1 sec bins | Bins with >0 counts | Bins with >2000 counts | High rate bins dominated by noise | Noise dominated (total time) | Noise dominated (detector-on time) | Marked lightcurve |
|---|---|---|---|---|---|---|---|
| A | 7051 | 4899 | 139 | 139 | 1.97% | 2.84% | 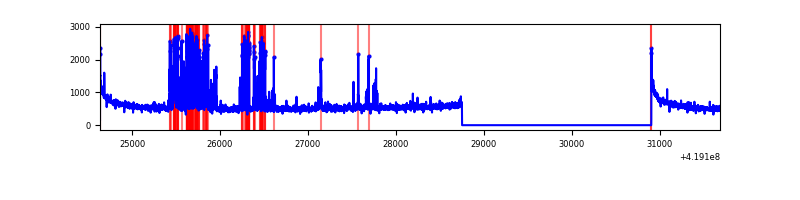 |
| B | 7051 | 4899 | 45 | 45 | 0.64% | 0.92% | 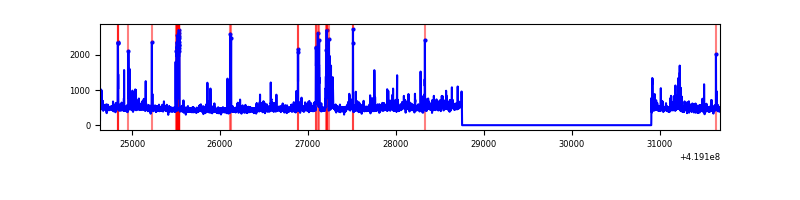 |
| C | 7051 | 4899 | 409 | 409 | 5.80% | 8.35% | 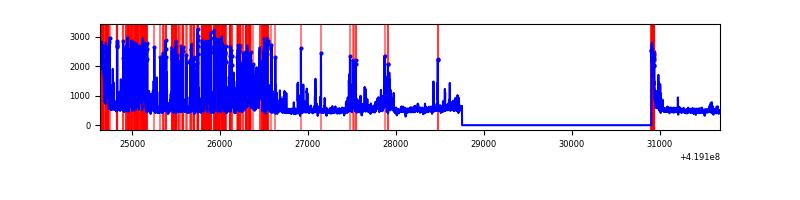 |
| D | 7051 | 4899 | 251 | 251 | 3.56% | 5.12% | 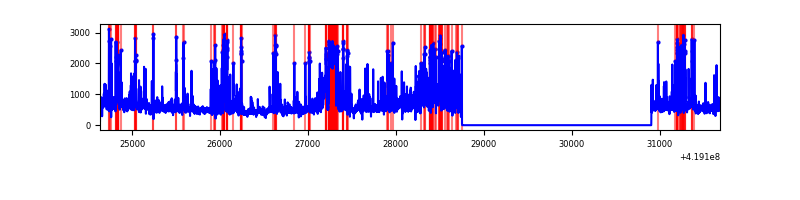 |
Top three noisy pixels from each quadrant. If the there are fewer than three noisy pixels in the level2.evt file, extra rows are filled as -1
| Pixel properties | Quadrant properties | ||||||
|---|---|---|---|---|---|---|---|
| Quadrant | DetID | PixID | Counts | Sigma | Mean | Median | Sigma |
| A | 13 | 248 | 595619 | 5282.87 | 554 | 544 | 112.6 |
| A | 10 | 83 | 466802 | 4139.27 | 554 | 544 | 112.6 |
| A | 2 | 79 | 25234 | 219.18 | 554 | 544 | 112.6 |
| B | 5 | 255 | 176043 | 1623.86 | 560 | 544 | 108.1 |
| B | 0 | 229 | 118230 | 1088.92 | 560 | 544 | 108.1 |
| B | 7 | 202 | 42030 | 383.86 | 560 | 544 | 108.1 |
| C | 9 | 187 | 1566259 | 12673.47 | 529 | 533 | 123.5 |
| C | 15 | 214 | 203335 | 1641.54 | 529 | 533 | 123.5 |
| C | 0 | 10 | 175562 | 1416.74 | 529 | 533 | 123.5 |
| D | 12 | 227 | 939496 | 7368.45 | 513 | 498 | 127.4 |
| D | 5 | 222 | 269218 | 2108.68 | 513 | 498 | 127.4 |
| D | 2 | 249 | 179268 | 1402.83 | 513 | 498 | 127.4 |
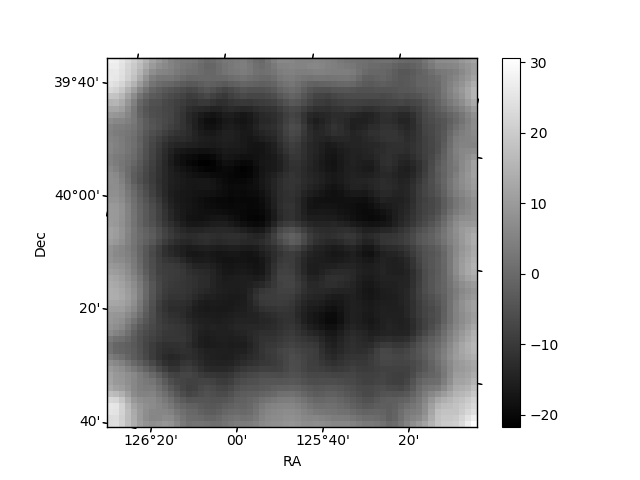
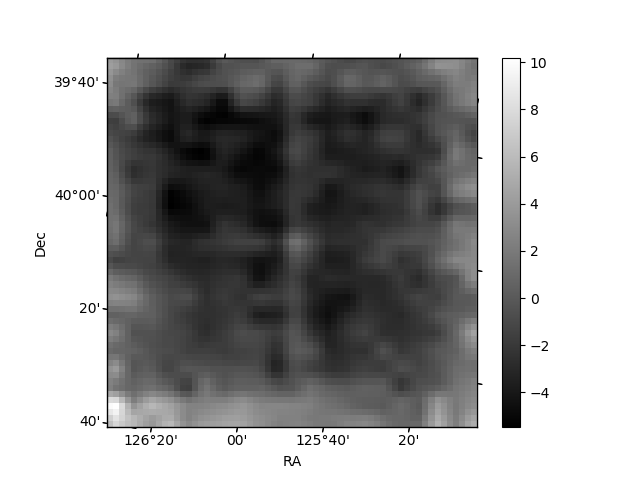
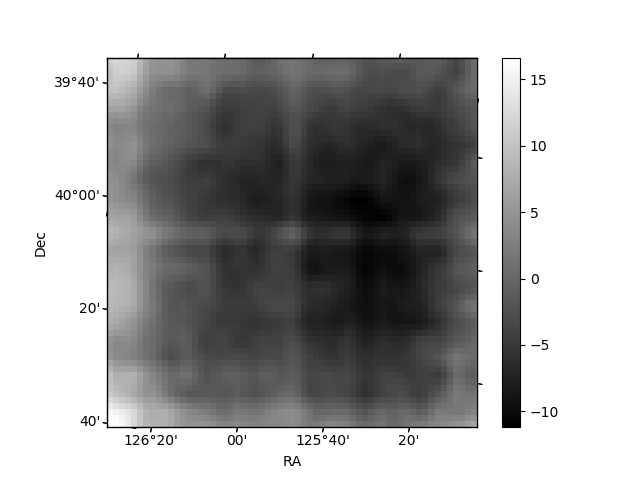
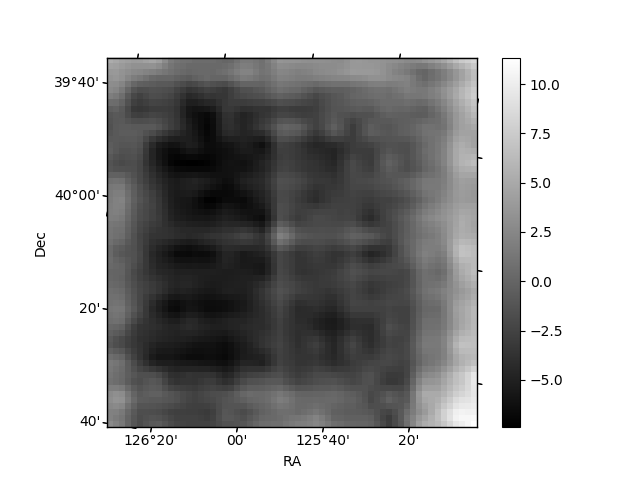
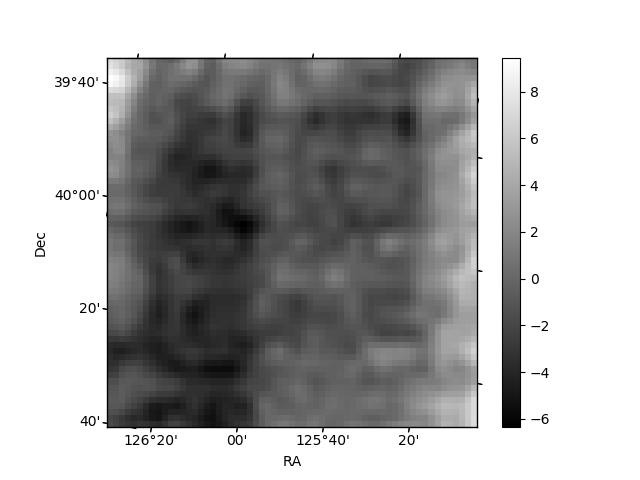
Histogram calculated using DETX and DETY for each event in the final _common_clean file
| Quadrant A | 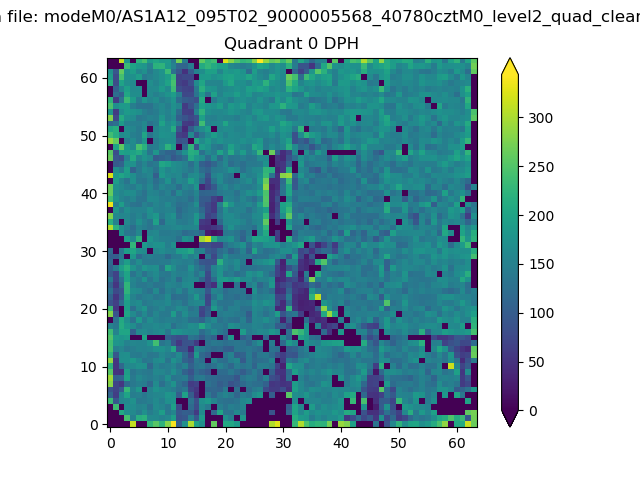 |
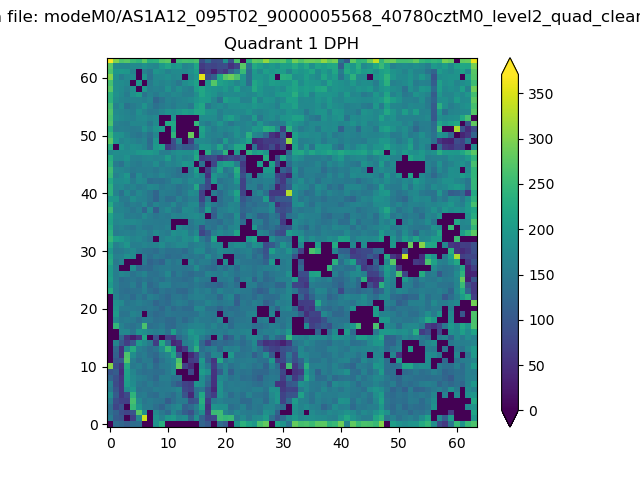 |
Quadrant B |
|---|---|---|---|
| Quadrant D | 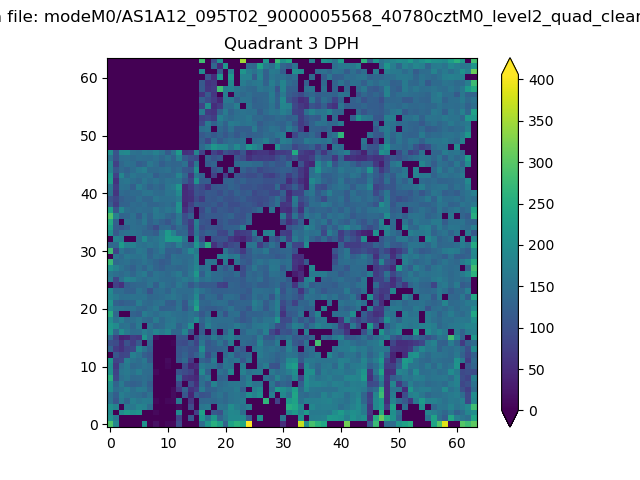 |
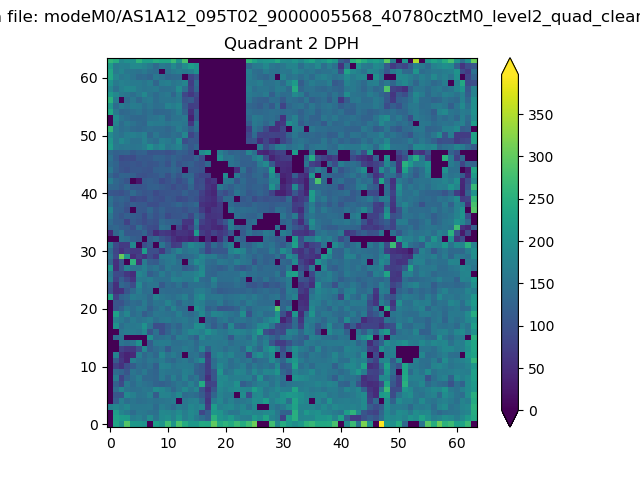 |
Quadrant C |
| Plot type | Count rate plots | Images |
|---|---|---|
| Comparison with Poisson distribution Blue bars denote a histogram of data divided into 1 sec bins. Red curve is a Poisson curve with rate = median count rate of data. |
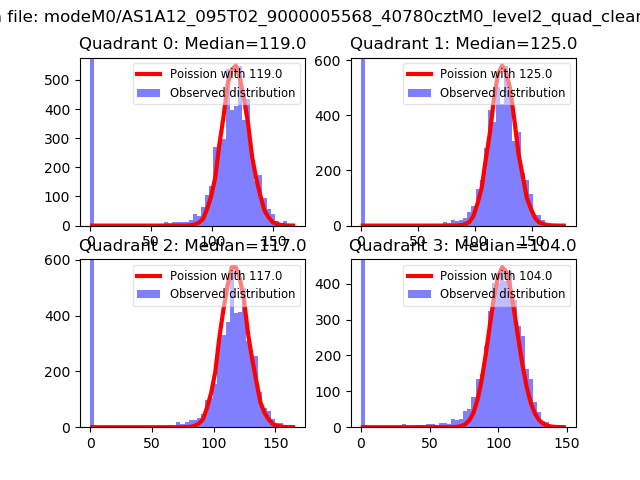 |
 |
| Quadrant-wise count rates Data is divided into 100 sec bins |
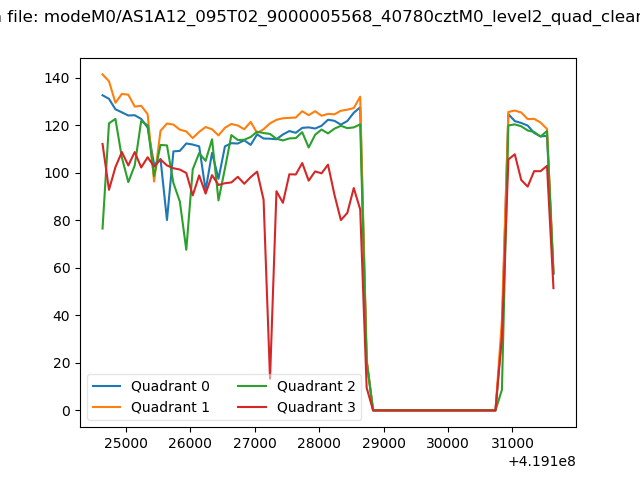 |
|
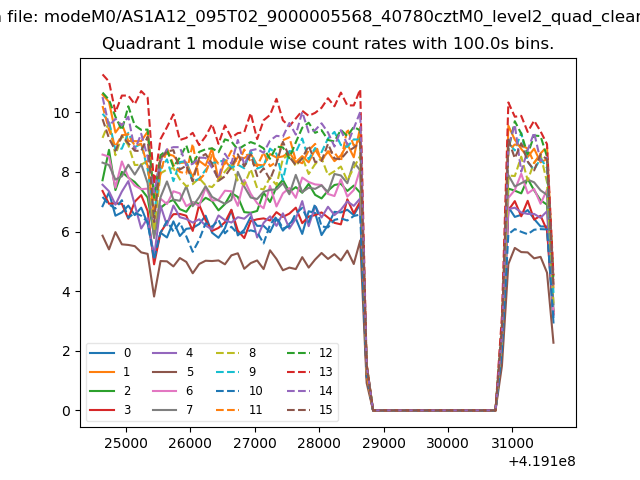
| Module-wise count rates for Quadrant A Data is divided into 100 sec bins |
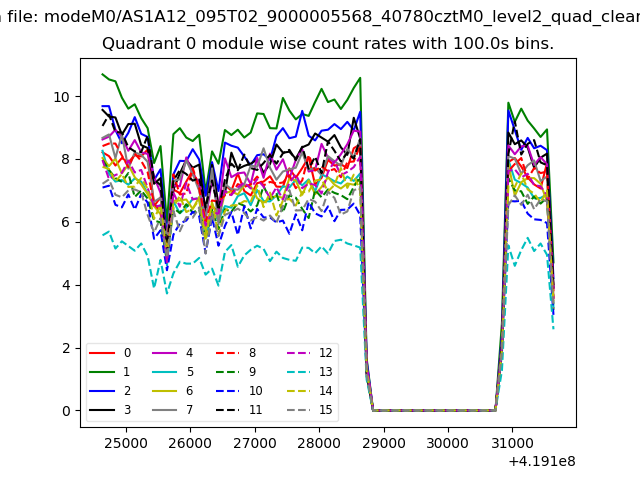 |
 |
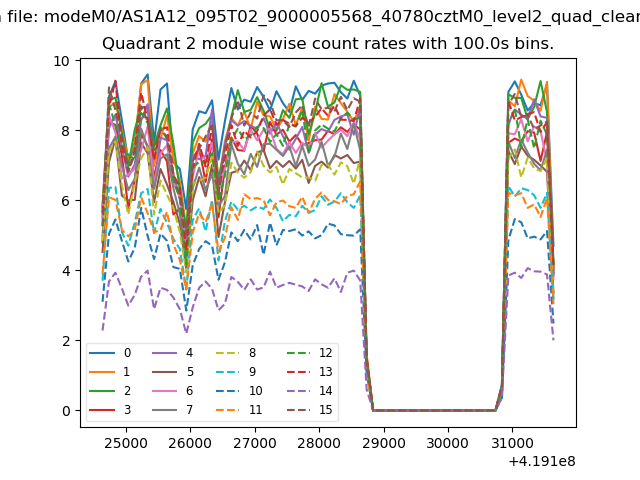
| Module-wise count rates for Quadrant B Data is divided into 100 sec bins |
 |
 |
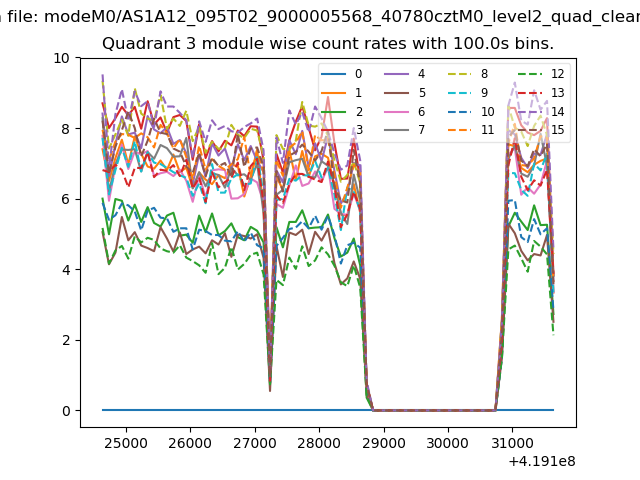
| Module-wise count rates for Quadrant C Data is divided into 100 sec bins |
 |
 |
| Module-wise count rates for Quadrant D Data is divided into 100 sec bins |
 |
 |
| Parameter | Plot |
|---|---|
| CZT HV Monitor | 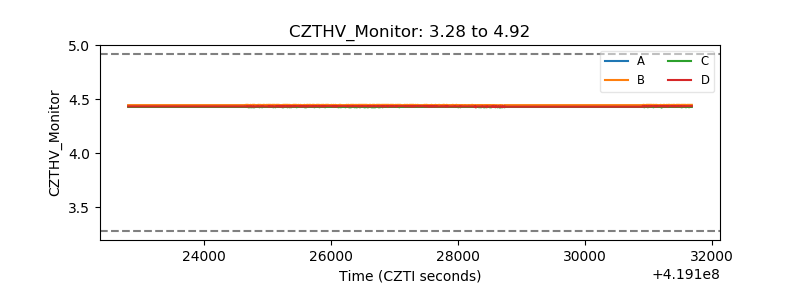 |
| D_VDD | 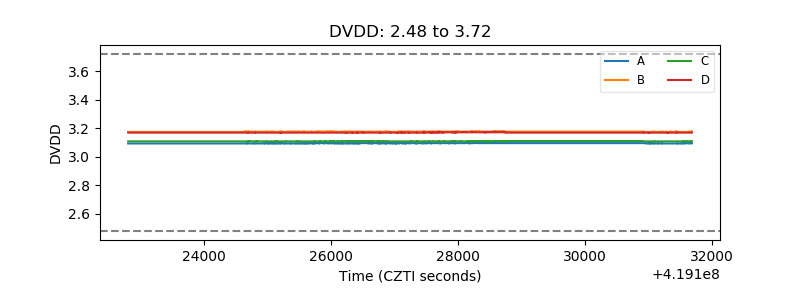 |
| Temperature 1 | 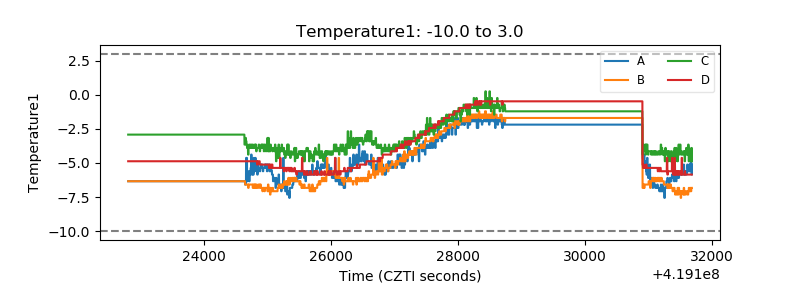 |
| Veto HV Monitor | 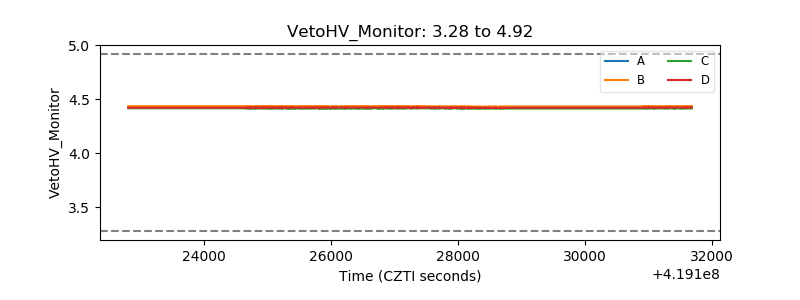 |
| Veto LLD | 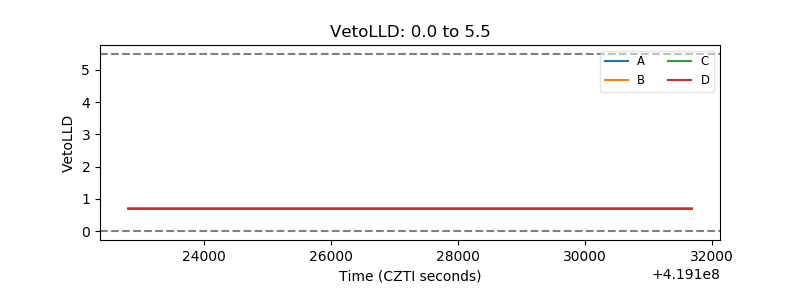 |
| Alpha Counter | 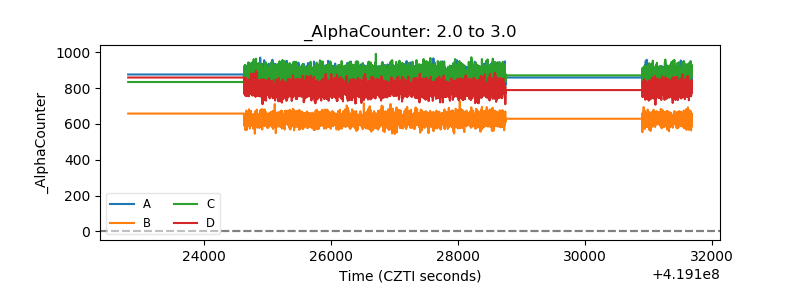 |
| _CPM_Rate | 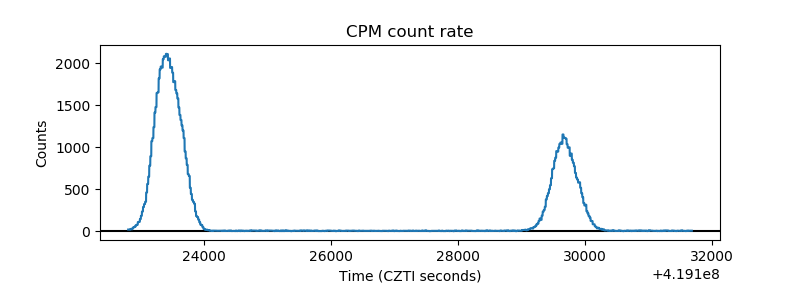 |
| CZT Counter | 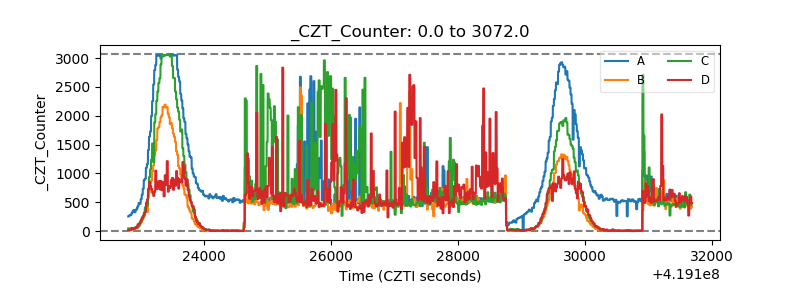 |
| +2.5 Volts monitor | 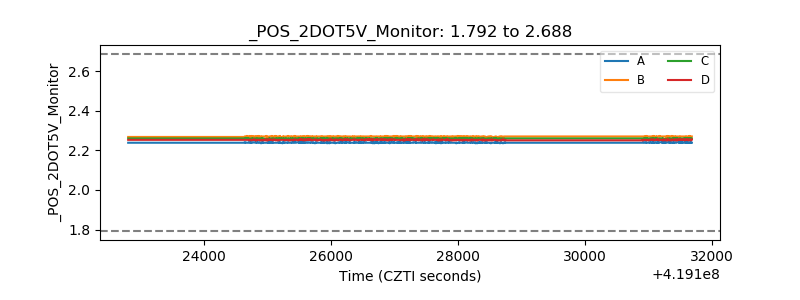 |
| +5 Volts monitor | 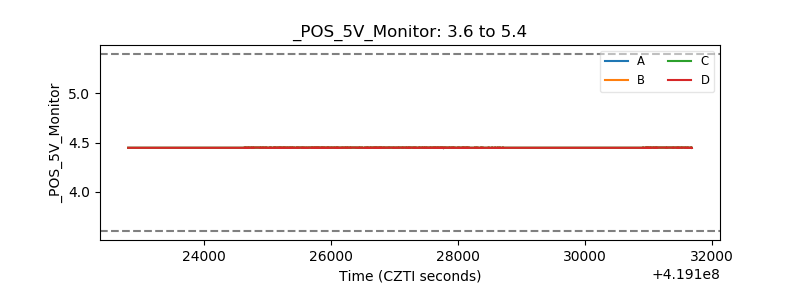 |
| _ROLL_ROT | 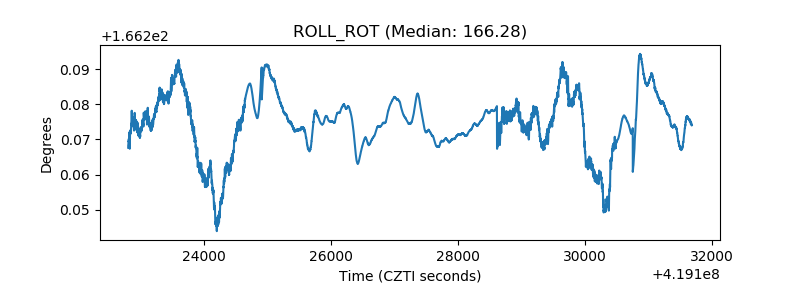 |
| _Roll_DEC | 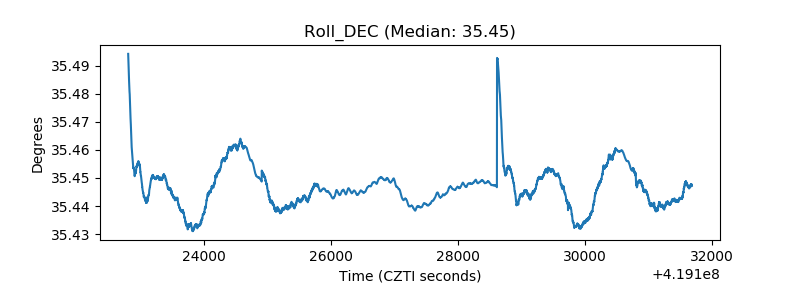 |
| _Roll_RA | 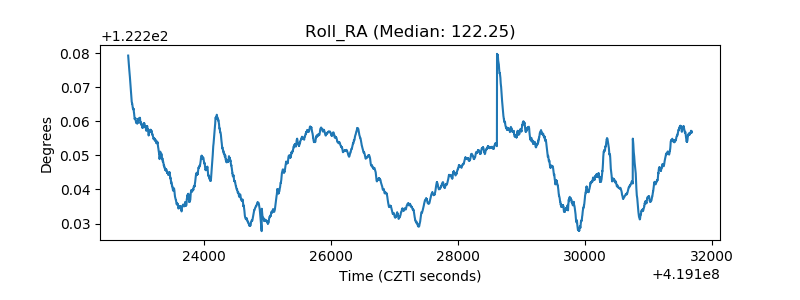 |
| Veto Counter |  |