| Param | Original file | Final file |
|---|---|---|
| Filename | modeM0/AS1A12_095T02_9000005568_40781cztM0_level2.fits | modeM0/AS1A12_095T02_9000005568_40781cztM0_level2_quad_clean.evt |
| Size (bytes) | 359,458,560 | 91,215,360 |
| Size | 342.8 MB | 87.0 MB |
| Events in quadrant A | 3,022,270 | 622,760 |
| Events in quadrant B | 2,759,168 | 646,092 |
| Events in quadrant C | 3,302,436 | 612,328 |
| Events in quadrant D | 3,795,981 | 497,959 |
| Mode M9 | |||
|---|---|---|---|
| Quadrant | BADHDUFLAG | Total packets | Discarded packets |
| A | 0 | 42 | 0 |
| B | 0 | 42 | 0 |
| C | 0 | 42 | 0 |
| D | 0 | 42 | 0 |
| Mode SS | |||
|---|---|---|---|
| Quadrant | BADHDUFLAG | Total packets | Discarded packets |
| A | 0 | 114 | 0 |
| B | 0 | 114 | 0 |
| C | 0 | 114 | 0 |
| D | 0 | 114 | 0 |
| Mode M0 | |||
|---|---|---|---|
| Quadrant | BADHDUFLAG | Total packets | Discarded packets |
| A | 0 | 12170 | 3 |
| B | 0 | 11804 | 2 |
| C | 0 | 13140 | 2 |
| D | 0 | 15028 | 2 |
| Quadrant | Total seconds | Saturated seconds | Saturation percentage |
|---|---|---|---|
| A | 5467 | 14 | 0.256082% |
| B | 5467 | 42 | 0.768246% |
| C | 5467 | 103 | 1.884031% |
| D | 5467 | 780 | 14.267423% |
Noise dominated data is calculated using 1-second bins in cleaned event files. If a bin has >2000 counts, and if more than 50% of those come from <1% of pixels, then it is considered to be noise-dominated and hence unusable.
| Quadrant | # 1 sec bins | Bins with >0 counts | Bins with >2000 counts | High rate bins dominated by noise | Noise dominated (total time) | Noise dominated (detector-on time) | Marked lightcurve |
|---|---|---|---|---|---|---|---|
| A | 9743 | 5469 | 8 | 8 | 0.08% | 0.15% | 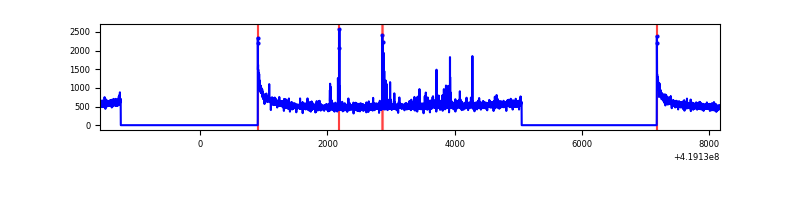 |
| B | 9743 | 5469 | 33 | 33 | 0.34% | 0.60% | 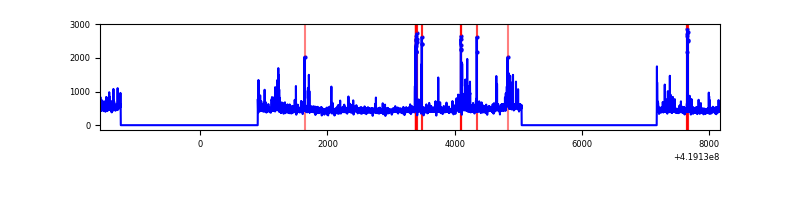 |
| C | 9743 | 5469 | 102 | 102 | 1.05% | 1.87% | 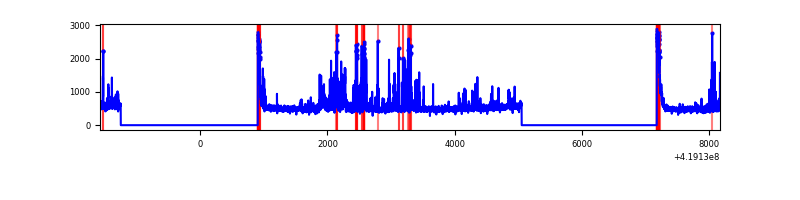 |
| D | 9743 | 5468 | 216 | 216 | 2.22% | 3.95% | 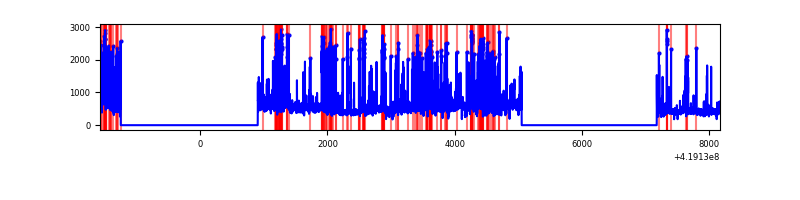 |
Top three noisy pixels from each quadrant. If the there are fewer than three noisy pixels in the level2.evt file, extra rows are filled as -1
| Pixel properties | Quadrant properties | ||||||
|---|---|---|---|---|---|---|---|
| Quadrant | DetID | PixID | Counts | Sigma | Mean | Median | Sigma |
| A | 10 | 83 | 516777 | 4074.99 | 619 | 607 | 126.7 |
| A | 13 | 248 | 53927 | 420.94 | 619 | 607 | 126.7 |
| A | 12 | 189 | 23969 | 184.44 | 619 | 607 | 126.7 |
| B | 0 | 229 | 106788 | 908.17 | 614 | 597 | 116.9 |
| B | 5 | 255 | 92245 | 783.79 | 614 | 597 | 116.9 |
| B | 7 | 202 | 50847 | 429.75 | 614 | 597 | 116.9 |
| C | 9 | 187 | 503044 | 3594.74 | 600 | 604 | 139.8 |
| C | 15 | 214 | 234798 | 1675.56 | 600 | 604 | 139.8 |
| C | 0 | 10 | 199654 | 1424.12 | 600 | 604 | 139.8 |
| D | 12 | 227 | 1070842 | 7804.96 | 555 | 542 | 137.1 |
| D | 2 | 249 | 237679 | 1729.28 | 555 | 542 | 137.1 |
| D | 12 | 191 | 154254 | 1120.92 | 555 | 542 | 137.1 |
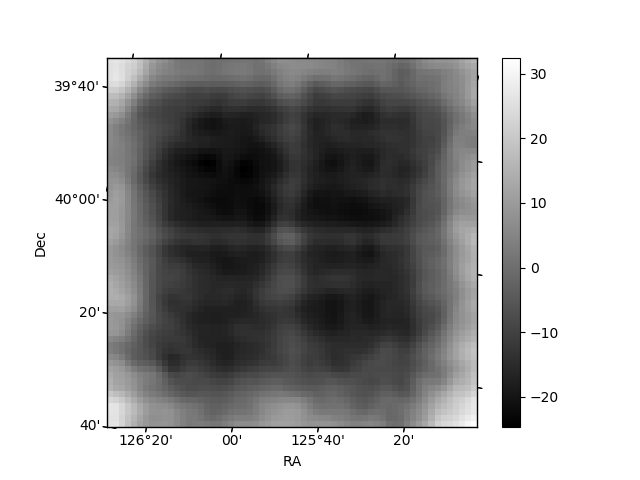
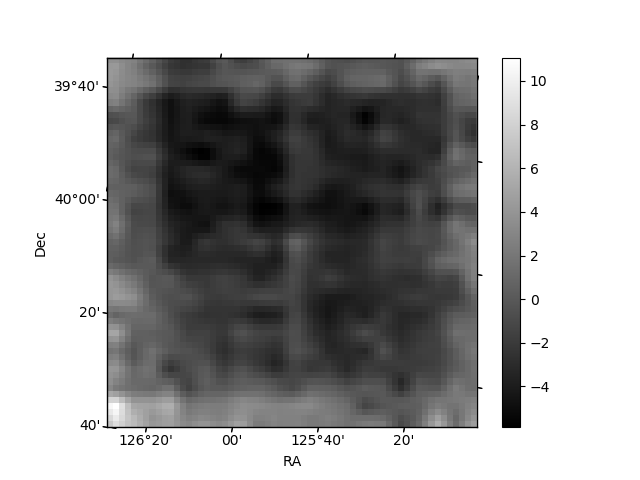
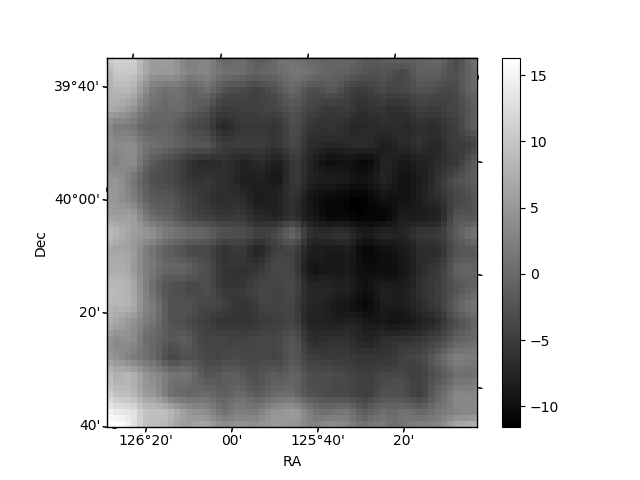
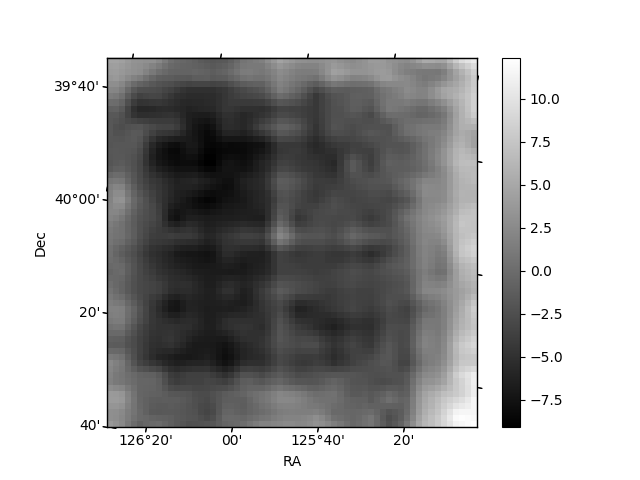
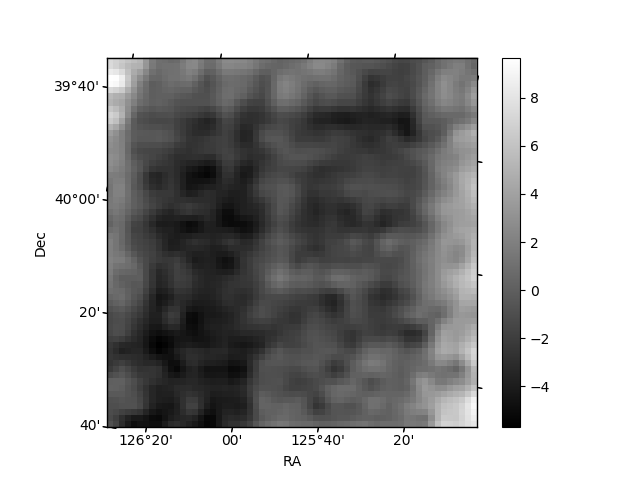
Histogram calculated using DETX and DETY for each event in the final _common_clean file
| Quadrant A | 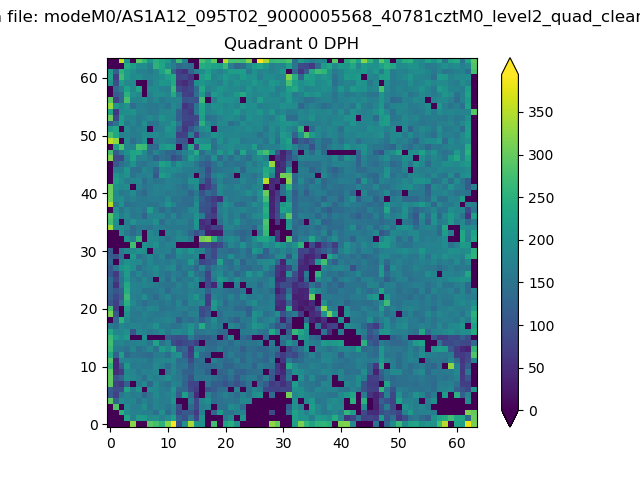 |
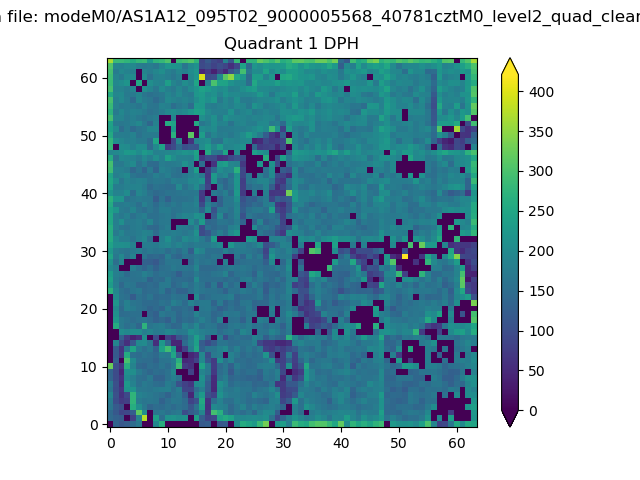 |
Quadrant B |
|---|---|---|---|
| Quadrant D | 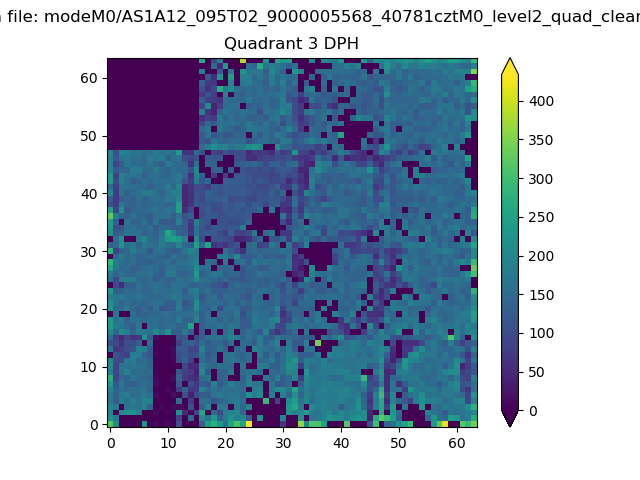 |
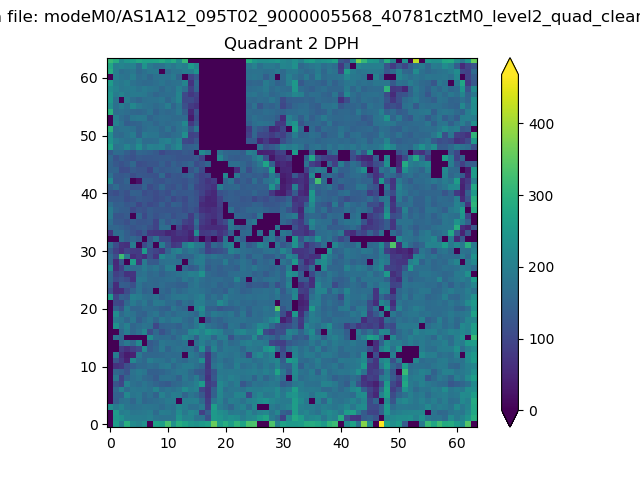 |
Quadrant C |
| Plot type | Count rate plots | Images |
|---|---|---|
| Comparison with Poisson distribution Blue bars denote a histogram of data divided into 1 sec bins. Red curve is a Poisson curve with rate = median count rate of data. |
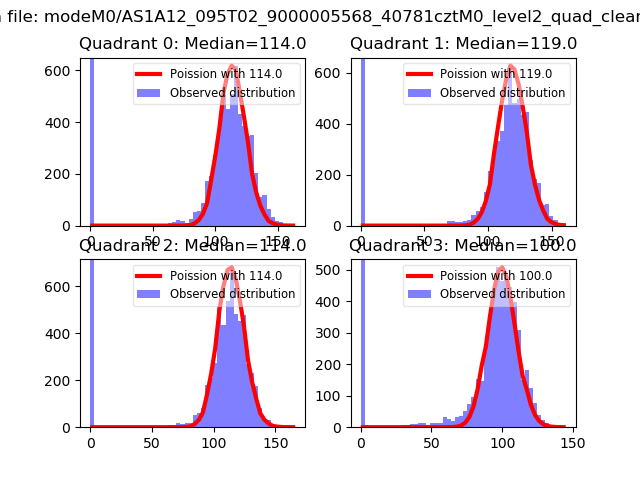 |
 |
| Quadrant-wise count rates Data is divided into 100 sec bins |
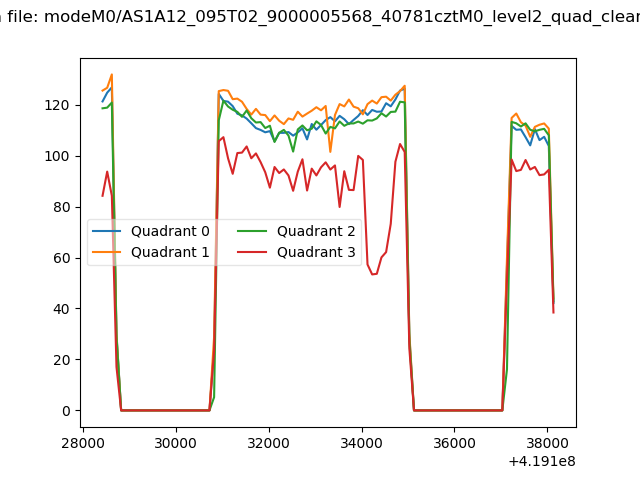 |
|
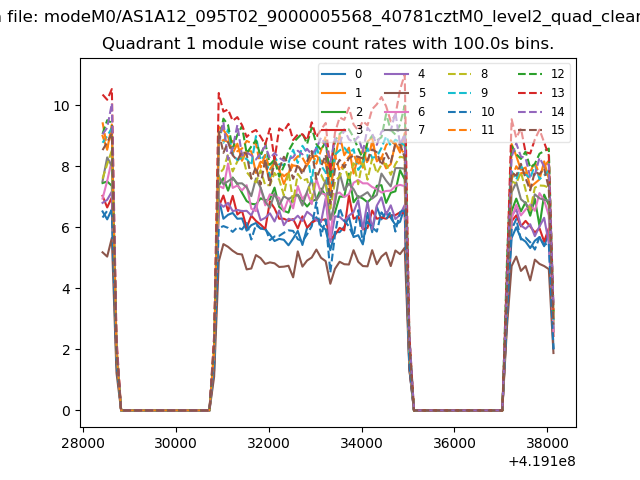
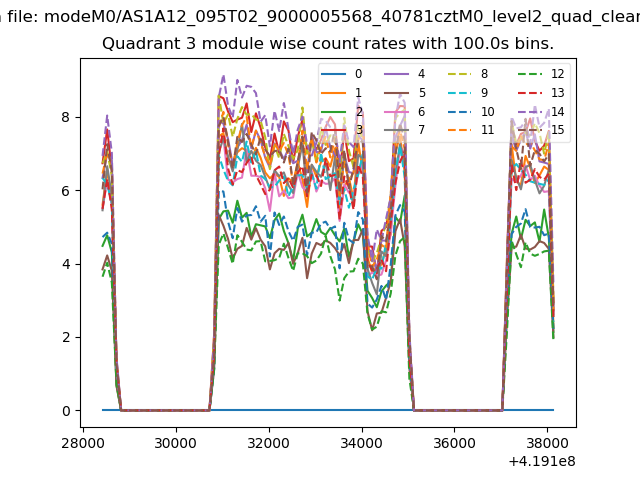
| Module-wise count rates for Quadrant A Data is divided into 100 sec bins |
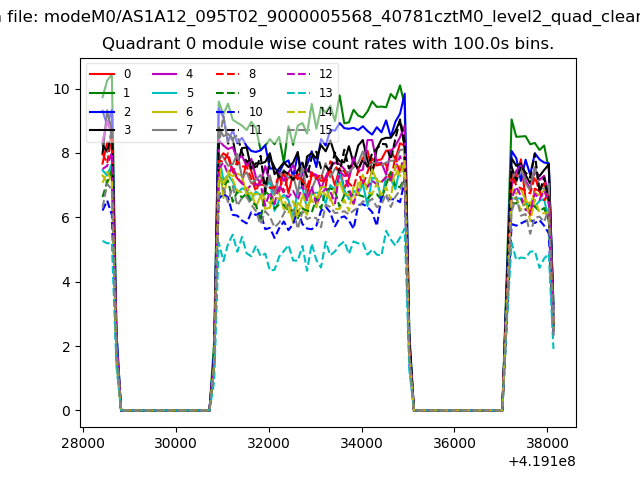 |
 |
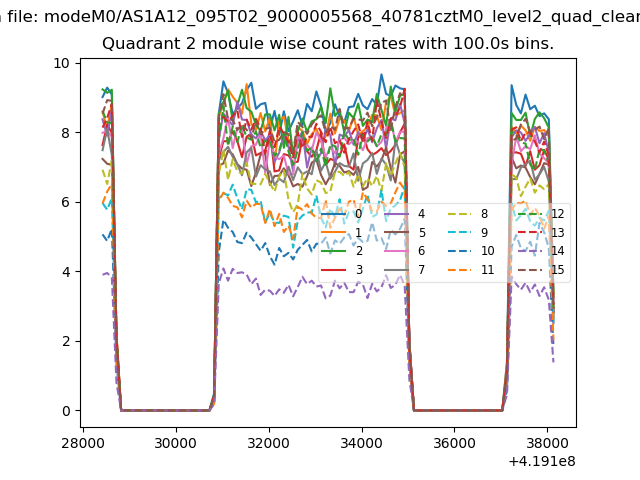
| Module-wise count rates for Quadrant B Data is divided into 100 sec bins |
 |
 |
| Module-wise count rates for Quadrant C Data is divided into 100 sec bins |
 |
 |
| Module-wise count rates for Quadrant D Data is divided into 100 sec bins |
 |
 |
| Parameter | Plot |
|---|---|
| CZT HV Monitor | 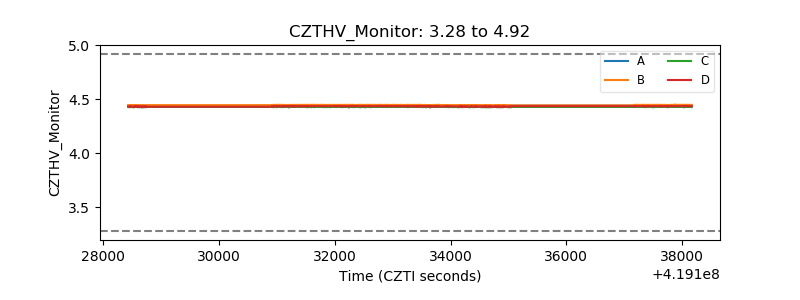 |
| D_VDD | 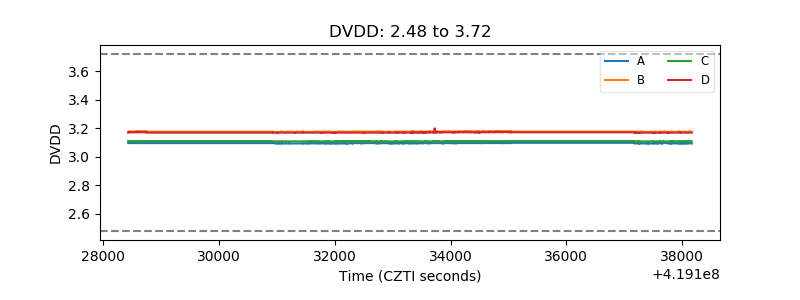 |
| Temperature 1 | 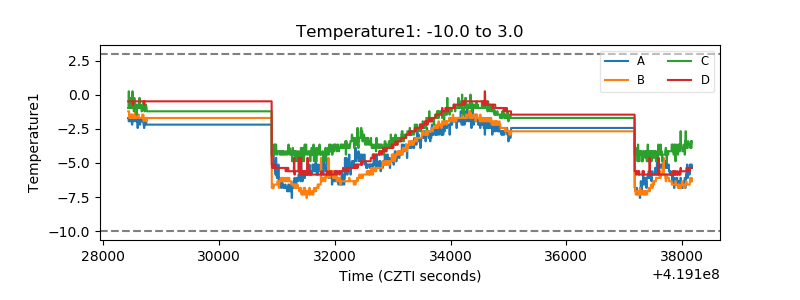 |
| Veto HV Monitor | 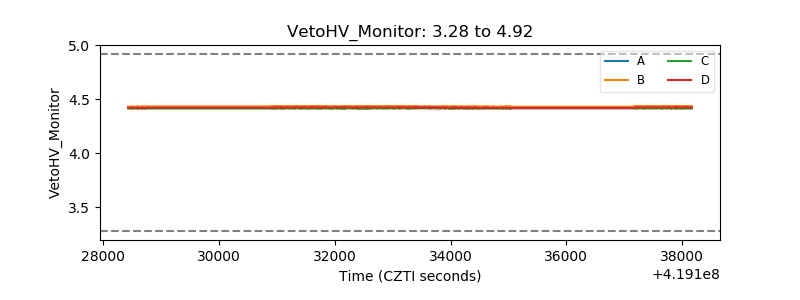 |
| Veto LLD | 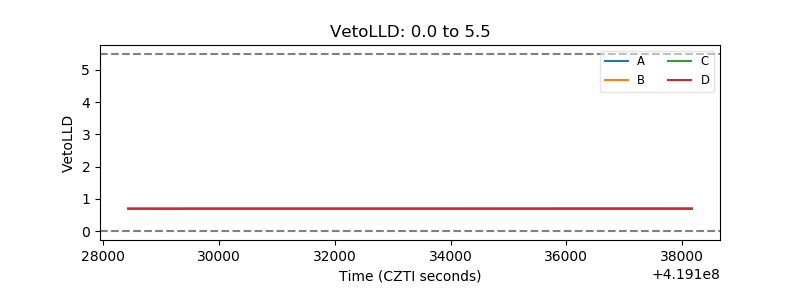 |
| Alpha Counter | 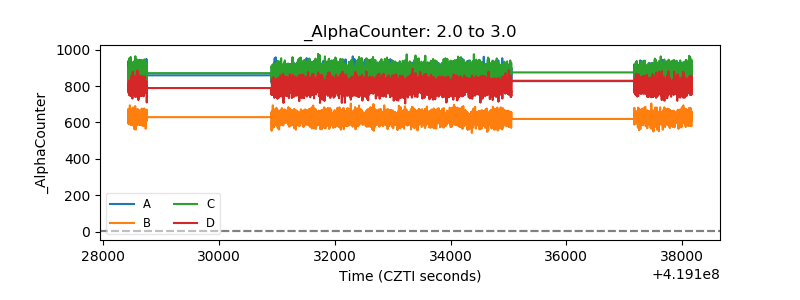 |
| _CPM_Rate | 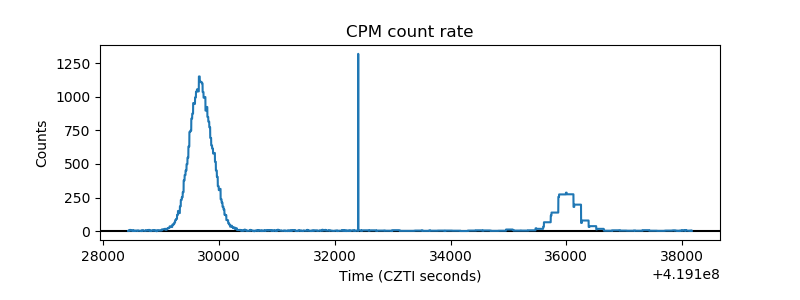 |
| CZT Counter | 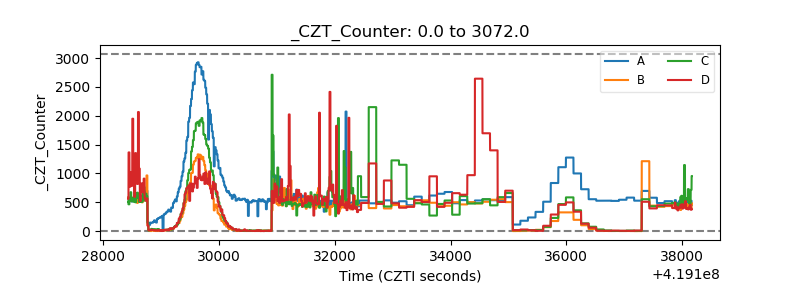 |
| +2.5 Volts monitor | 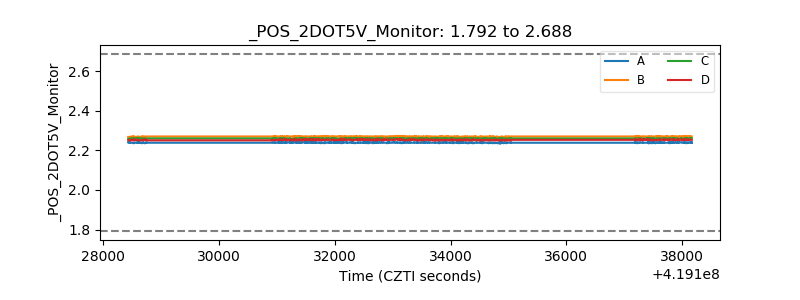 |
| +5 Volts monitor |  |
| _ROLL_ROT | 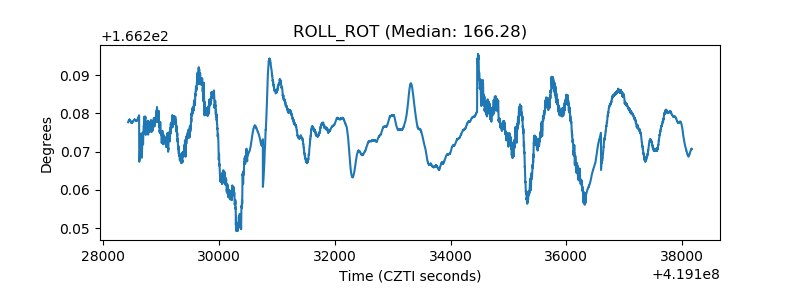 |
| _Roll_DEC | 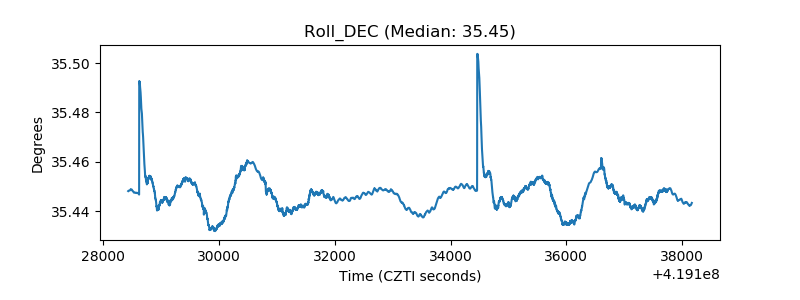 |
| _Roll_RA | 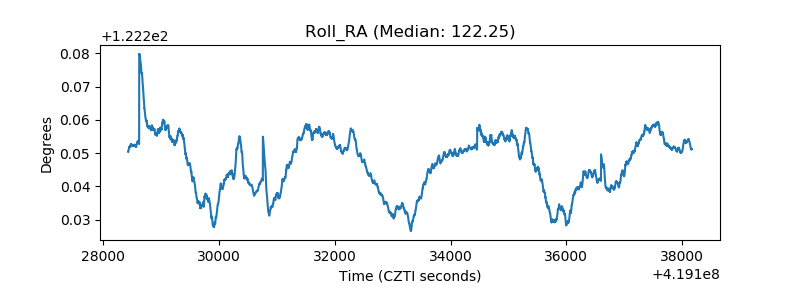 |
| Veto Counter | 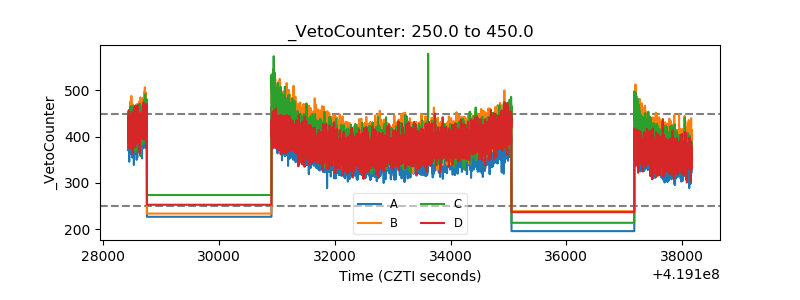 |