| Param | Original file | Final file |
|---|---|---|
| Filename | modeM0/AS1A12_095T02_9000005568_40782cztM0_level2.fits | modeM0/AS1A12_095T02_9000005568_40782cztM0_level2_quad_clean.evt |
| Size (bytes) | 331,289,280 | 86,163,840 |
| Size | 315.9 MB | 82.2 MB |
| Events in quadrant A | 2,860,505 | 580,875 |
| Events in quadrant B | 2,686,481 | 598,580 |
| Events in quadrant C | 3,194,376 | 567,086 |
| Events in quadrant D | 3,111,353 | 493,842 |
| Mode M9 | |||
|---|---|---|---|
| Quadrant | BADHDUFLAG | Total packets | Discarded packets |
| A | 0 | 33 | 0 |
| B | 0 | 33 | 0 |
| C | 0 | 33 | 0 |
| D | 0 | 34 | 0 |
| Mode SS | |||
|---|---|---|---|
| Quadrant | BADHDUFLAG | Total packets | Discarded packets |
| A | 0 | 108 | 0 |
| B | 0 | 108 | 0 |
| C | 0 | 108 | 0 |
| D | 0 | 108 | 0 |
| Mode M0 | |||
|---|---|---|---|
| Quadrant | BADHDUFLAG | Total packets | Discarded packets |
| A | 0 | 11482 | 3 |
| B | 0 | 11562 | 2 |
| C | 0 | 12738 | 2 |
| D | 0 | 13052 | 2 |
| Quadrant | Total seconds | Saturated seconds | Saturation percentage |
|---|---|---|---|
| A | 5293 | 14 | 0.264500% |
| B | 5293 | 97 | 1.832609% |
| C | 5243 | 120 | 2.288766% |
| D | 5235 | 323 | 6.170010% |
Noise dominated data is calculated using 1-second bins in cleaned event files. If a bin has >2000 counts, and if more than 50% of those come from <1% of pixels, then it is considered to be noise-dominated and hence unusable.
| Quadrant | # 1 sec bins | Bins with >0 counts | Bins with >2000 counts | High rate bins dominated by noise | Noise dominated (total time) | Noise dominated (detector-on time) | Marked lightcurve |
|---|---|---|---|---|---|---|---|
| A | 7176 | 5294 | 8 | 8 | 0.11% | 0.15% | 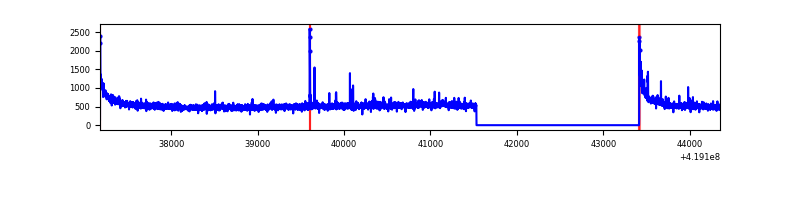 |
| B | 7176 | 5294 | 68 | 68 | 0.95% | 1.28% | 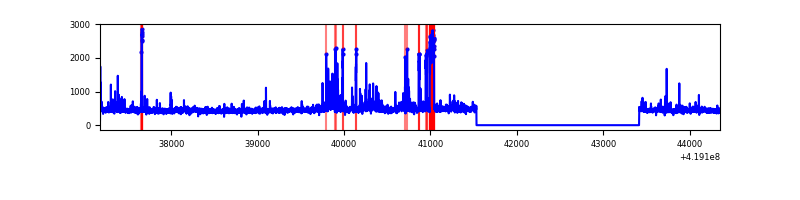 |
| C | 7176 | 5245 | 119 | 119 | 1.66% | 2.27% | 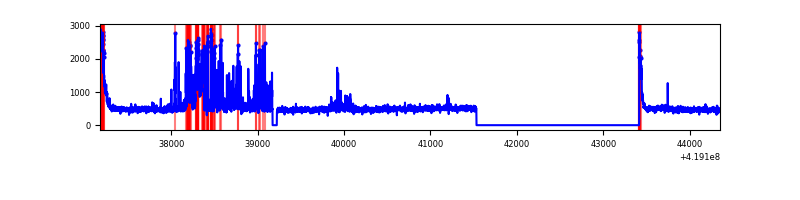 |
| D | 7176 | 5237 | 234 | 234 | 3.26% | 4.47% | 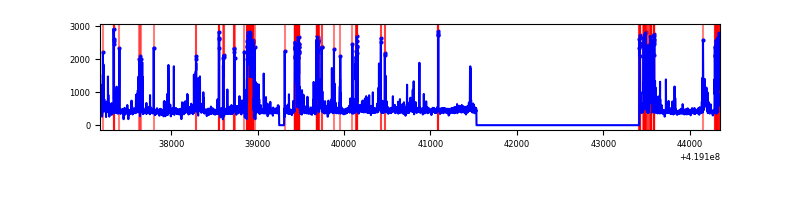 |
Top three noisy pixels from each quadrant. If the there are fewer than three noisy pixels in the level2.evt file, extra rows are filled as -1
| Pixel properties | Quadrant properties | ||||||
|---|---|---|---|---|---|---|---|
| Quadrant | DetID | PixID | Counts | Sigma | Mean | Median | Sigma |
| A | 10 | 83 | 512346 | 4218.85 | 584 | 572 | 121.3 |
| A | 13 | 248 | 47802 | 389.34 | 584 | 572 | 121.3 |
| A | 12 | 189 | 16565 | 131.84 | 584 | 572 | 121.3 |
| B | 0 | 229 | 202662 | 1804.37 | 579 | 563 | 112.0 |
| B | 5 | 255 | 89731 | 796.1 | 579 | 563 | 112.0 |
| B | 4 | 171 | 55712 | 492.38 | 579 | 563 | 112.0 |
| C | 9 | 187 | 541527 | 4129.48 | 561 | 564 | 131.0 |
| C | 15 | 214 | 225977 | 1720.7 | 561 | 564 | 131.0 |
| C | 0 | 10 | 178531 | 1358.52 | 561 | 564 | 131.0 |
| D | 13 | 249 | 382543 | 2846.87 | 544 | 528 | 134.2 |
| D | 2 | 249 | 309947 | 2305.87 | 544 | 528 | 134.2 |
| D | 1 | 47 | 136133 | 1010.56 | 544 | 528 | 134.2 |
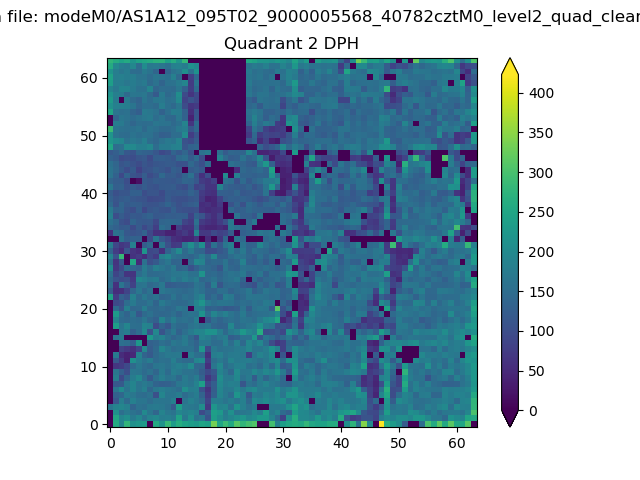
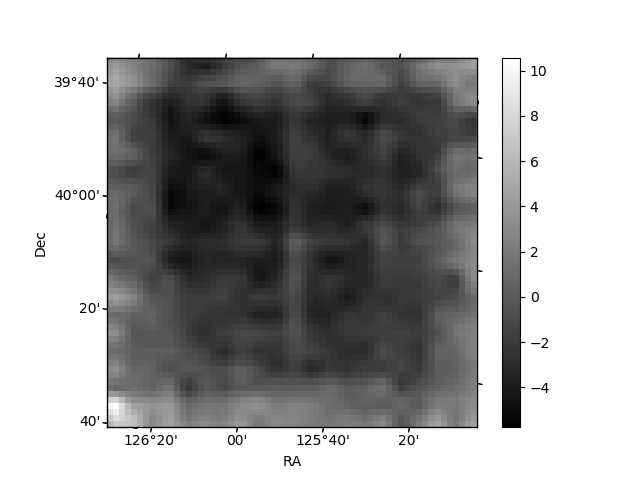
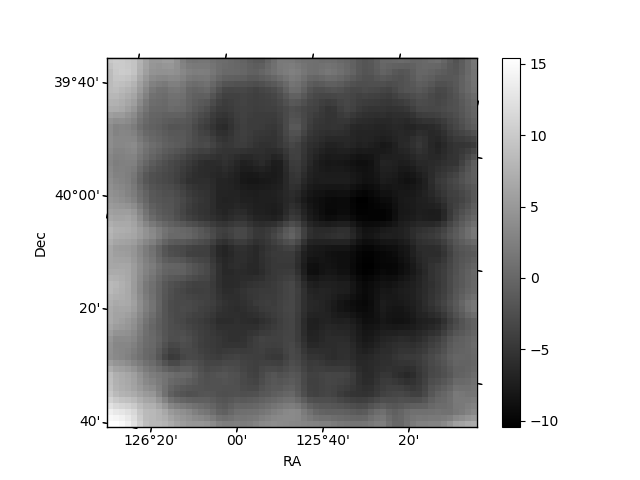
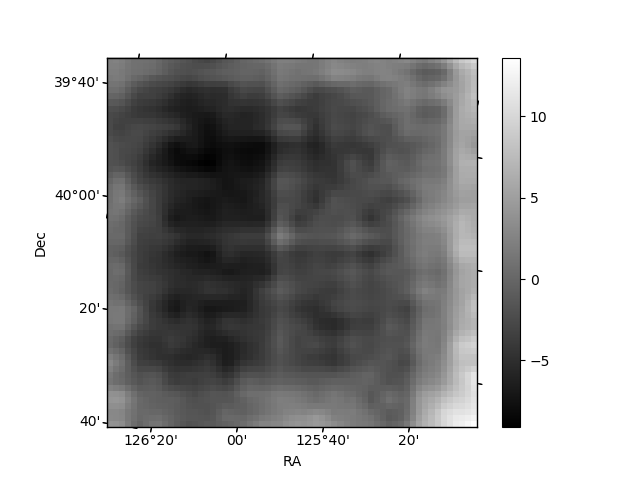
Histogram calculated using DETX and DETY for each event in the final _common_clean file
| Quadrant A |  |
 |
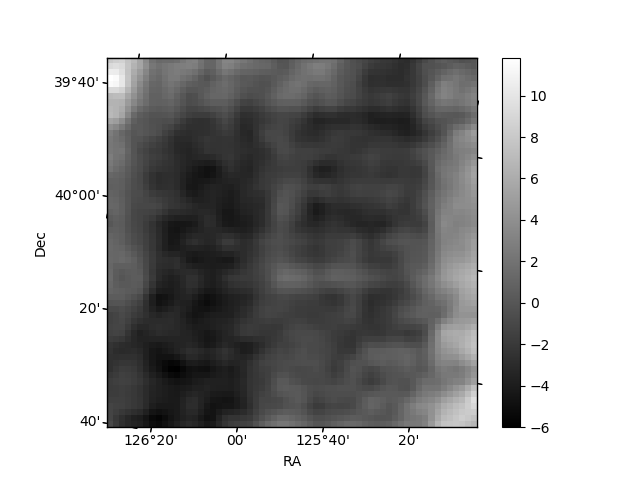
Quadrant B |
|---|---|---|---|
| Quadrant D |  |
 |
Quadrant C |
| Plot type | Count rate plots | Images |
|---|---|---|
| Comparison with Poisson distribution Blue bars denote a histogram of data divided into 1 sec bins. Red curve is a Poisson curve with rate = median count rate of data. |
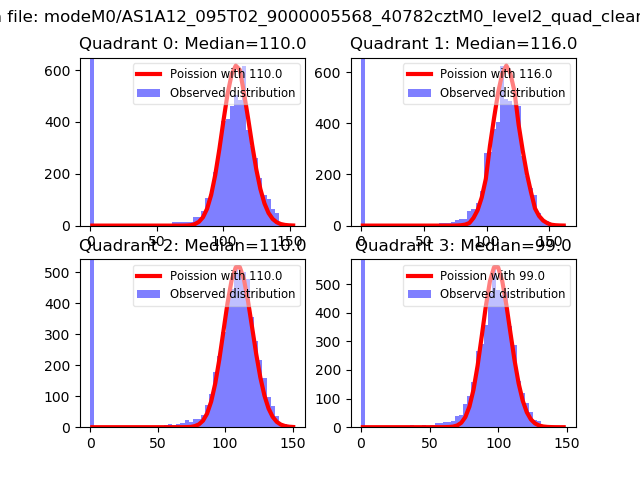 |
 |
| Quadrant-wise count rates Data is divided into 100 sec bins |
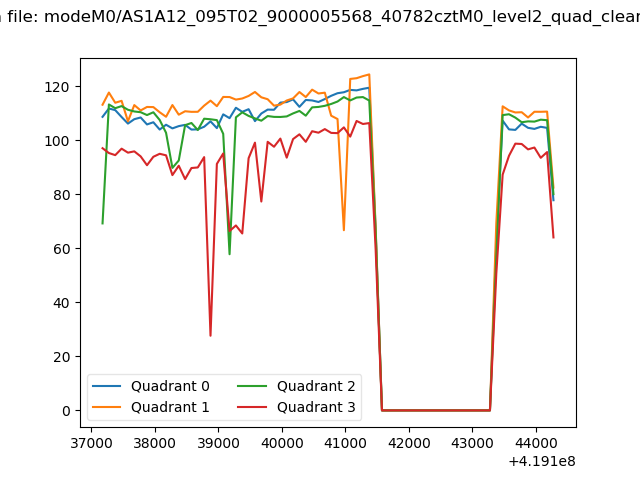 |
|
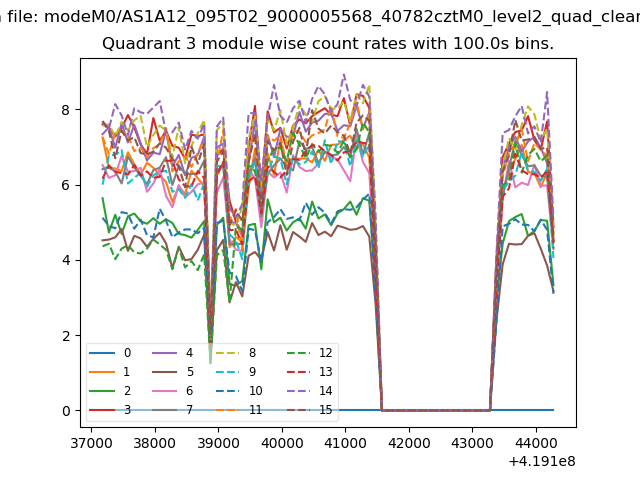
| Module-wise count rates for Quadrant A Data is divided into 100 sec bins |
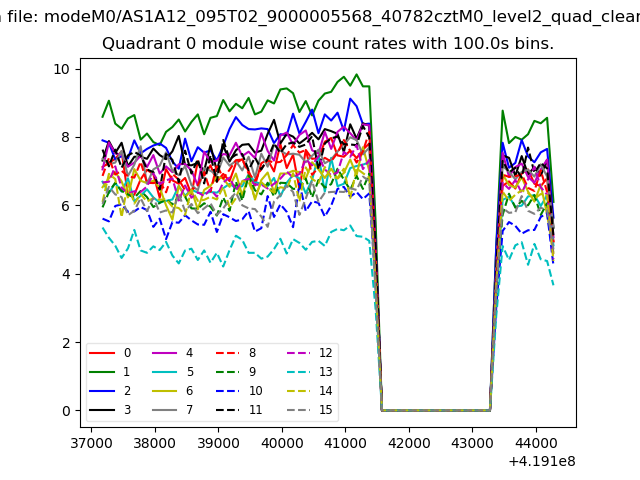 |
 |
| Module-wise count rates for Quadrant B Data is divided into 100 sec bins |
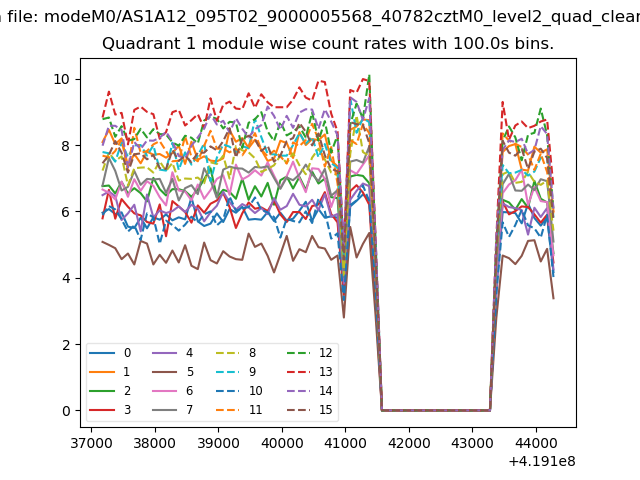 |
 |
| Module-wise count rates for Quadrant C Data is divided into 100 sec bins |
 |
 |
| Module-wise count rates for Quadrant D Data is divided into 100 sec bins |
 |
 |
| Parameter | Plot |
|---|---|
| CZT HV Monitor | 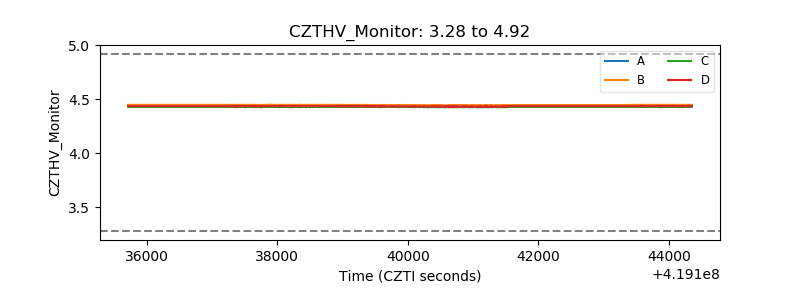 |
| D_VDD | 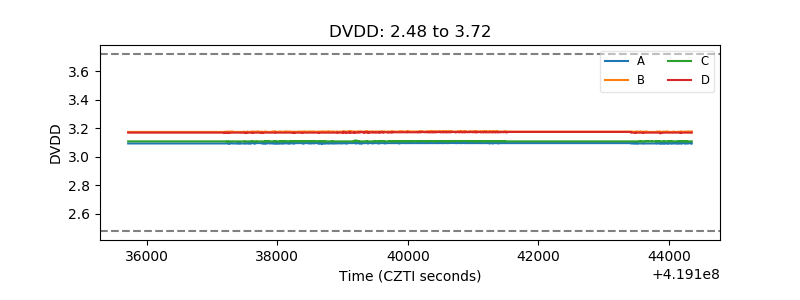 |
| Temperature 1 | 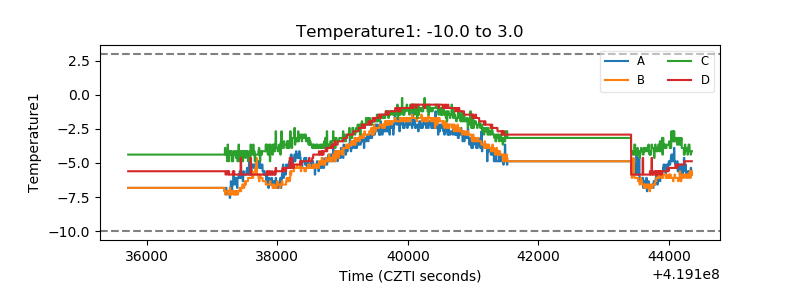 |
| Veto HV Monitor | 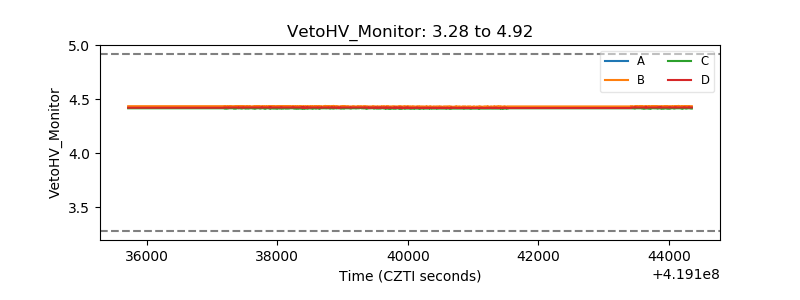 |
| Veto LLD | 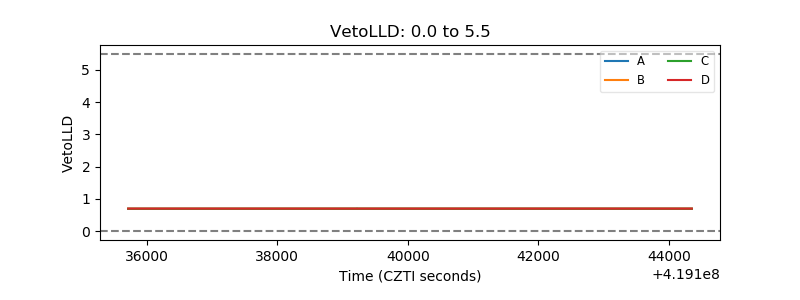 |
| Alpha Counter | 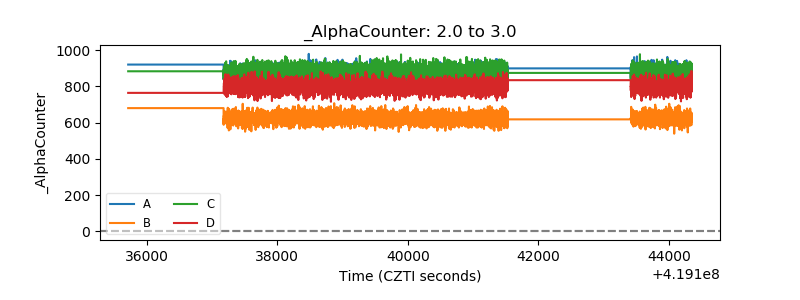 |
| _CPM_Rate | 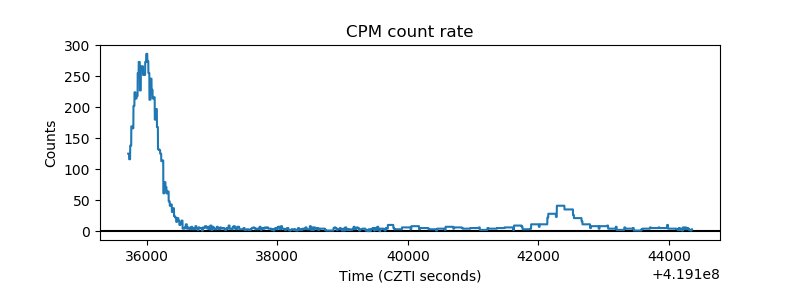 |
| CZT Counter | 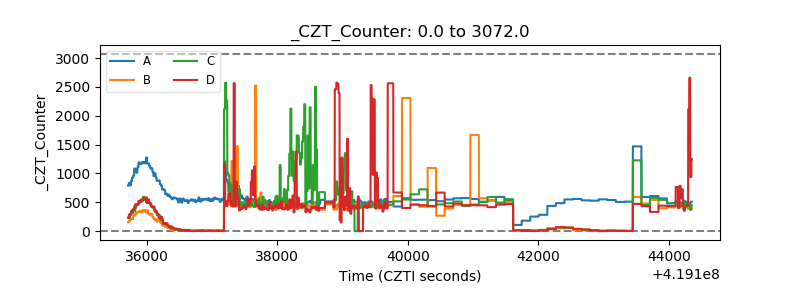 |
| +2.5 Volts monitor | 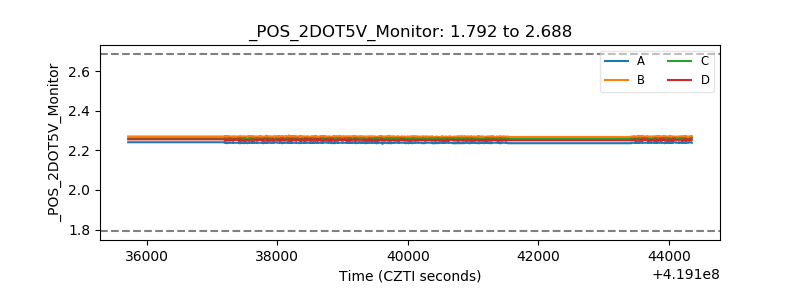 |
| +5 Volts monitor | 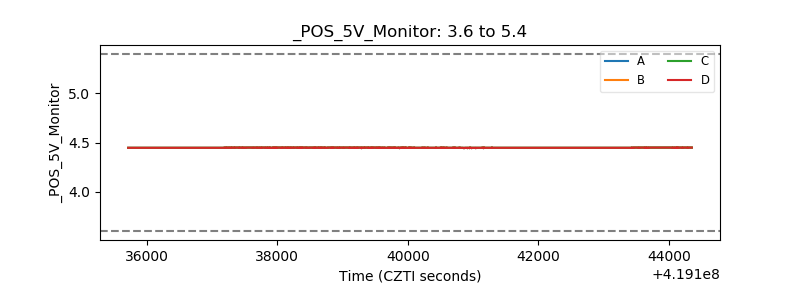 |
| _ROLL_ROT | 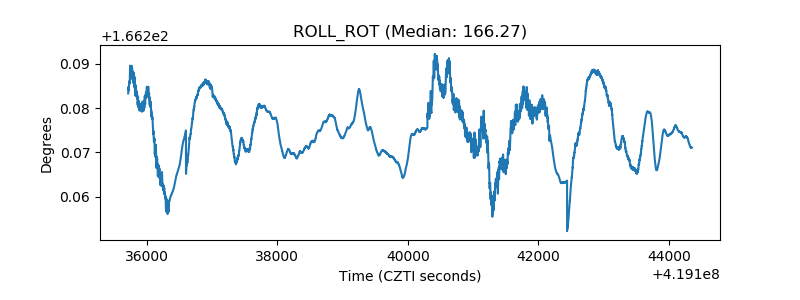 |
| _Roll_DEC |  |
| _Roll_RA | 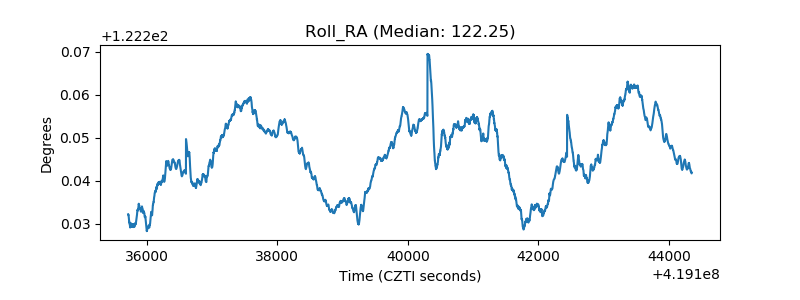 |
| Veto Counter |  |