| Param | Original file | Final file |
|---|---|---|
| Filename | modeM0/AS1A12_095T02_9000005568_40783cztM0_level2.fits | modeM0/AS1A12_095T02_9000005568_40783cztM0_level2_quad_clean.evt |
| Size (bytes) | 342,512,640 | 90,360,000 |
| Size | 326.6 MB | 86.2 MB |
| Events in quadrant A | 2,978,652 | 603,820 |
| Events in quadrant B | 2,632,644 | 629,097 |
| Events in quadrant C | 2,741,840 | 597,708 |
| Events in quadrant D | 3,891,414 | 515,499 |
| Mode M9 | |||
|---|---|---|---|
| Quadrant | BADHDUFLAG | Total packets | Discarded packets |
| A | 0 | 31 | 0 |
| B | 0 | 31 | 0 |
| C | 0 | 31 | 0 |
| D | 0 | 32 | 0 |
| Mode SS | |||
|---|---|---|---|
| Quadrant | BADHDUFLAG | Total packets | Discarded packets |
| A | 0 | 114 | 0 |
| B | 0 | 114 | 0 |
| C | 0 | 114 | 0 |
| D | 0 | 114 | 0 |
| Mode M0 | |||
|---|---|---|---|
| Quadrant | BADHDUFLAG | Total packets | Discarded packets |
| A | 0 | 12011 | 3 |
| B | 0 | 11634 | 2 |
| C | 0 | 11626 | 2 |
| D | 0 | 15563 | 2 |
| Quadrant | Total seconds | Saturated seconds | Saturation percentage |
|---|---|---|---|
| A | 5572 | 16 | 0.287150% |
| B | 5572 | 18 | 0.323044% |
| C | 5572 | 25 | 0.448672% |
| D | 5572 | 402 | 7.214645% |
Noise dominated data is calculated using 1-second bins in cleaned event files. If a bin has >2000 counts, and if more than 50% of those come from <1% of pixels, then it is considered to be noise-dominated and hence unusable.
| Quadrant | # 1 sec bins | Bins with >0 counts | Bins with >2000 counts | High rate bins dominated by noise | Noise dominated (total time) | Noise dominated (detector-on time) | Marked lightcurve |
|---|---|---|---|---|---|---|---|
| A | 7125 | 5573 | 7 | 7 | 0.10% | 0.13% | 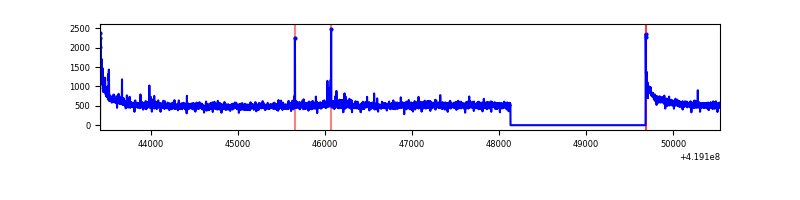 |
| B | 7125 | 5573 | 10 | 10 | 0.14% | 0.18% | 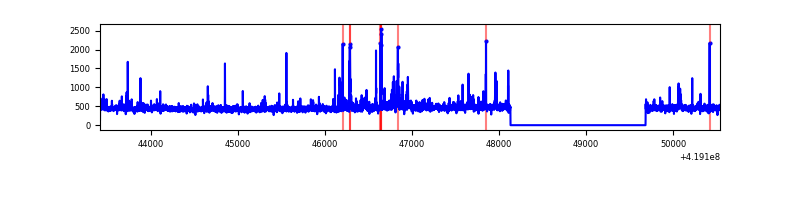 |
| C | 7125 | 5573 | 26 | 26 | 0.36% | 0.47% | 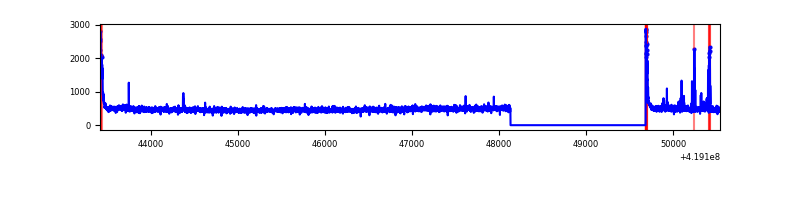 |
| D | 7125 | 5573 | 443 | 443 | 6.22% | 7.95% | 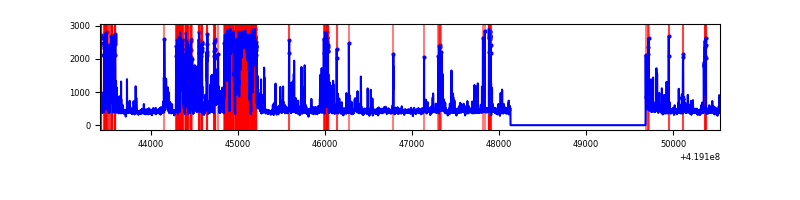 |
Top three noisy pixels from each quadrant. If the there are fewer than three noisy pixels in the level2.evt file, extra rows are filled as -1
| Pixel properties | Quadrant properties | ||||||
|---|---|---|---|---|---|---|---|
| Quadrant | DetID | PixID | Counts | Sigma | Mean | Median | Sigma |
| A | 10 | 83 | 517149 | 4081.52 | 613 | 598 | 126.6 |
| A | 12 | 189 | 29556 | 228.81 | 613 | 598 | 126.6 |
| A | 13 | 248 | 28540 | 220.78 | 613 | 598 | 126.6 |
| B | 15 | 85 | 51672 | 432.29 | 611 | 595 | 118.2 |
| B | 4 | 171 | 37827 | 315.11 | 611 | 595 | 118.2 |
| B | 7 | 202 | 35483 | 295.27 | 611 | 595 | 118.2 |
| C | 15 | 214 | 242537 | 1728.42 | 598 | 602 | 140.0 |
| C | 0 | 10 | 103055 | 731.94 | 598 | 602 | 140.0 |
| C | 14 | 254 | 57667 | 407.68 | 598 | 602 | 140.0 |
| D | 13 | 249 | 1056955 | 7441.76 | 580 | 563 | 142.0 |
| D | 2 | 249 | 255279 | 1794.35 | 580 | 563 | 142.0 |
| D | 1 | 47 | 192830 | 1354.43 | 580 | 563 | 142.0 |
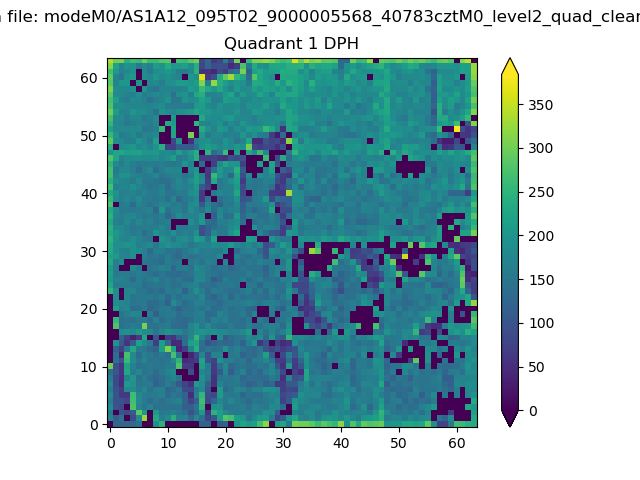
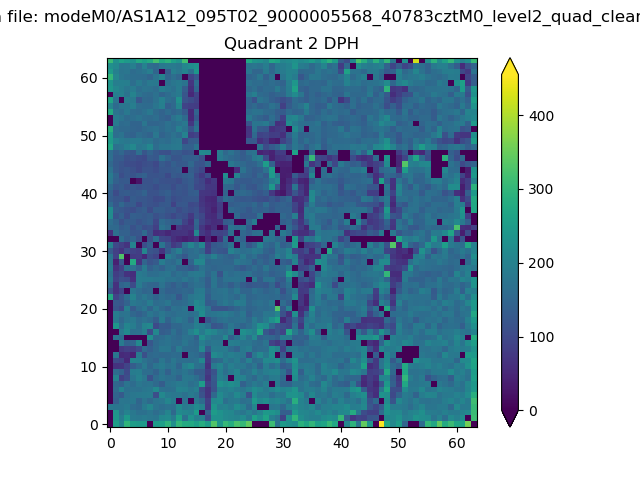
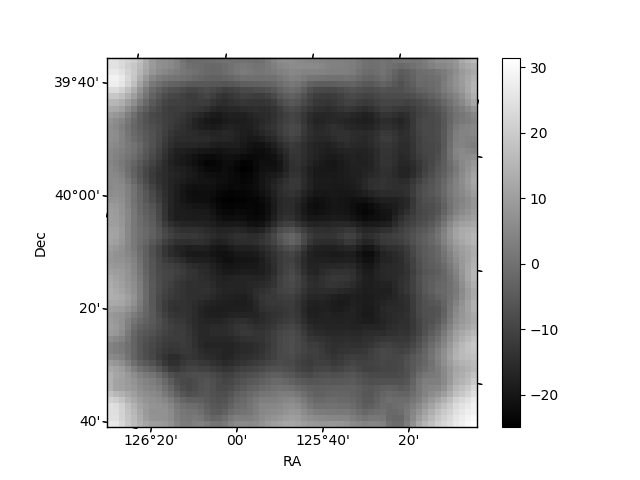
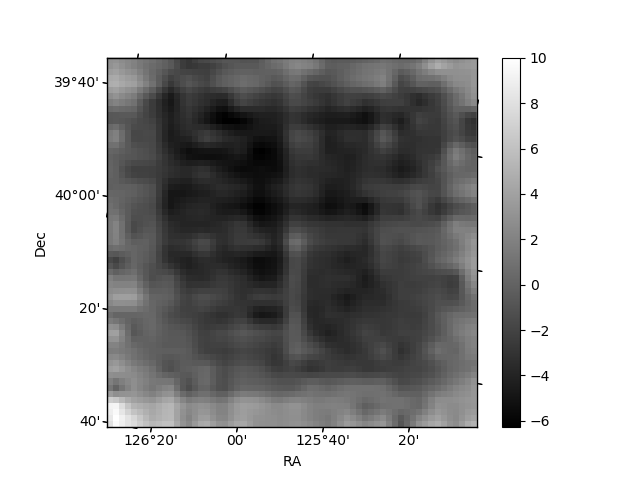
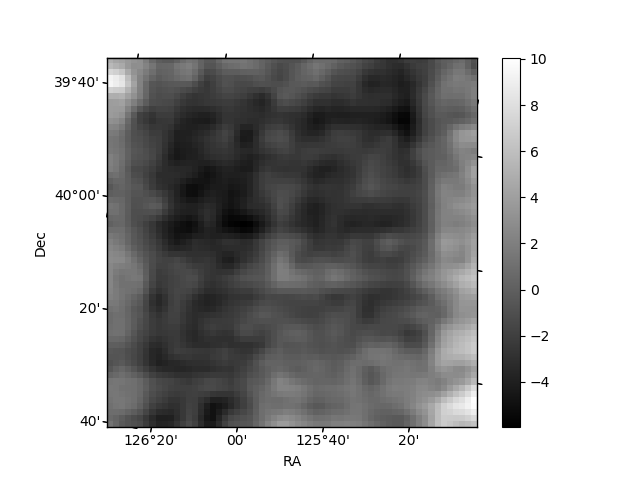
Histogram calculated using DETX and DETY for each event in the final _common_clean file
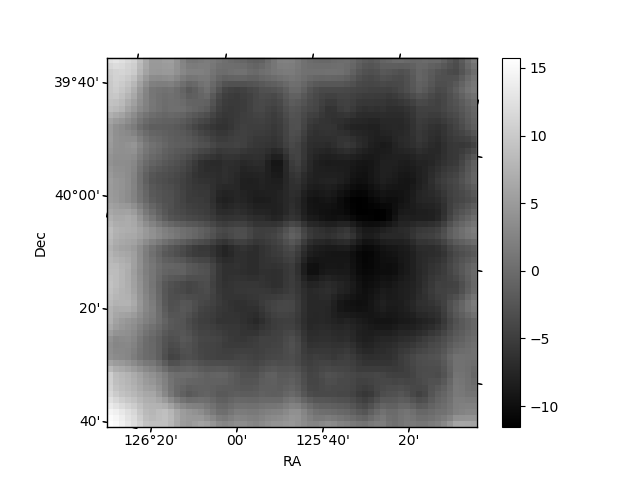
| Quadrant A |  |
 |
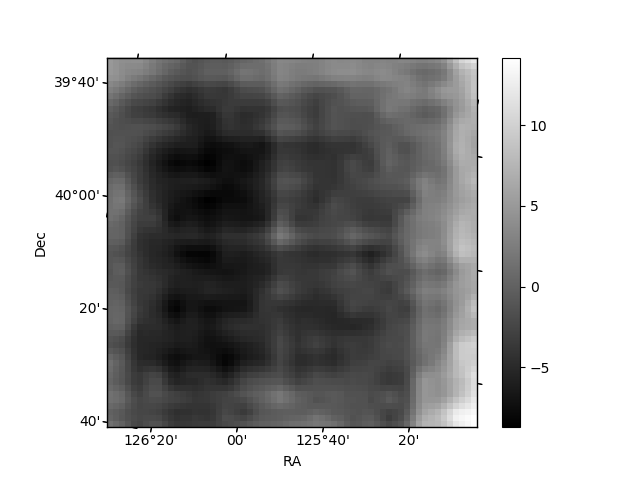
Quadrant B |
|---|---|---|---|
| Quadrant D | 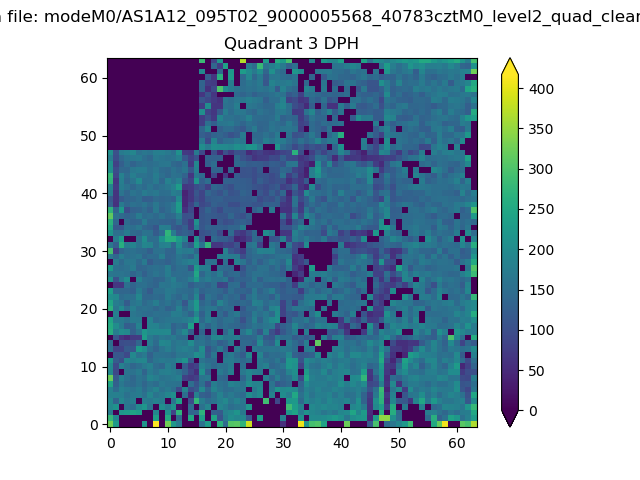 |
 |
Quadrant C |
| Plot type | Count rate plots | Images |
|---|---|---|
| Comparison with Poisson distribution Blue bars denote a histogram of data divided into 1 sec bins. Red curve is a Poisson curve with rate = median count rate of data. |
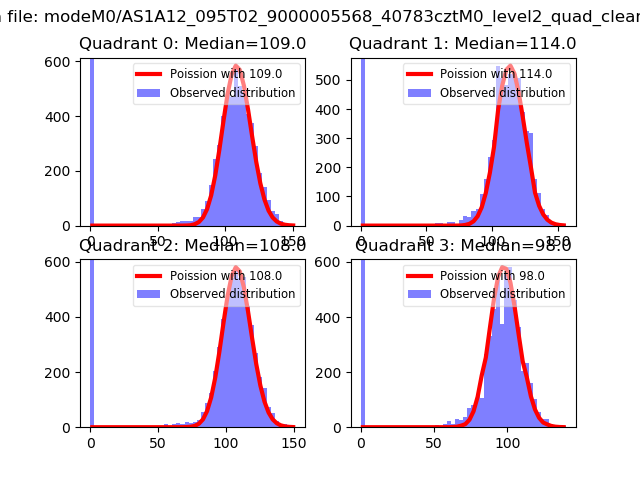 |
 |
| Quadrant-wise count rates Data is divided into 100 sec bins |
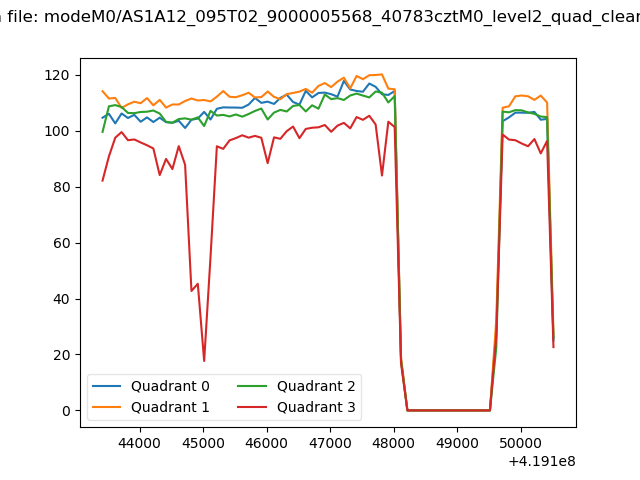 |
|
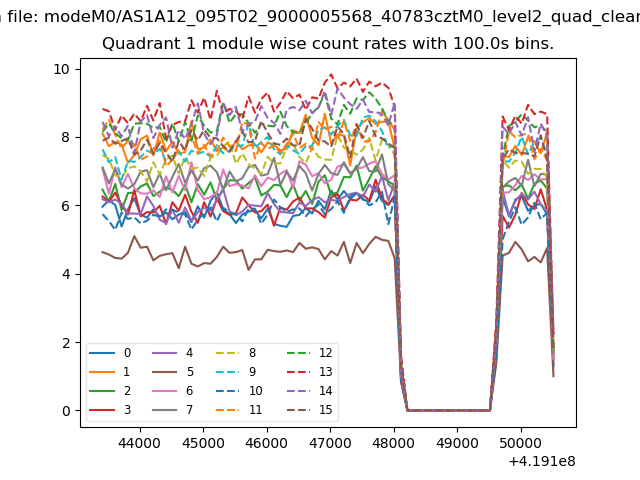
| Module-wise count rates for Quadrant A Data is divided into 100 sec bins |
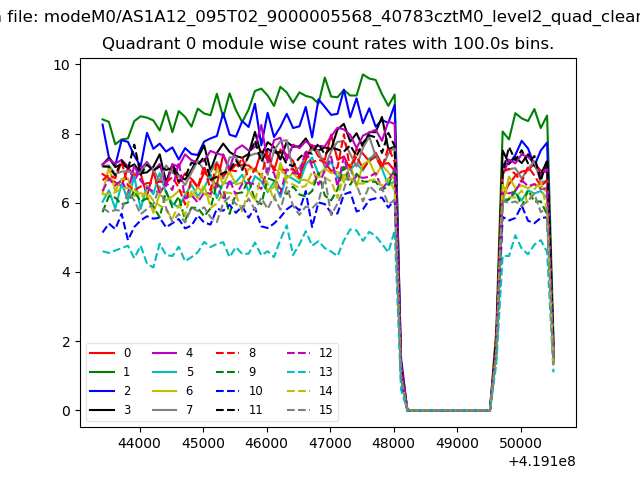 |
 |
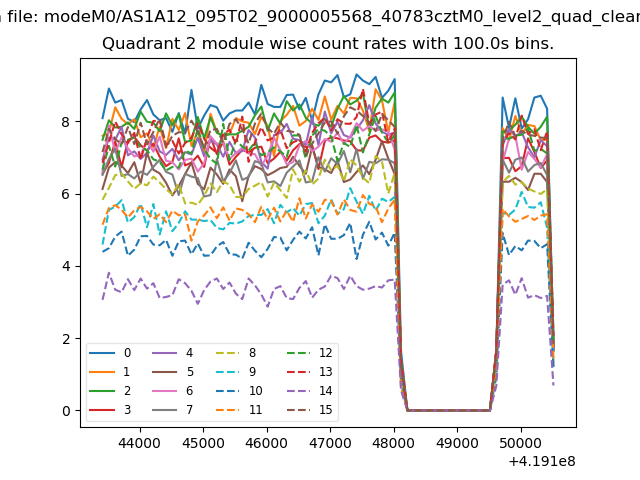
| Module-wise count rates for Quadrant B Data is divided into 100 sec bins |
 |
 |
| Module-wise count rates for Quadrant C Data is divided into 100 sec bins |
 |
 |
| Module-wise count rates for Quadrant D Data is divided into 100 sec bins |
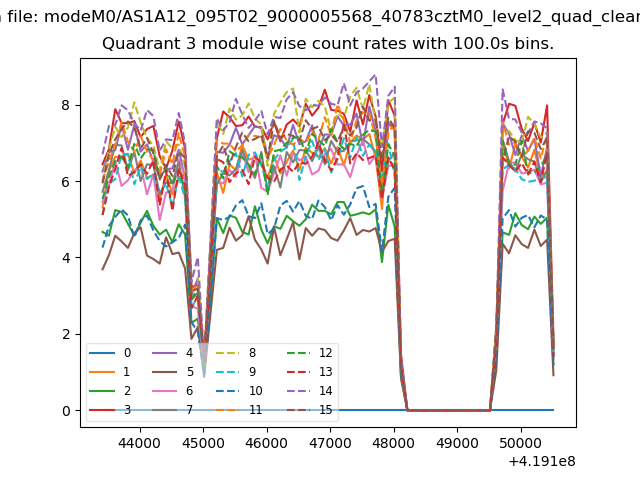 |
 |
| Parameter | Plot |
|---|---|
| CZT HV Monitor | 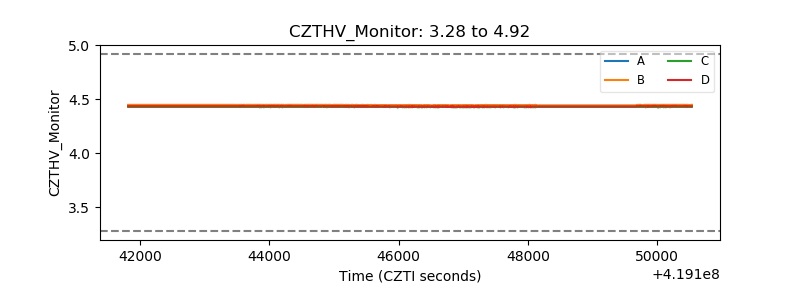 |
| D_VDD | 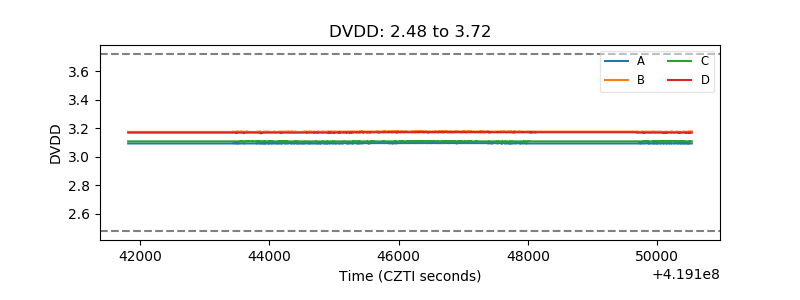 |
| Temperature 1 | 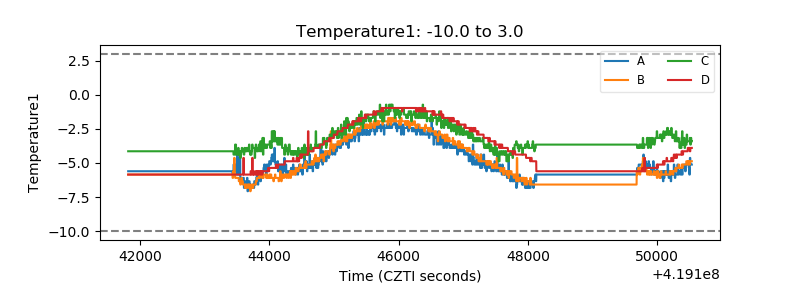 |
| Veto HV Monitor | 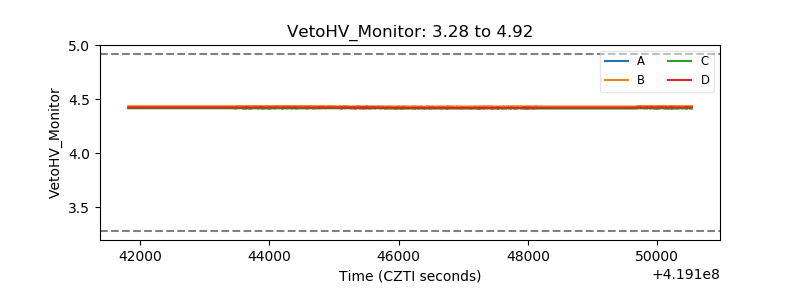 |
| Veto LLD | 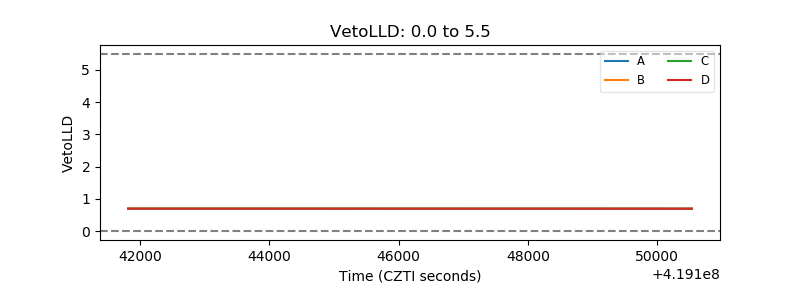 |
| Alpha Counter | 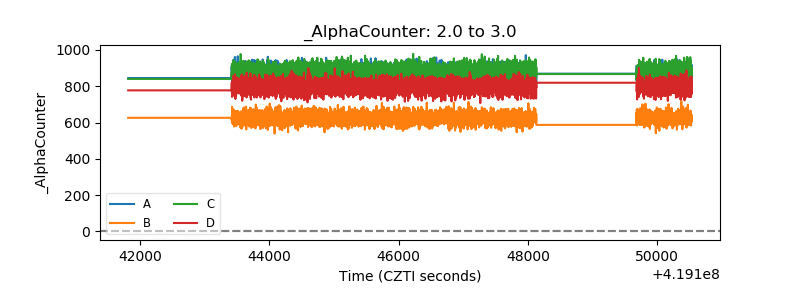 |
| _CPM_Rate | 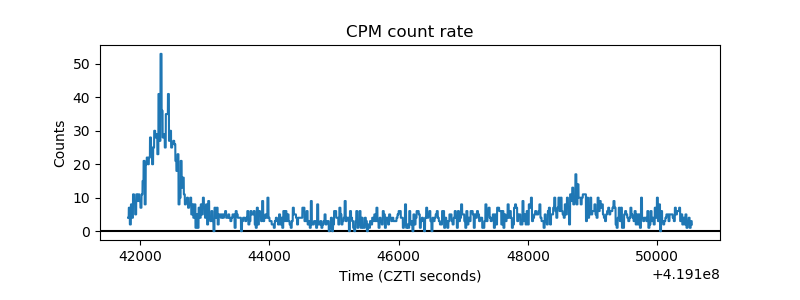 |
| CZT Counter | 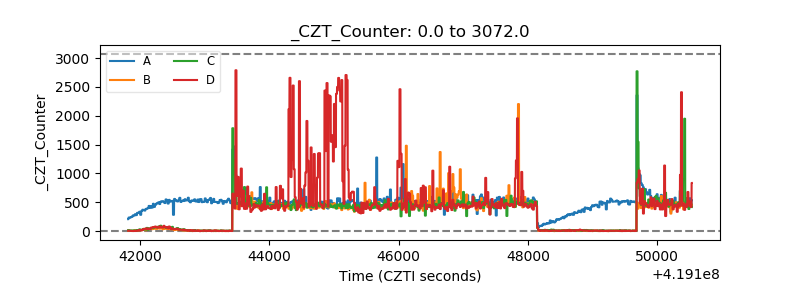 |
| +2.5 Volts monitor | 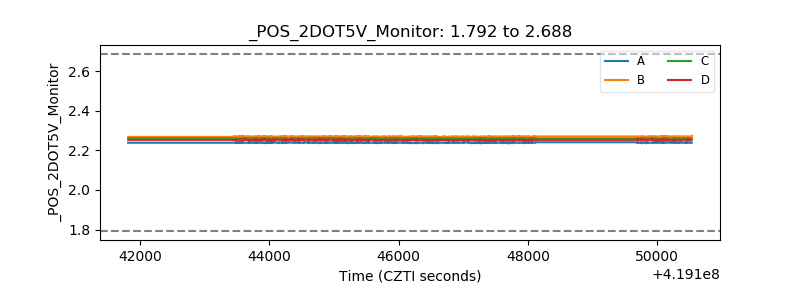 |
| +5 Volts monitor | 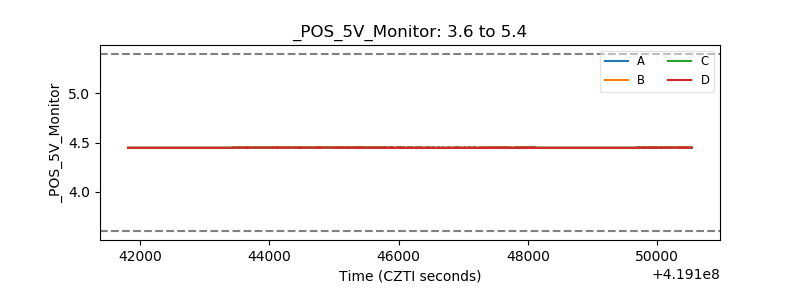 |
| _ROLL_ROT | 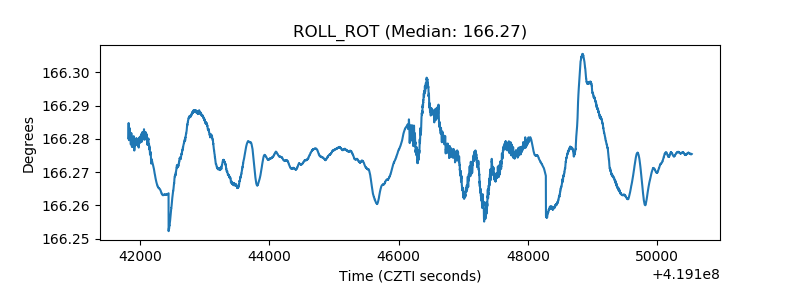 |
| _Roll_DEC | 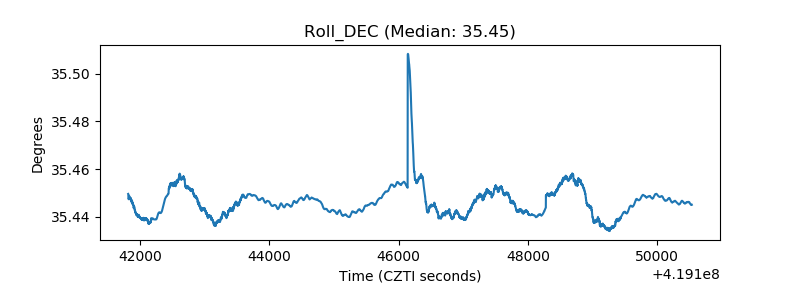 |
| _Roll_RA | 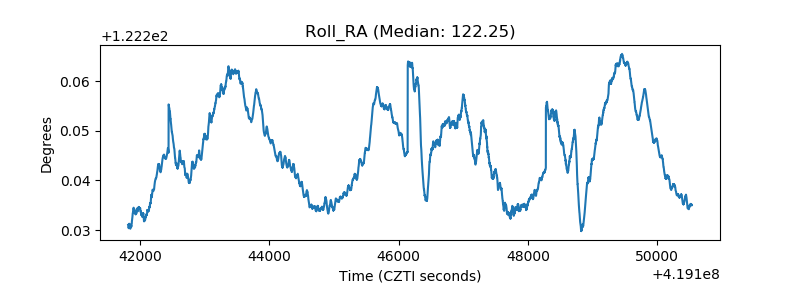 |
| Veto Counter | 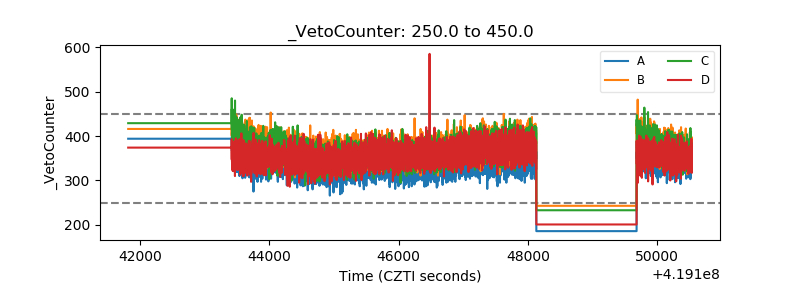 |