| Param | Original file | Final file |
|---|---|---|
| Filename | modeM0/AS1A12_095T02_9000005568_40784cztM0_level2.fits | modeM0/AS1A12_095T02_9000005568_40784cztM0_level2_quad_clean.evt |
| Size (bytes) | 350,490,240 | 97,801,920 |
| Size | 334.3 MB | 93.3 MB |
| Events in quadrant A | 3,283,402 | 650,438 |
| Events in quadrant B | 2,787,850 | 675,585 |
| Events in quadrant C | 3,174,113 | 640,654 |
| Events in quadrant D | 3,259,443 | 573,551 |
| Mode M9 | |||
|---|---|---|---|
| Quadrant | BADHDUFLAG | Total packets | Discarded packets |
| A | 0 | 28 | 0 |
| B | 0 | 28 | 0 |
| C | 0 | 28 | 0 |
| D | 0 | 28 | 0 |
| Mode SS | |||
|---|---|---|---|
| Quadrant | BADHDUFLAG | Total packets | Discarded packets |
| A | 0 | 124 | 0 |
| B | 0 | 124 | 0 |
| C | 0 | 124 | 0 |
| D | 0 | 124 | 0 |
| Mode M0 | |||
|---|---|---|---|
| Quadrant | BADHDUFLAG | Total packets | Discarded packets |
| A | 0 | 13270 | 3 |
| B | 0 | 12458 | 2 |
| C | 0 | 13166 | 2 |
| D | 0 | 14041 | 2 |
| Quadrant | Total seconds | Saturated seconds | Saturation percentage |
|---|---|---|---|
| A | 6024 | 24 | 0.398406% |
| B | 6024 | 32 | 0.531208% |
| C | 6024 | 37 | 0.614210% |
| D | 6024 | 184 | 3.054449% |
Noise dominated data is calculated using 1-second bins in cleaned event files. If a bin has >2000 counts, and if more than 50% of those come from <1% of pixels, then it is considered to be noise-dominated and hence unusable.
| Quadrant | # 1 sec bins | Bins with >0 counts | Bins with >2000 counts | High rate bins dominated by noise | Noise dominated (total time) | Noise dominated (detector-on time) | Marked lightcurve |
|---|---|---|---|---|---|---|---|
| A | 8920 | 6026 | 14 | 14 | 0.16% | 0.23% | 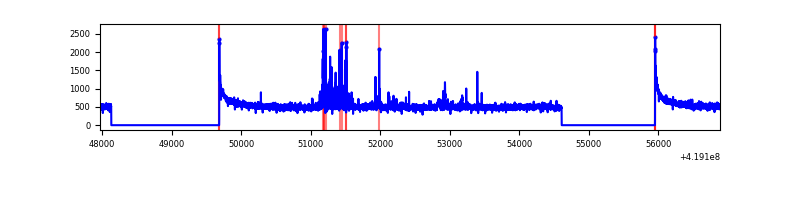 |
| B | 8920 | 6026 | 16 | 16 | 0.18% | 0.27% | 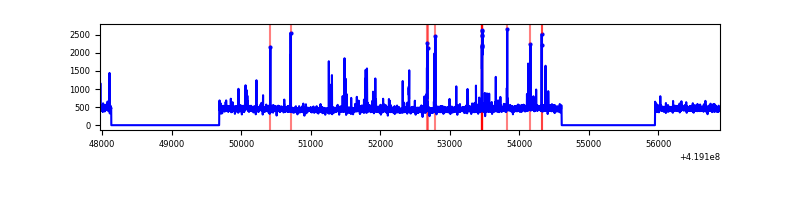 |
| C | 8920 | 6026 | 42 | 42 | 0.47% | 0.70% | 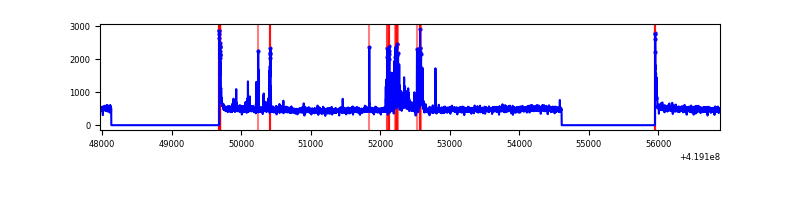 |
| D | 8920 | 6026 | 118 | 118 | 1.32% | 1.96% | 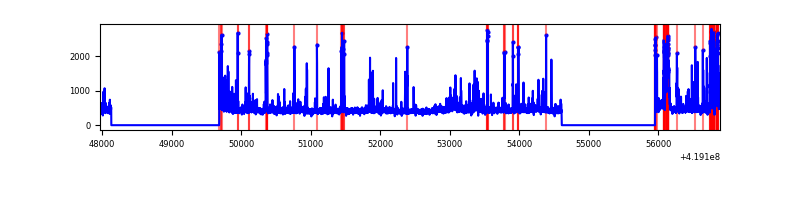 |
Top three noisy pixels from each quadrant. If the there are fewer than three noisy pixels in the level2.evt file, extra rows are filled as -1
| Pixel properties | Quadrant properties | ||||||
|---|---|---|---|---|---|---|---|
| Quadrant | DetID | PixID | Counts | Sigma | Mean | Median | Sigma |
| A | 10 | 83 | 545656 | 3968.01 | 664 | 649 | 137.4 |
| A | 13 | 248 | 104077 | 753.02 | 664 | 649 | 137.4 |
| A | 12 | 189 | 42150 | 302.15 | 664 | 649 | 137.4 |
| B | 5 | 255 | 89098 | 682.53 | 661 | 642 | 129.6 |
| B | 4 | 171 | 35121 | 266.04 | 661 | 642 | 129.6 |
| B | 0 | 190 | 23870 | 179.23 | 661 | 642 | 129.6 |
| C | 14 | 254 | 286039 | 1878.13 | 648 | 652 | 152.0 |
| C | 15 | 214 | 261333 | 1715.54 | 648 | 652 | 152.0 |
| C | 0 | 10 | 83756 | 546.91 | 648 | 652 | 152.0 |
| D | 13 | 249 | 339920 | 2168.96 | 638 | 621 | 156.4 |
| D | 2 | 249 | 132919 | 845.71 | 638 | 621 | 156.4 |
| D | 1 | 47 | 116995 | 743.92 | 638 | 621 | 156.4 |
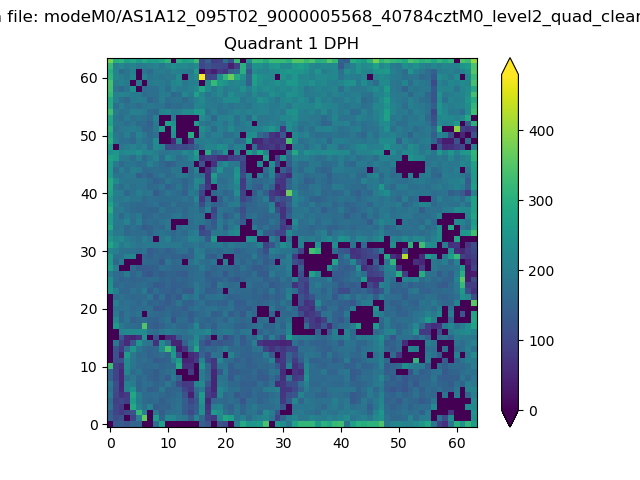
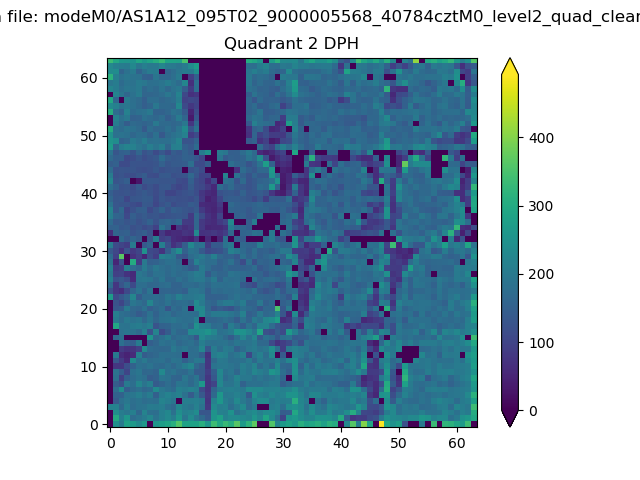
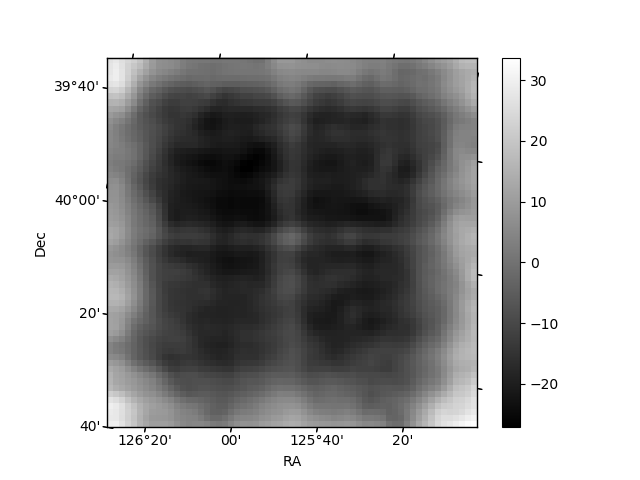
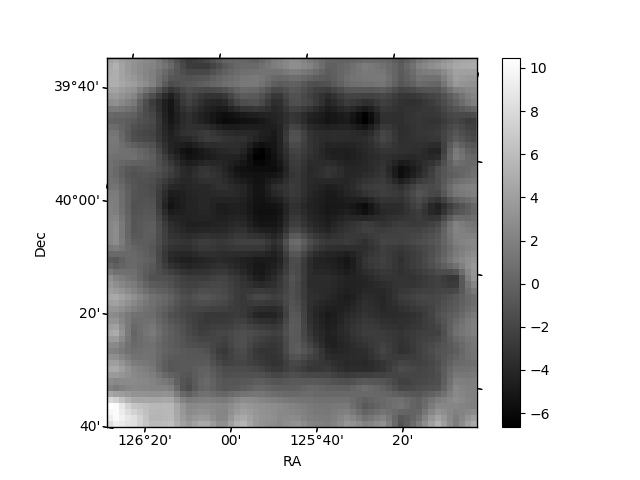
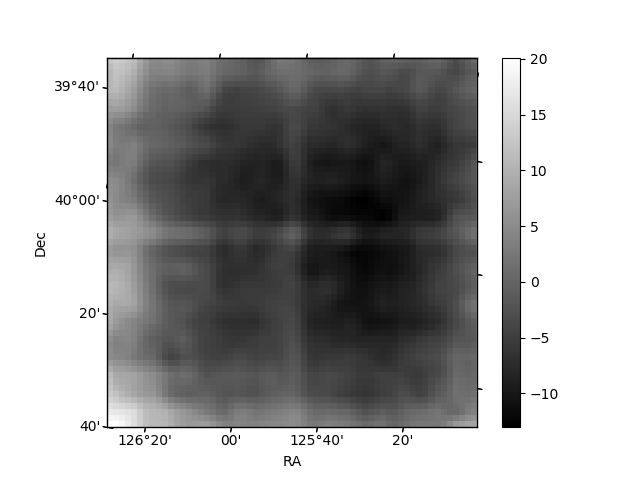
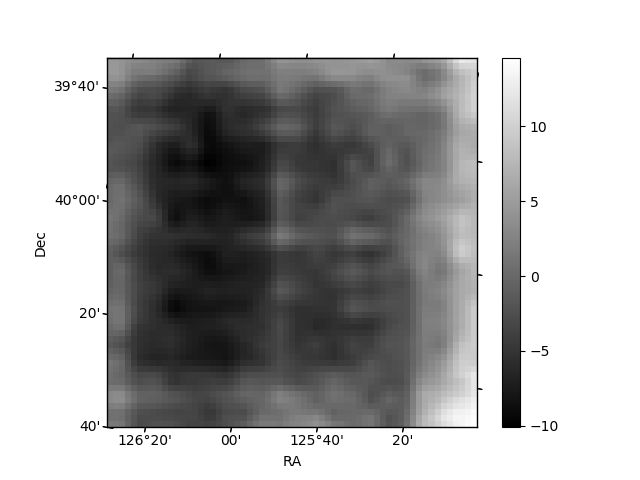
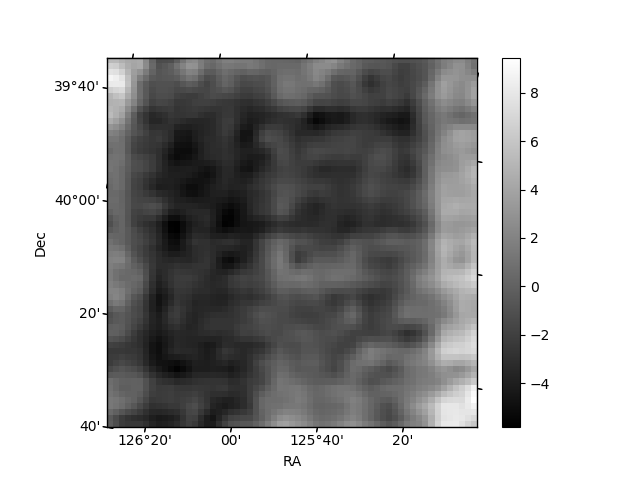
Histogram calculated using DETX and DETY for each event in the final _common_clean file
| Quadrant A |  |
 |
Quadrant B |
|---|---|---|---|
| Quadrant D | 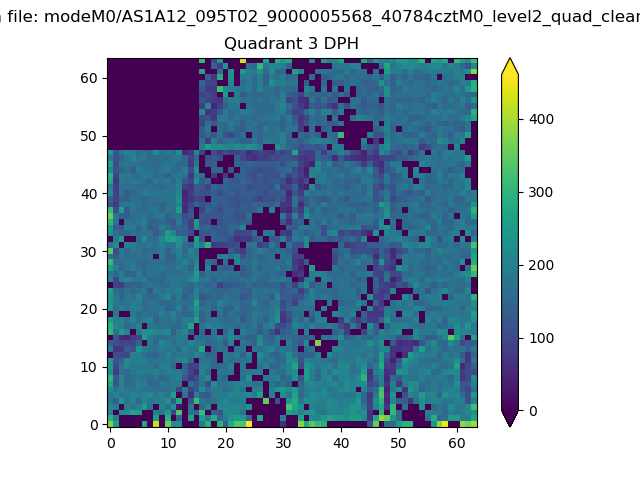 |
 |
Quadrant C |
| Plot type | Count rate plots | Images |
|---|---|---|
| Comparison with Poisson distribution Blue bars denote a histogram of data divided into 1 sec bins. Red curve is a Poisson curve with rate = median count rate of data. |
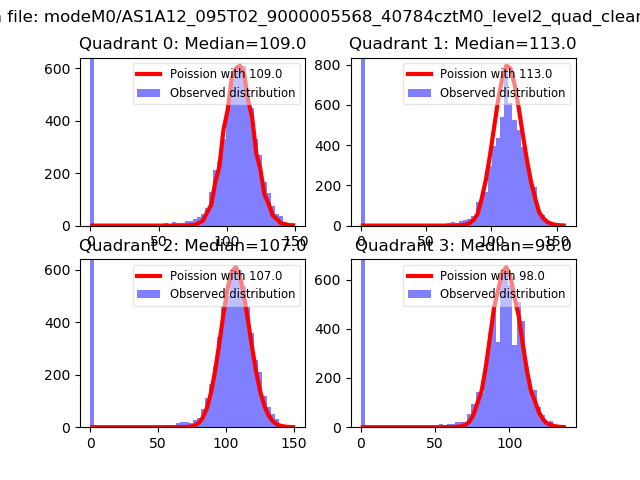 |
 |
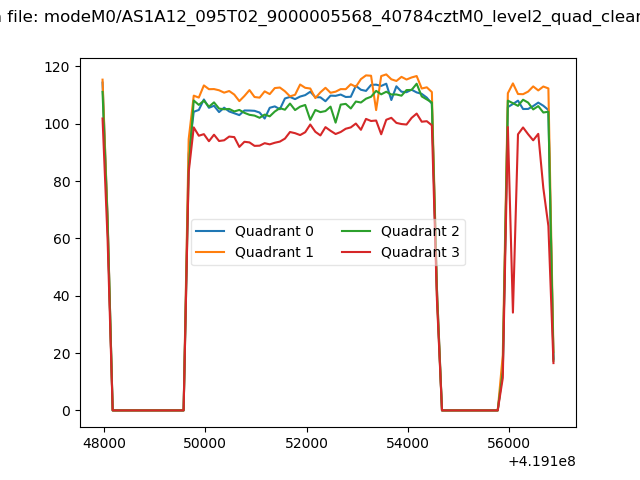
| Quadrant-wise count rates Data is divided into 100 sec bins |
 |
|
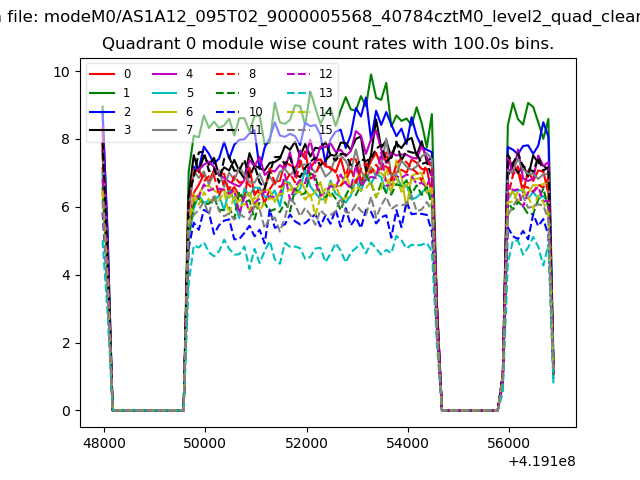
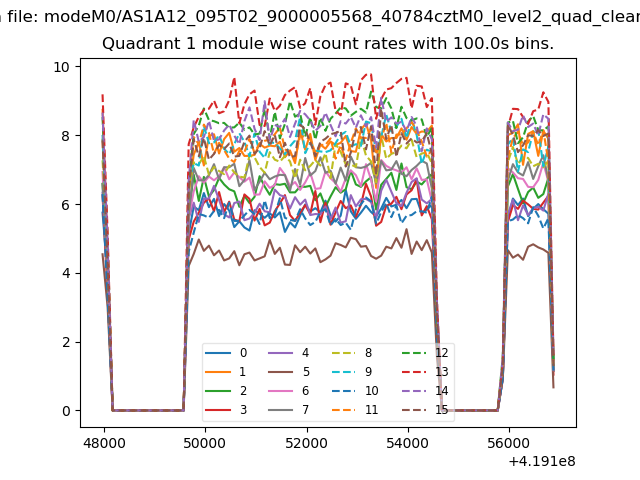
| Module-wise count rates for Quadrant A Data is divided into 100 sec bins |
 |
 |
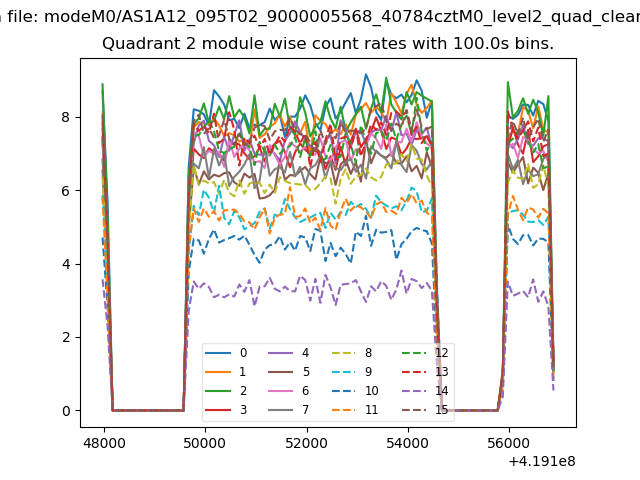
| Module-wise count rates for Quadrant B Data is divided into 100 sec bins |
 |
 |
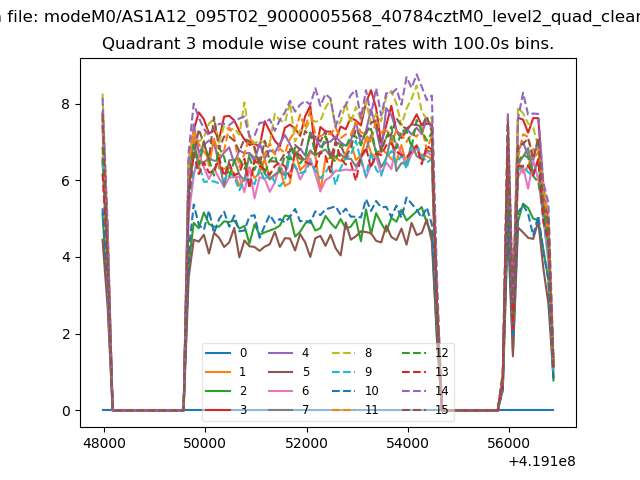
| Module-wise count rates for Quadrant C Data is divided into 100 sec bins |
 |
 |
| Module-wise count rates for Quadrant D Data is divided into 100 sec bins |
 |
 |
| Parameter | Plot |
|---|---|
| CZT HV Monitor | 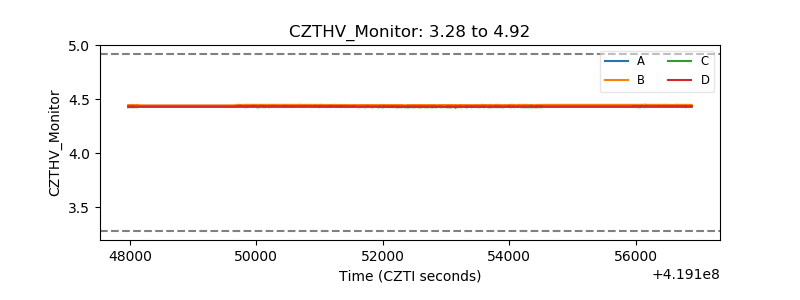 |
| D_VDD | 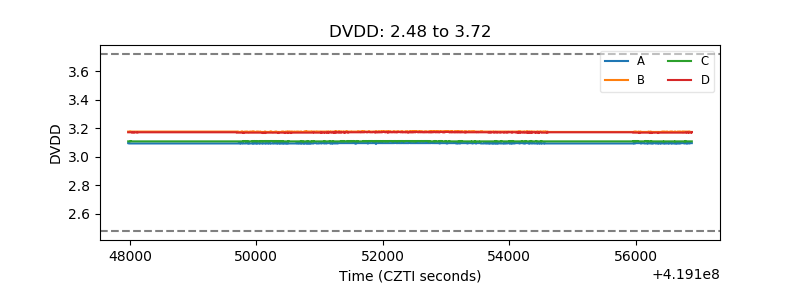 |
| Temperature 1 | 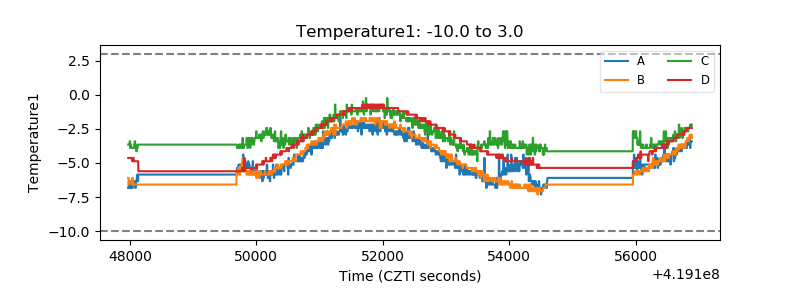 |
| Veto HV Monitor | 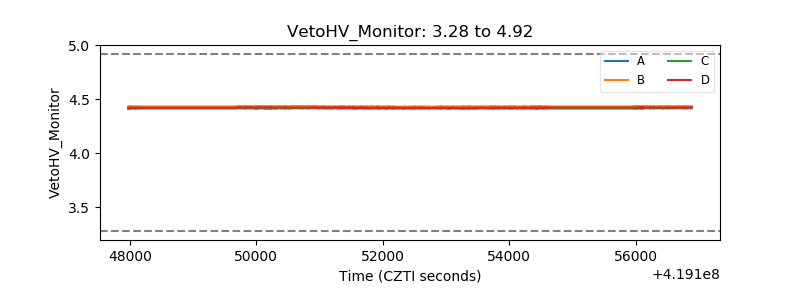 |
| Veto LLD | 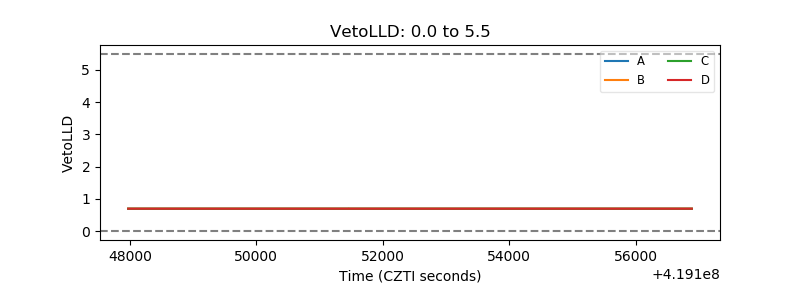 |
| Alpha Counter | 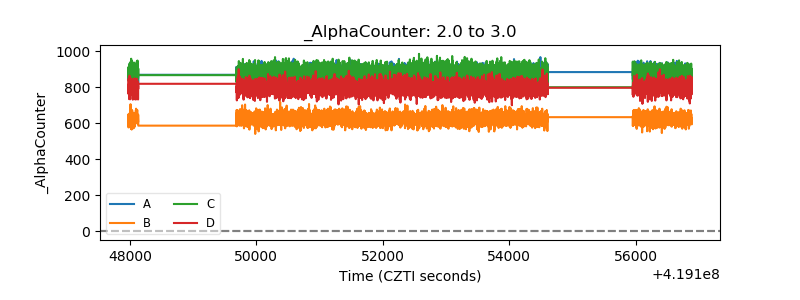 |
| _CPM_Rate | 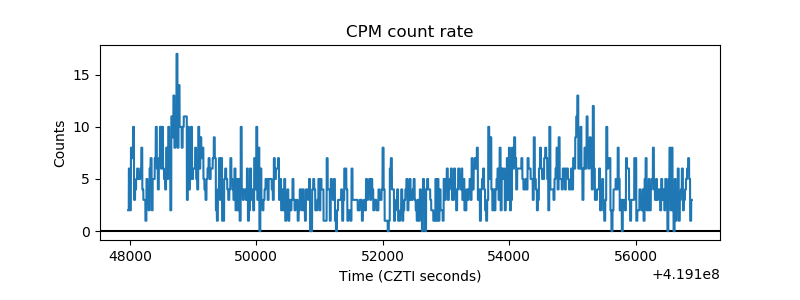 |
| CZT Counter | 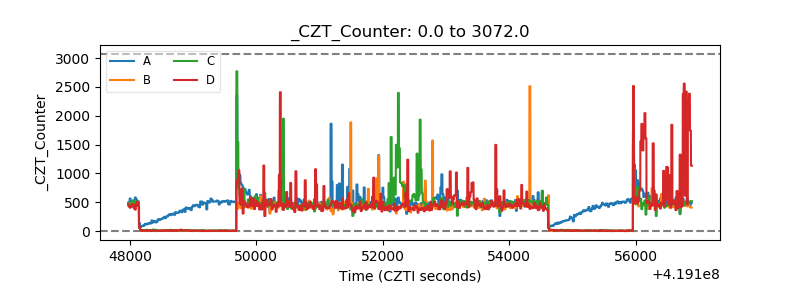 |
| +2.5 Volts monitor | 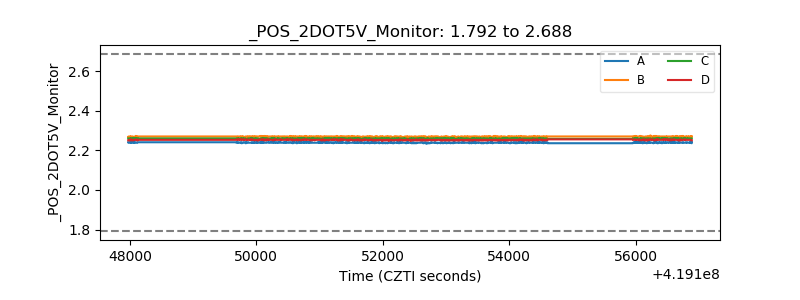 |
| +5 Volts monitor | 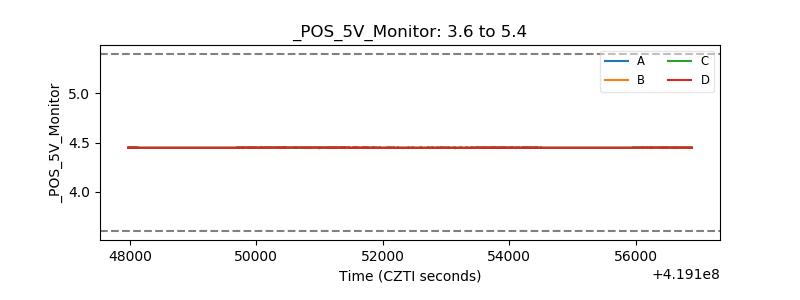 |
| _ROLL_ROT |  |
| _Roll_DEC | 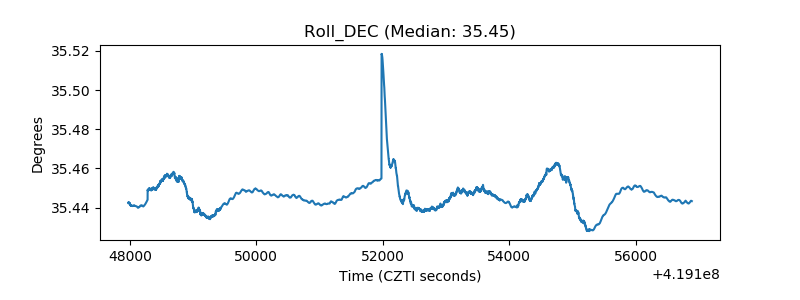 |
| _Roll_RA | 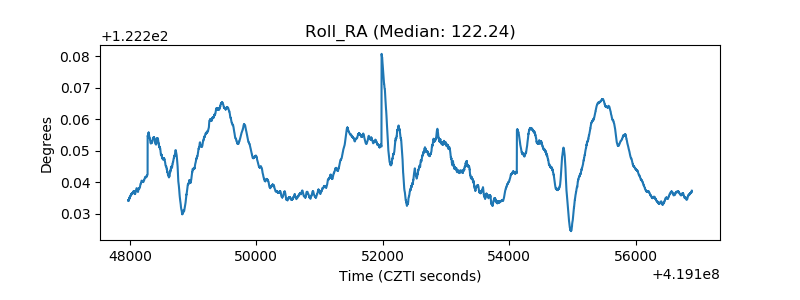 |
| Veto Counter | 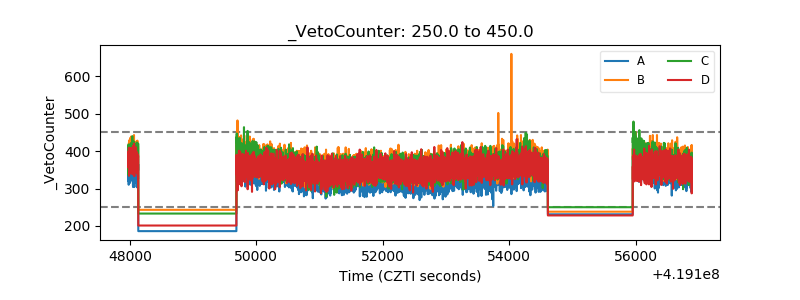 |