| Param | Original file | Final file |
|---|---|---|
| Filename | modeM0/AS1A12_095T02_9000005568_40785cztM0_level2.fits | modeM0/AS1A12_095T02_9000005568_40785cztM0_level2_quad_clean.evt |
| Size (bytes) | 385,260,480 | 103,314,240 |
| Size | 367.4 MB | 98.5 MB |
| Events in quadrant A | 3,361,577 | 691,594 |
| Events in quadrant B | 3,037,348 | 713,925 |
| Events in quadrant C | 3,212,041 | 677,063 |
| Events in quadrant D | 4,152,900 | 599,775 |
| Mode M9 | |||
|---|---|---|---|
| Quadrant | BADHDUFLAG | Total packets | Discarded packets |
| A | 0 | 26 | 0 |
| B | 0 | 26 | 0 |
| C | 0 | 26 | 0 |
| D | 0 | 26 | 0 |
| Mode SS | |||
|---|---|---|---|
| Quadrant | BADHDUFLAG | Total packets | Discarded packets |
| A | 0 | 128 | 0 |
| B | 0 | 128 | 0 |
| C | 0 | 128 | 0 |
| D | 0 | 128 | 0 |
| Mode M0 | |||
|---|---|---|---|
| Quadrant | BADHDUFLAG | Total packets | Discarded packets |
| A | 0 | 13751 | 3 |
| B | 0 | 13371 | 2 |
| C | 0 | 13560 | 5 |
| D | 0 | 16777 | 2 |
| Quadrant | Total seconds | Saturated seconds | Saturation percentage |
|---|---|---|---|
| A | 6388 | 13 | 0.203507% |
| B | 6388 | 38 | 0.594865% |
| C | 6386 | 60 | 0.939555% |
| D | 6388 | 332 | 5.197245% |
Noise dominated data is calculated using 1-second bins in cleaned event files. If a bin has >2000 counts, and if more than 50% of those come from <1% of pixels, then it is considered to be noise-dominated and hence unusable.
| Quadrant | # 1 sec bins | Bins with >0 counts | Bins with >2000 counts | High rate bins dominated by noise | Noise dominated (total time) | Noise dominated (detector-on time) | Marked lightcurve |
|---|---|---|---|---|---|---|---|
| A | 9044 | 6389 | 4 | 4 | 0.04% | 0.06% | 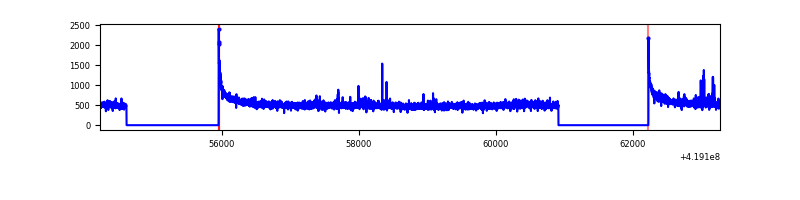 |
| B | 9044 | 6390 | 19 | 19 | 0.21% | 0.30% | 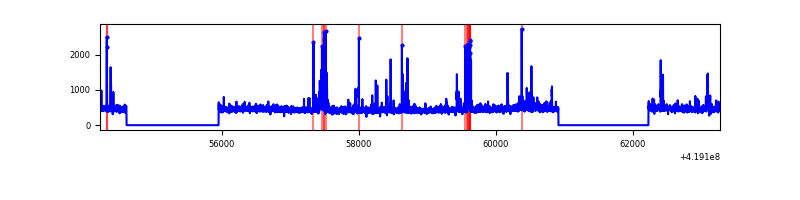 |
| C | 9044 | 6389 | 50 | 50 | 0.55% | 0.78% | 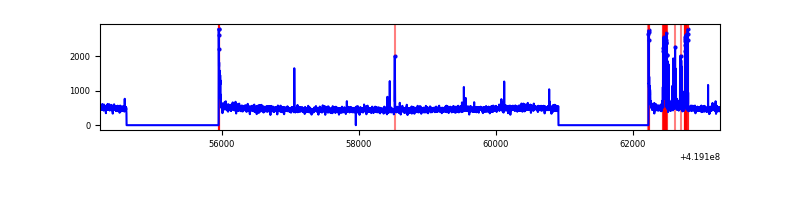 |
| D | 9044 | 6390 | 265 | 265 | 2.93% | 4.15% | 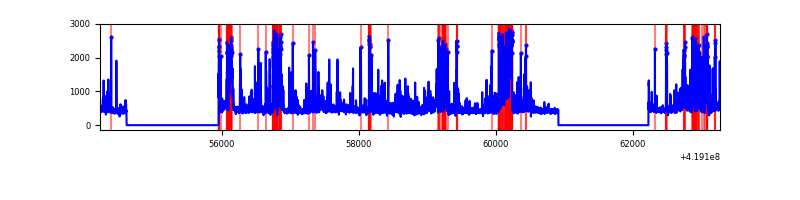 |
Top three noisy pixels from each quadrant. If the there are fewer than three noisy pixels in the level2.evt file, extra rows are filled as -1
| Pixel properties | Quadrant properties | ||||||
|---|---|---|---|---|---|---|---|
| Quadrant | DetID | PixID | Counts | Sigma | Mean | Median | Sigma |
| A | 10 | 83 | 572504 | 3907.58 | 705 | 690 | 146.3 |
| A | 13 | 248 | 35248 | 236.16 | 705 | 690 | 146.3 |
| A | 12 | 189 | 14240 | 92.6 | 705 | 690 | 146.3 |
| B | 5 | 255 | 157683 | 1137.73 | 702 | 681 | 138.0 |
| B | 4 | 171 | 38777 | 276.07 | 702 | 681 | 138.0 |
| B | 15 | 85 | 24994 | 176.19 | 702 | 681 | 138.0 |
| C | 15 | 214 | 275460 | 1710.55 | 688 | 693 | 160.6 |
| C | 14 | 254 | 190057 | 1178.88 | 688 | 693 | 160.6 |
| C | 0 | 10 | 61459 | 378.3 | 688 | 693 | 160.6 |
| D | 2 | 153 | 453637 | 2769.72 | 669 | 649 | 163.5 |
| D | 2 | 249 | 335726 | 2048.78 | 669 | 649 | 163.5 |
| D | 13 | 249 | 334856 | 2043.46 | 669 | 649 | 163.5 |
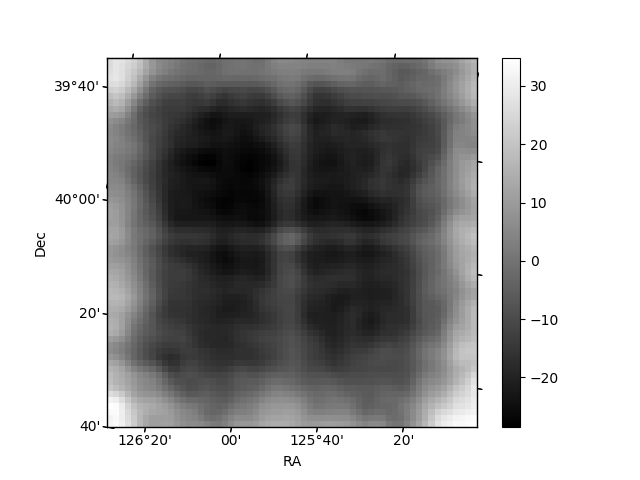
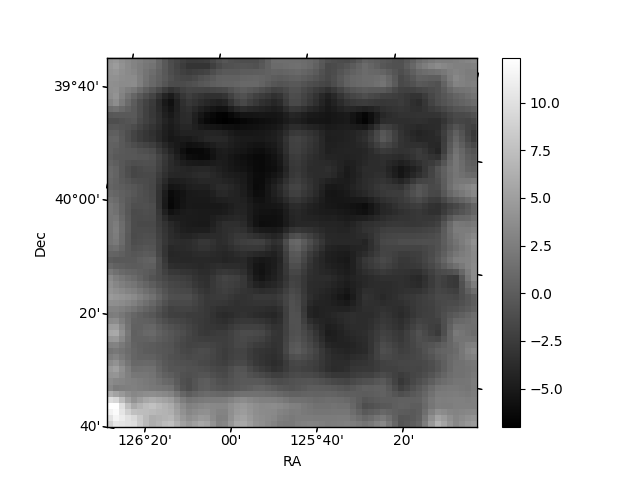
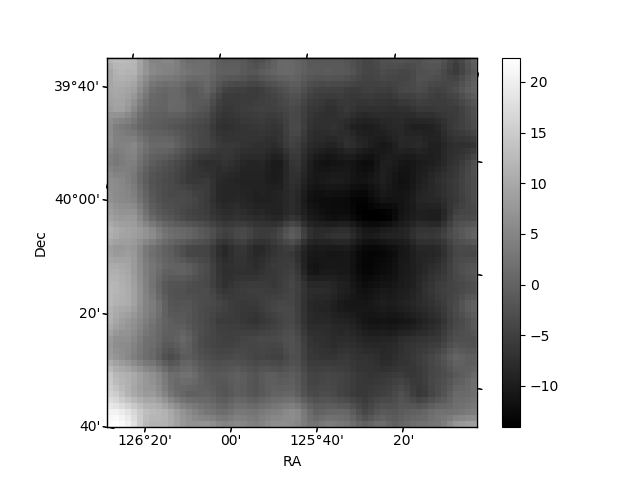
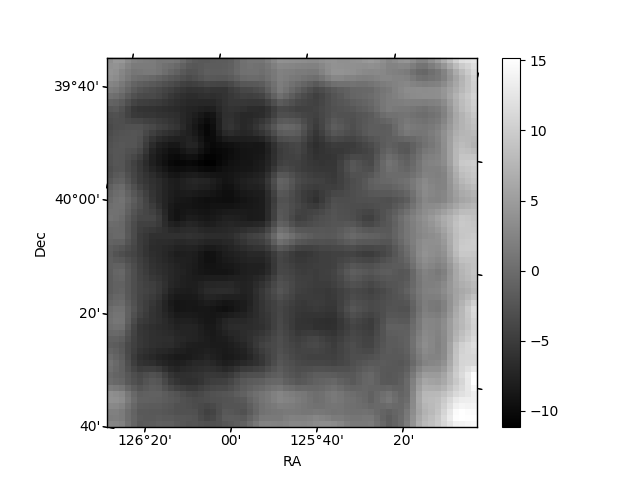
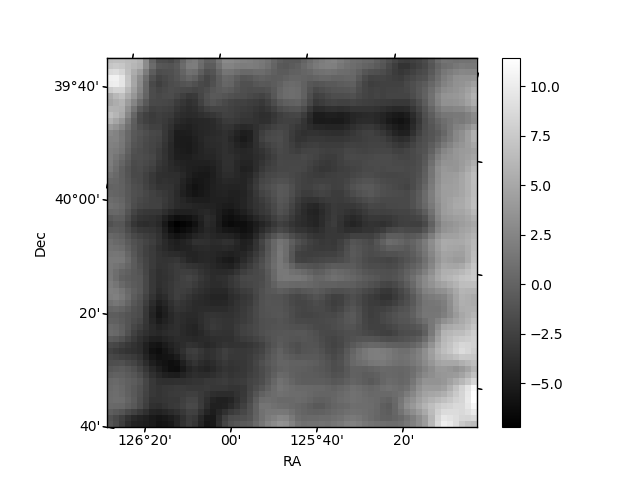
Histogram calculated using DETX and DETY for each event in the final _common_clean file
| Quadrant A | 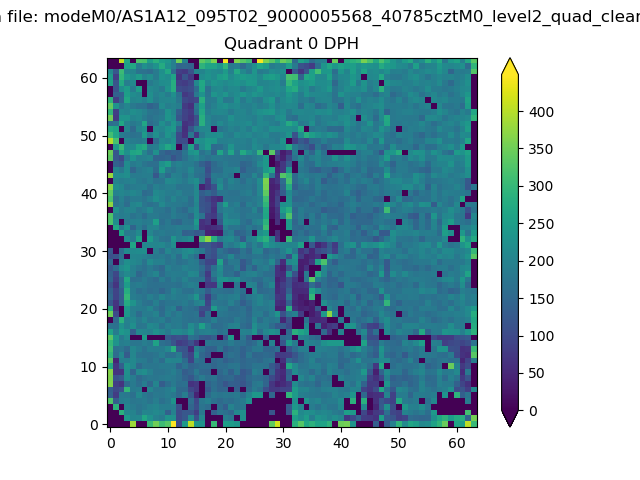 |
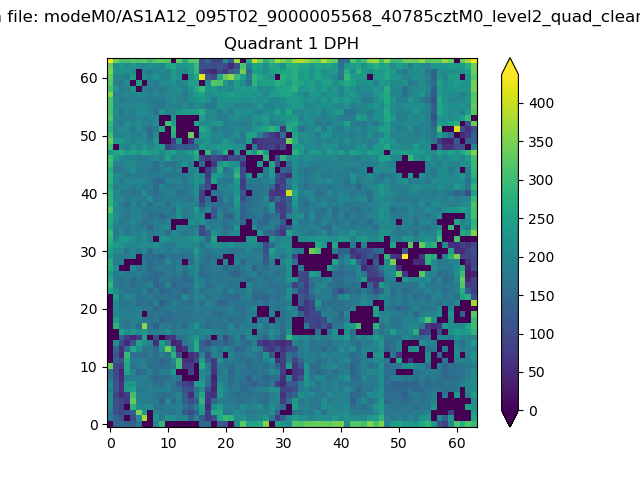 |
Quadrant B |
|---|---|---|---|
| Quadrant D | 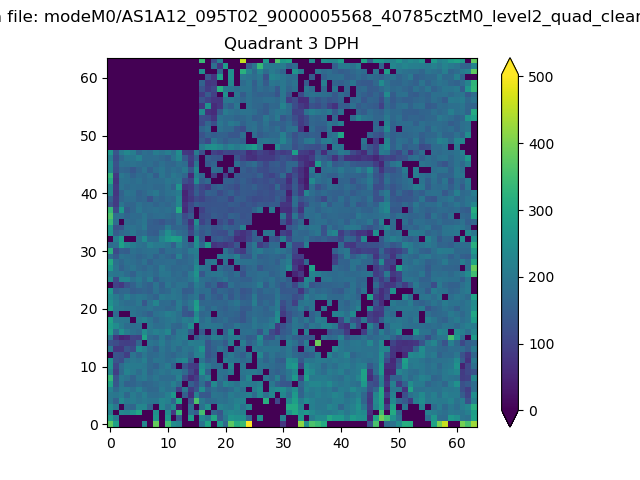 |
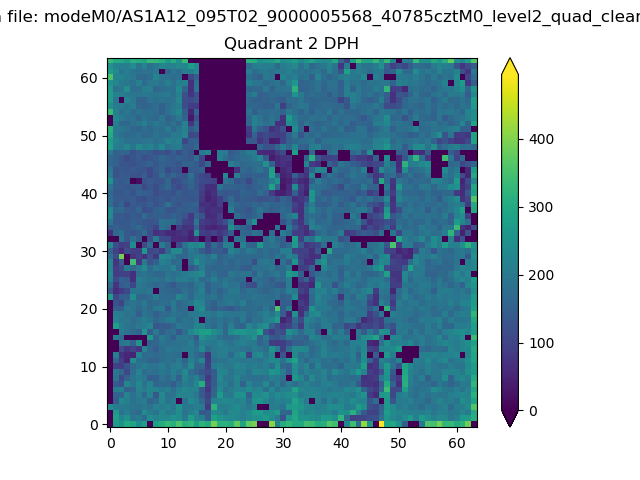 |
Quadrant C |
| Plot type | Count rate plots | Images |
|---|---|---|
| Comparison with Poisson distribution Blue bars denote a histogram of data divided into 1 sec bins. Red curve is a Poisson curve with rate = median count rate of data. |
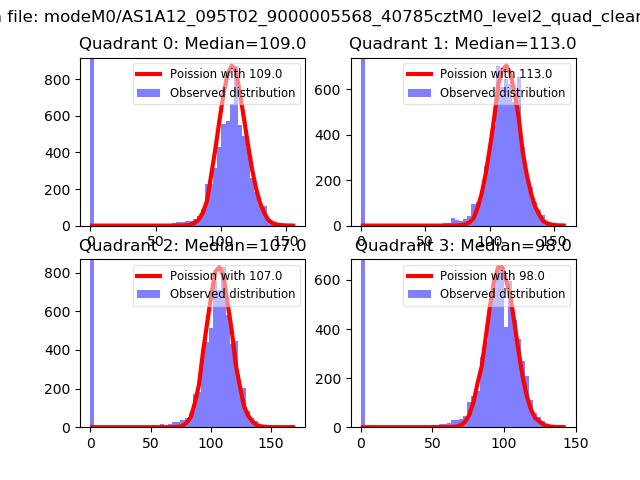 |
 |
| Quadrant-wise count rates Data is divided into 100 sec bins |
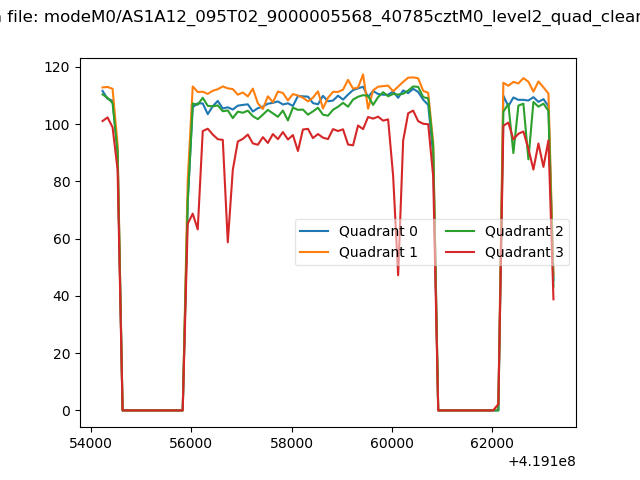 |
|
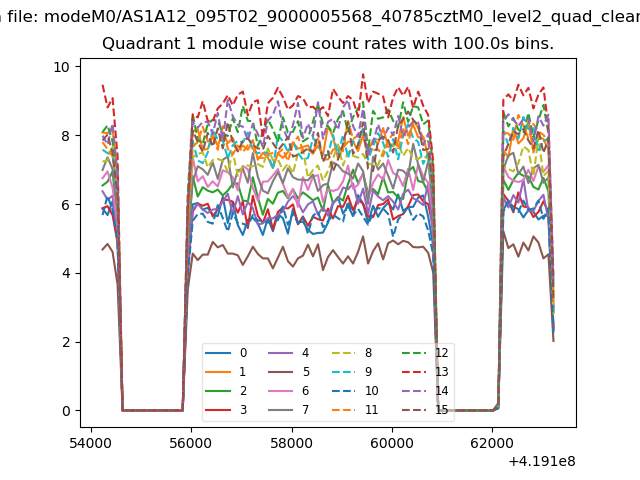
| Module-wise count rates for Quadrant A Data is divided into 100 sec bins |
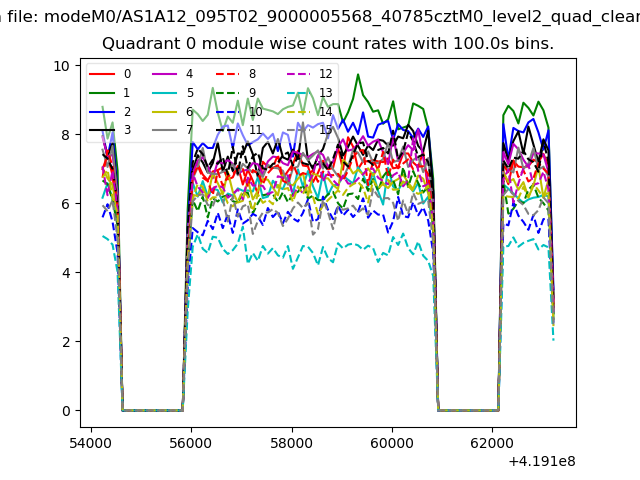 |
 |
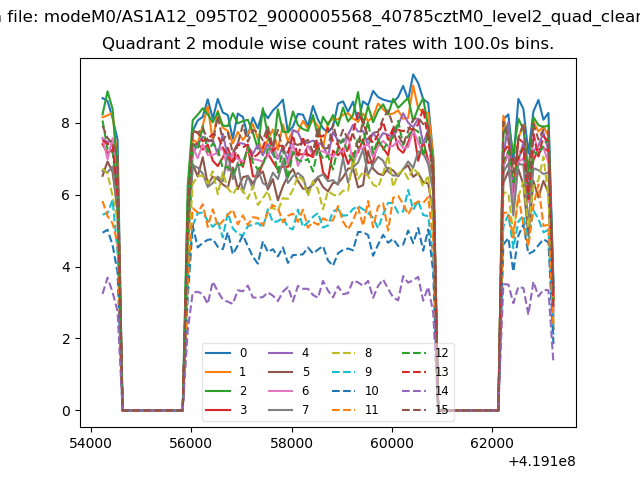
| Module-wise count rates for Quadrant B Data is divided into 100 sec bins |
 |
 |
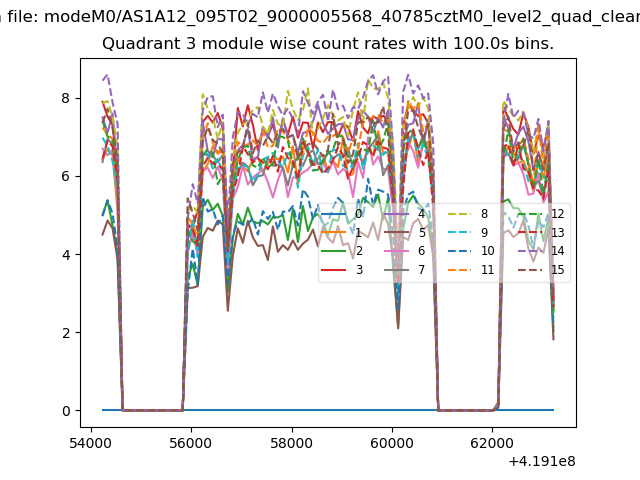
| Module-wise count rates for Quadrant C Data is divided into 100 sec bins |
 |
 |
| Module-wise count rates for Quadrant D Data is divided into 100 sec bins |
 |
 |
| Parameter | Plot |
|---|---|
| CZT HV Monitor | 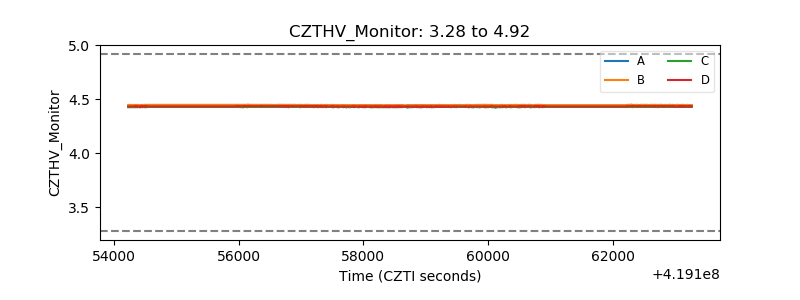 |
| D_VDD | 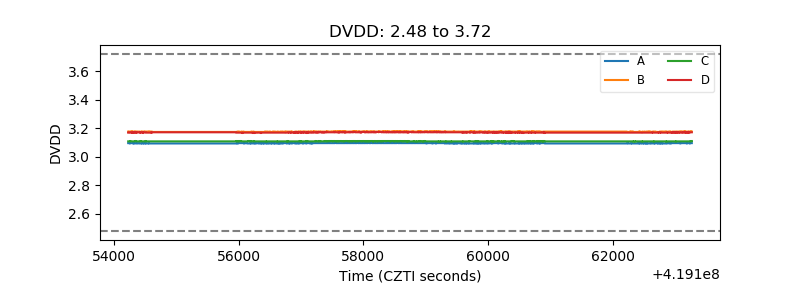 |
| Temperature 1 | 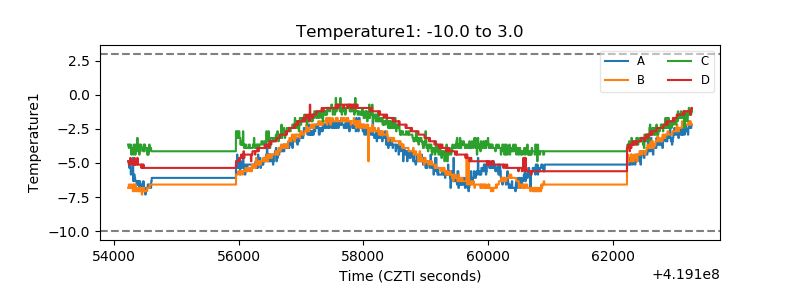 |
| Veto HV Monitor | 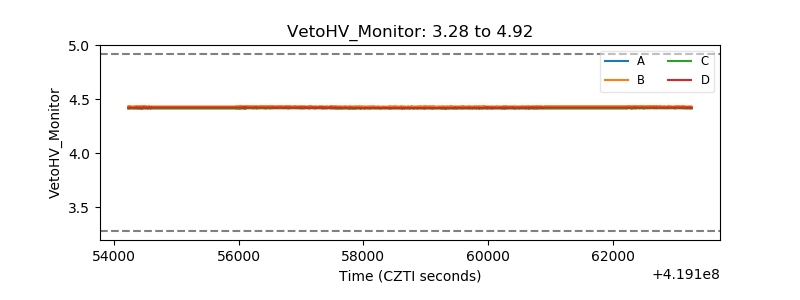 |
| Veto LLD | 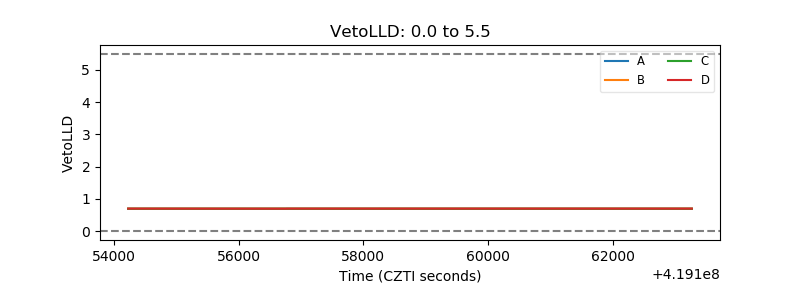 |
| Alpha Counter |  |
| _CPM_Rate | 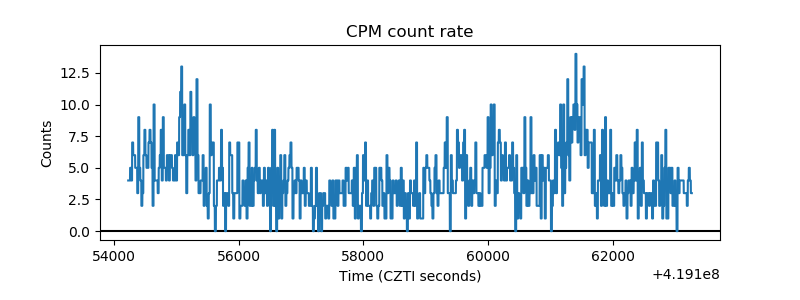 |
| CZT Counter | 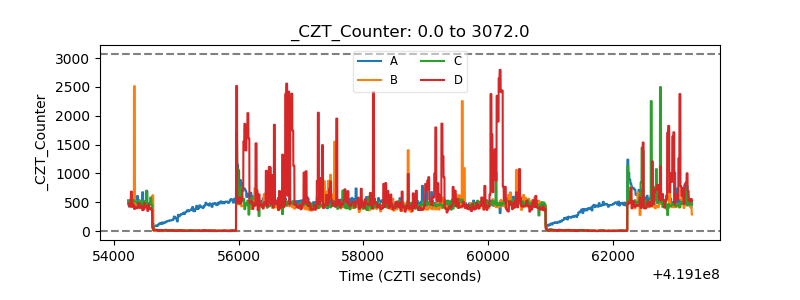 |
| +2.5 Volts monitor | 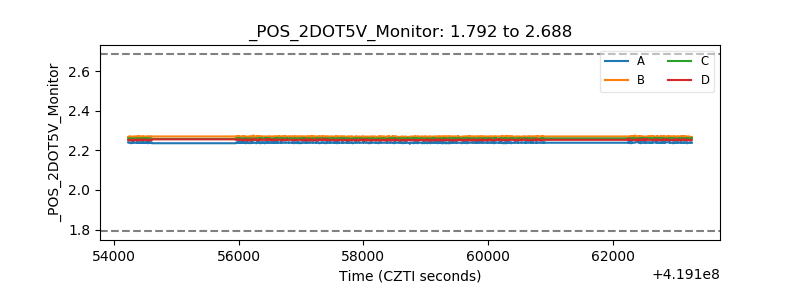 |
| +5 Volts monitor | 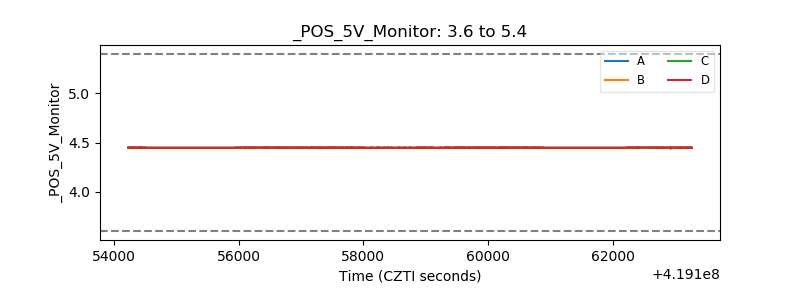 |
| _ROLL_ROT | 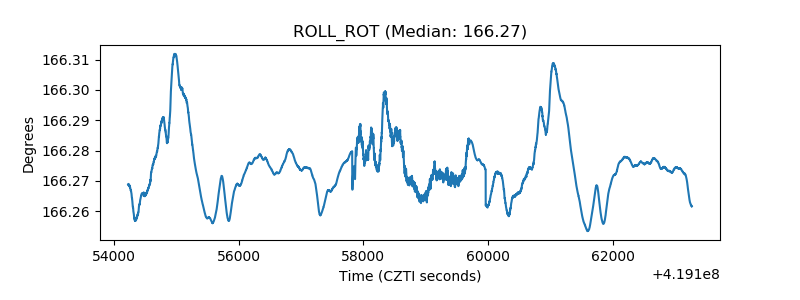 |
| _Roll_DEC | 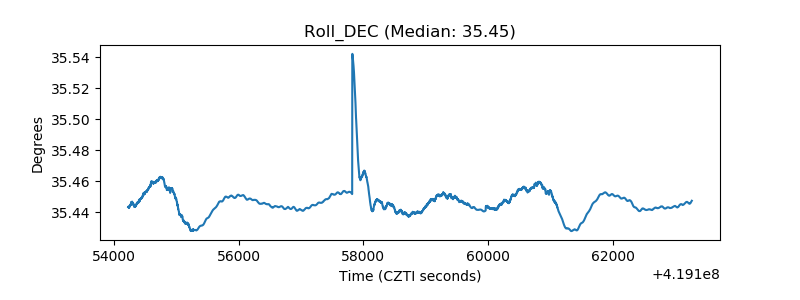 |
| _Roll_RA | 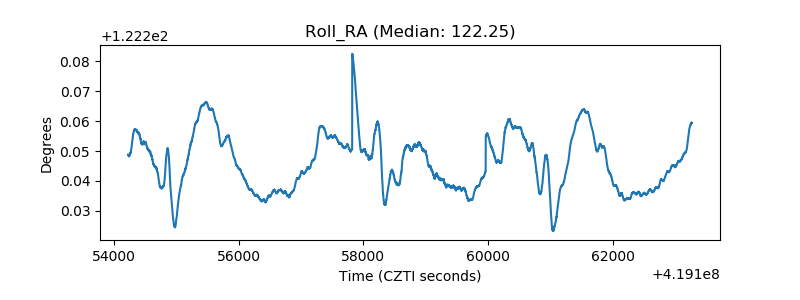 |
| Veto Counter | 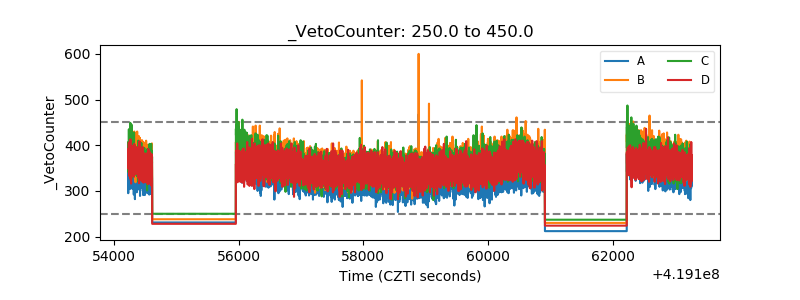 |