| Param | Original file | Final file |
|---|---|---|
| Filename | modeM0/AS1A12_095T02_9000005568_40787cztM0_level2.fits | modeM0/AS1A12_095T02_9000005568_40787cztM0_level2_quad_clean.evt |
| Size (bytes) | 661,800,960 | 173,191,680 |
| Size | 631.1 MB | 165.2 MB |
| Events in quadrant A | 5,990,156 | 1,163,618 |
| Events in quadrant B | 5,308,296 | 1,190,182 |
| Events in quadrant C | 5,616,484 | 1,129,286 |
| Events in quadrant D | 6,744,962 | 1,012,870 |
| Mode M9 | |||
|---|---|---|---|
| Quadrant | BADHDUFLAG | Total packets | Discarded packets |
| A | 0 | 27 | 0 |
| B | 0 | 27 | 0 |
| C | 0 | 27 | 0 |
| D | 0 | 27 | 0 |
| Mode SS | |||
|---|---|---|---|
| Quadrant | BADHDUFLAG | Total packets | Discarded packets |
| A | 0 | 220 | 0 |
| B | 0 | 220 | 0 |
| C | 0 | 220 | 0 |
| D | 0 | 220 | 0 |
| Mode M0 | |||
|---|---|---|---|
| Quadrant | BADHDUFLAG | Total packets | Discarded packets |
| A | 0 | 24563 | 4 |
| B | 0 | 23016 | 3 |
| C | 0 | 23654 | 3 |
| D | 0 | 27712 | 3 |
| Quadrant | Total seconds | Saturated seconds | Saturation percentage |
|---|---|---|---|
| A | 10799 | 52 | 0.481526% |
| B | 10799 | 93 | 0.861191% |
| C | 10799 | 156 | 1.444578% |
| D | 10799 | 410 | 3.796648% |
Noise dominated data is calculated using 1-second bins in cleaned event files. If a bin has >2000 counts, and if more than 50% of those come from <1% of pixels, then it is considered to be noise-dominated and hence unusable.
| Quadrant | # 1 sec bins | Bins with >0 counts | Bins with >2000 counts | High rate bins dominated by noise | Noise dominated (total time) | Noise dominated (detector-on time) | Marked lightcurve |
|---|---|---|---|---|---|---|---|
| A | 13573 | 10799 | 33 | 33 | 0.24% | 0.31% | 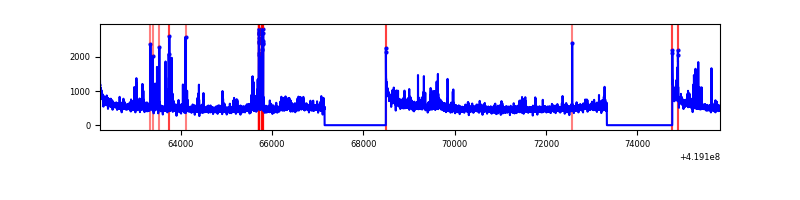 |
| B | 13573 | 10799 | 53 | 53 | 0.39% | 0.49% | 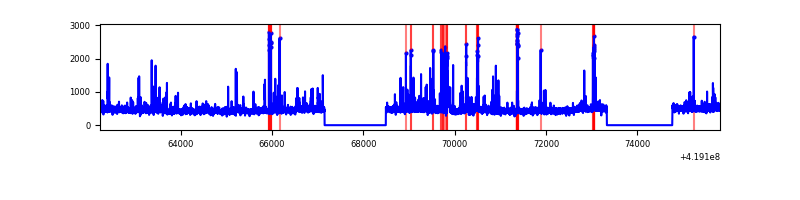 |
| C | 13573 | 10799 | 139 | 139 | 1.02% | 1.29% | 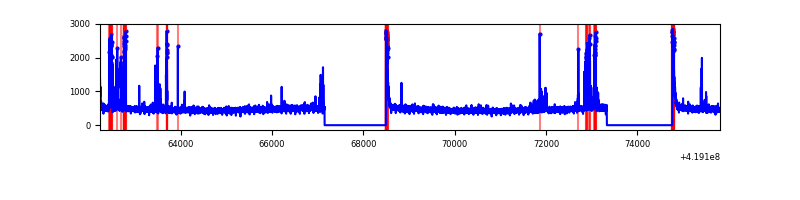 |
| D | 13573 | 10799 | 386 | 386 | 2.84% | 3.57% | 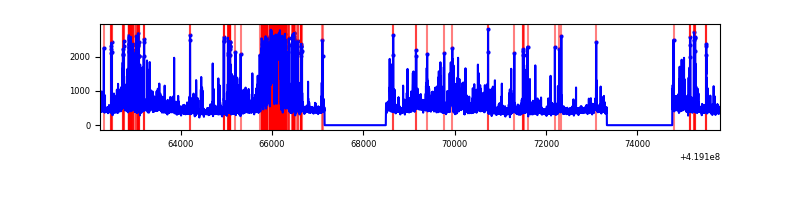 |
Top three noisy pixels from each quadrant. If the there are fewer than three noisy pixels in the level2.evt file, extra rows are filled as -1
| Pixel properties | Quadrant properties | ||||||
|---|---|---|---|---|---|---|---|
| Quadrant | DetID | PixID | Counts | Sigma | Mean | Median | Sigma |
| A | 10 | 83 | 946807 | 3953.28 | 1175 | 1149 | 239.2 |
| A | 13 | 248 | 248096 | 1032.35 | 1175 | 1149 | 239.2 |
| A | 6 | 10 | 128418 | 532.04 | 1175 | 1149 | 239.2 |
| B | 5 | 255 | 295869 | 1304.66 | 1170 | 1134 | 225.9 |
| B | 0 | 230 | 154032 | 676.81 | 1170 | 1134 | 225.9 |
| B | 4 | 171 | 135747 | 595.87 | 1170 | 1134 | 225.9 |
| C | 15 | 214 | 459871 | 1715.43 | 1147 | 1151 | 267.4 |
| C | 14 | 254 | 459725 | 1714.88 | 1147 | 1151 | 267.4 |
| C | 0 | 10 | 224143 | 833.9 | 1147 | 1151 | 267.4 |
| D | 2 | 153 | 874354 | 3172.46 | 1129 | 1098 | 275.3 |
| D | 2 | 249 | 595536 | 2159.54 | 1129 | 1098 | 275.3 |
| D | 5 | 222 | 435813 | 1579.28 | 1129 | 1098 | 275.3 |
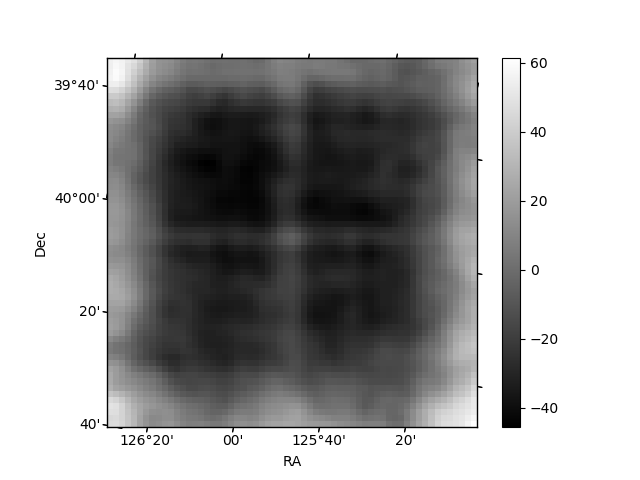
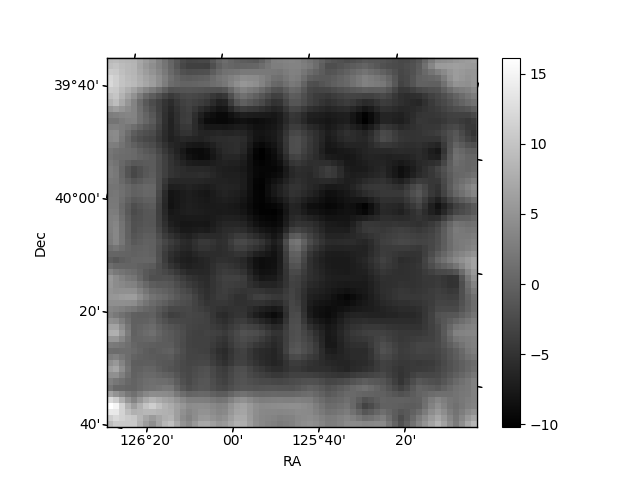
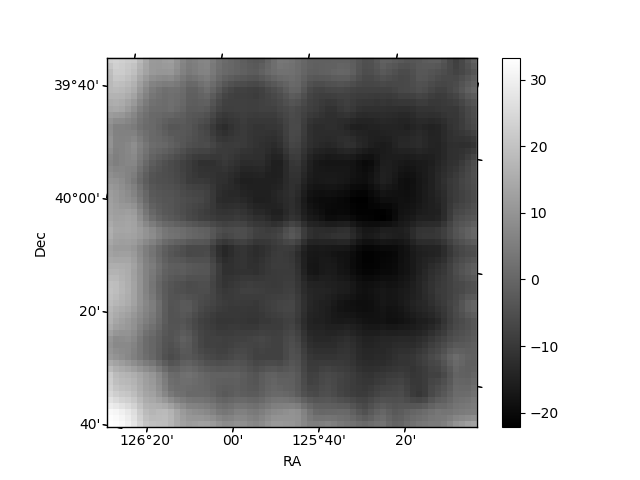
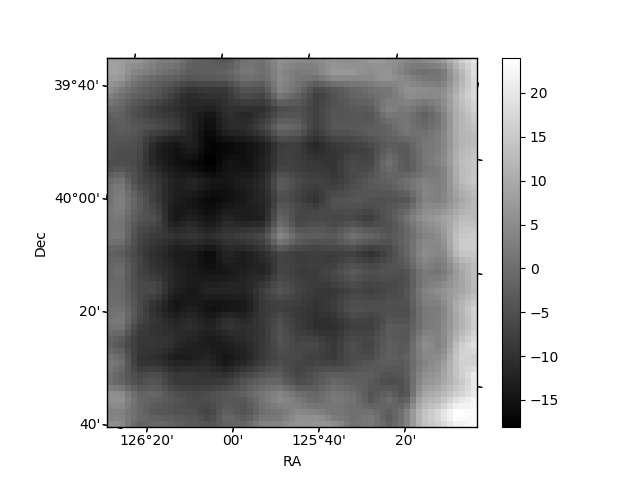
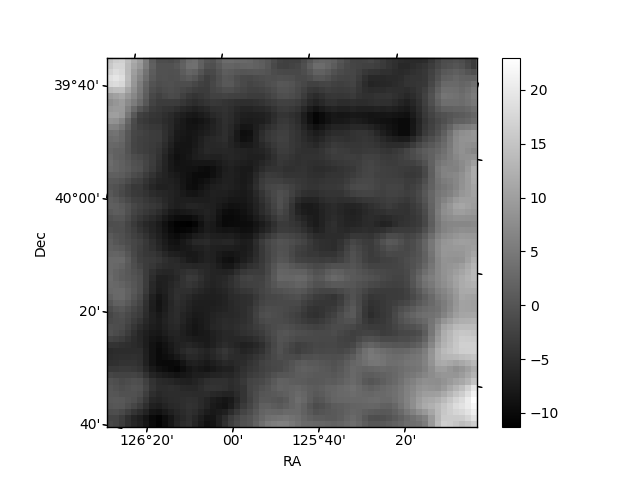
Histogram calculated using DETX and DETY for each event in the final _common_clean file
| Quadrant A | 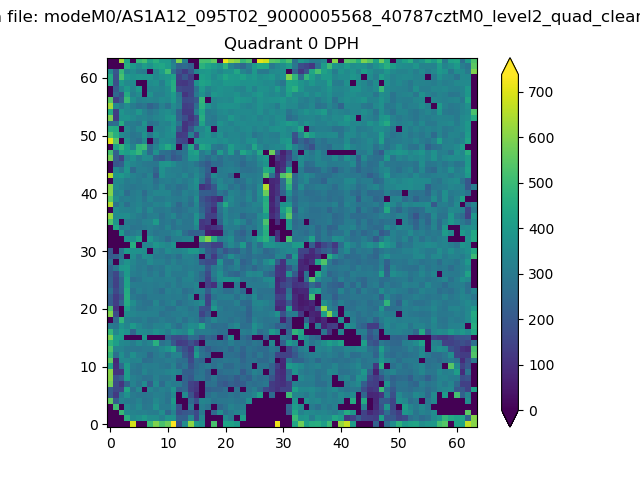 |
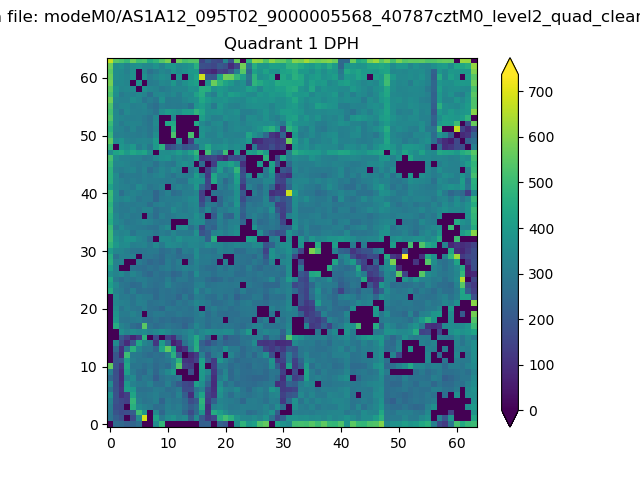 |
Quadrant B |
|---|---|---|---|
| Quadrant D | 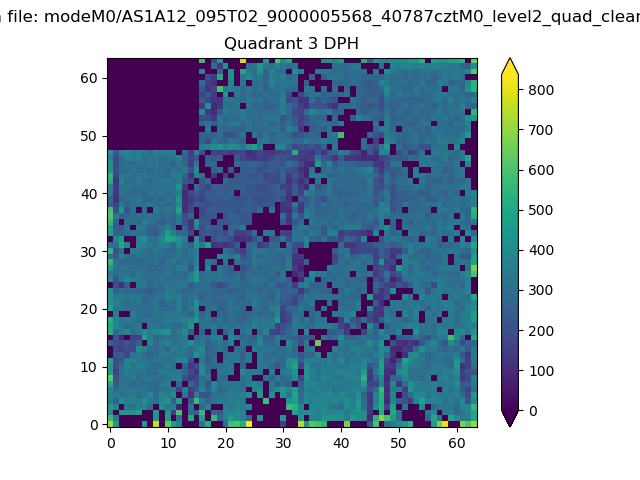 |
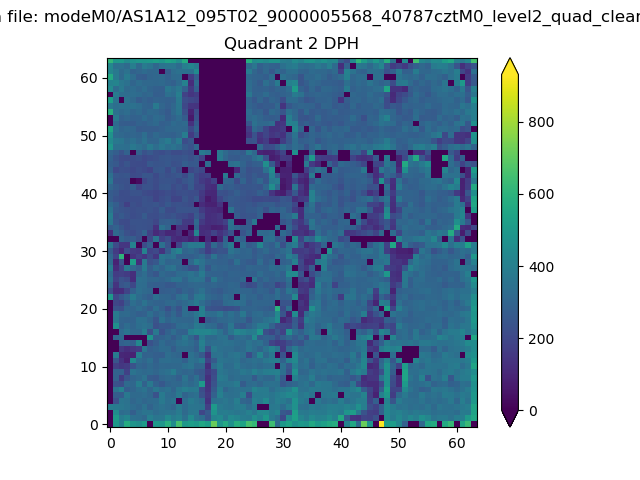 |
Quadrant C |
| Plot type | Count rate plots | Images |
|---|---|---|
| Comparison with Poisson distribution Blue bars denote a histogram of data divided into 1 sec bins. Red curve is a Poisson curve with rate = median count rate of data. |
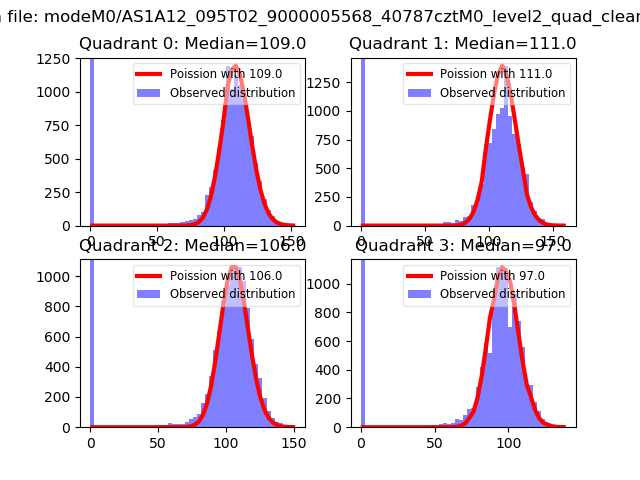 |
 |
| Quadrant-wise count rates Data is divided into 100 sec bins |
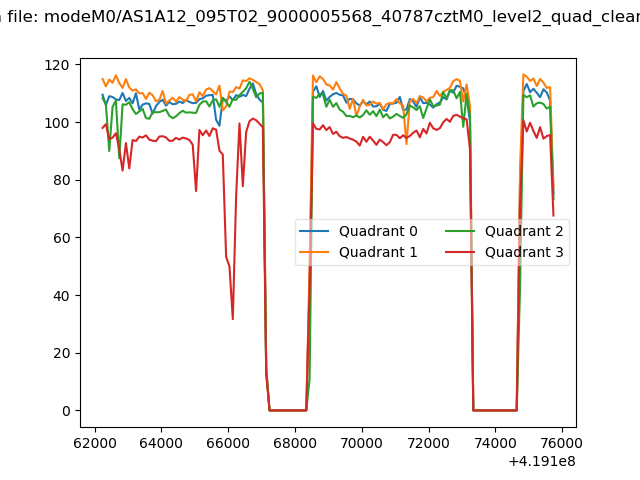 |
|
| Module-wise count rates for Quadrant A Data is divided into 100 sec bins |
 |
 |
| Module-wise count rates for Quadrant B Data is divided into 100 sec bins |
 |
 |
| Module-wise count rates for Quadrant C Data is divided into 100 sec bins |
 |
 |
| Module-wise count rates for Quadrant D Data is divided into 100 sec bins |
 |
 |
| Parameter | Plot |
|---|---|
| CZT HV Monitor |  |
| D_VDD | 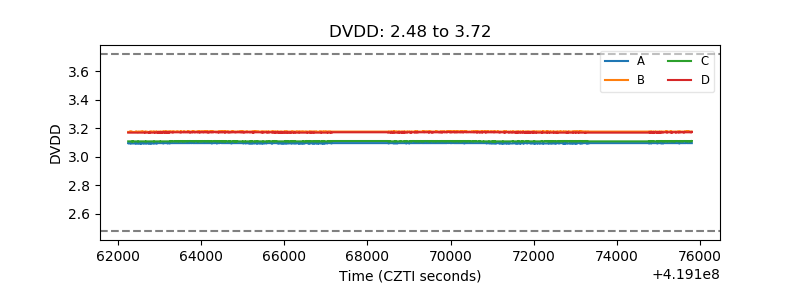 |
| Temperature 1 | 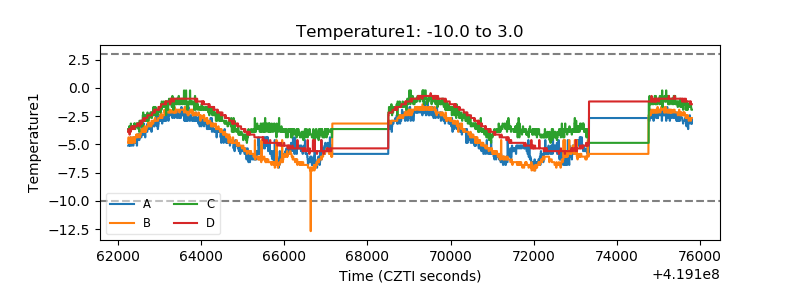 |
| Veto HV Monitor | 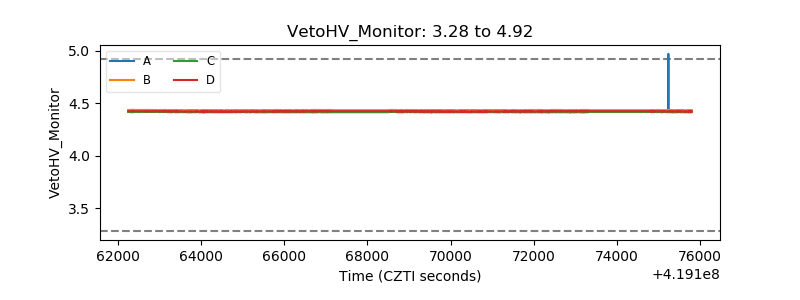 |
| Veto LLD | 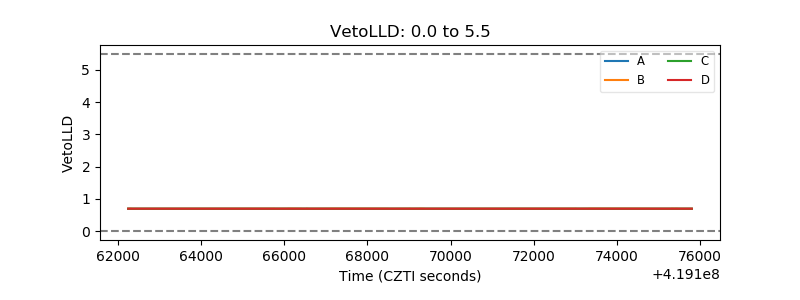 |
| Alpha Counter | 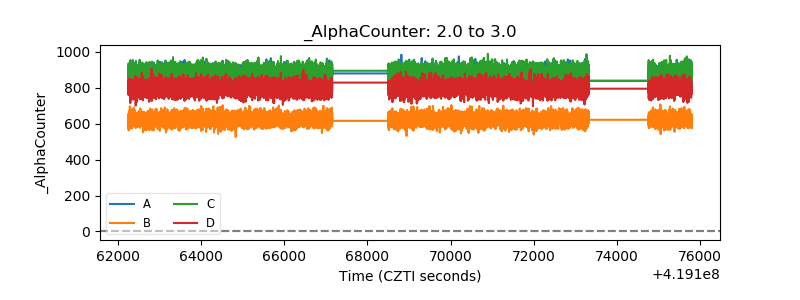 |
| _CPM_Rate | 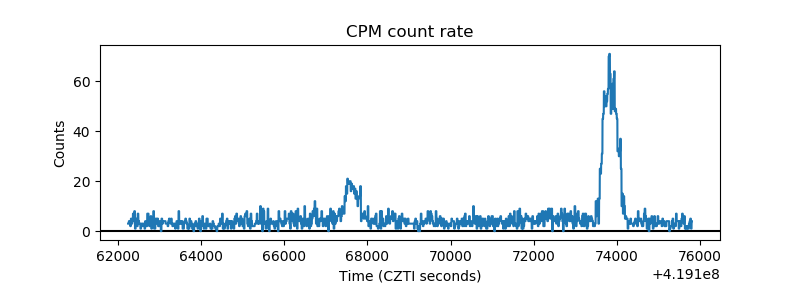 |
| CZT Counter | 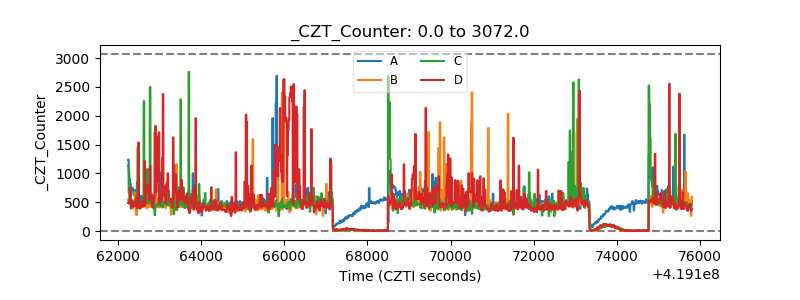 |
| +2.5 Volts monitor | 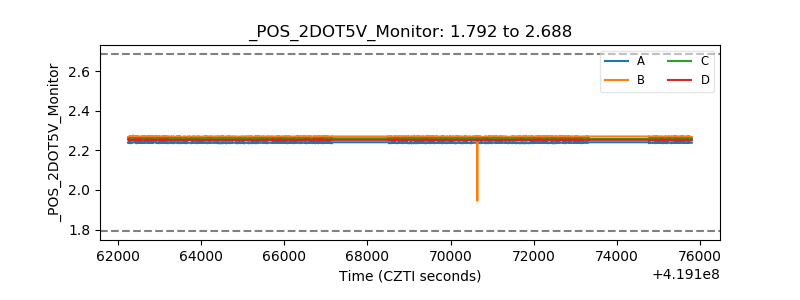 |
| +5 Volts monitor | 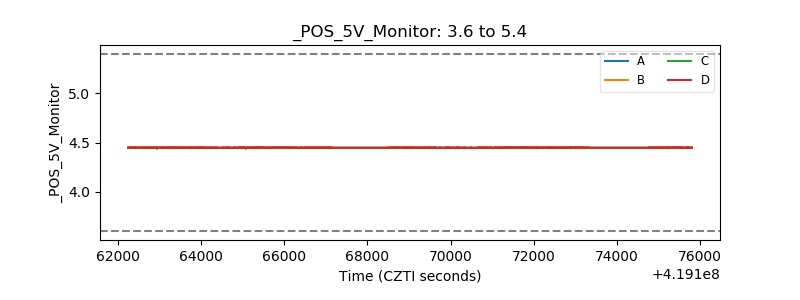 |
| _ROLL_ROT |  |
| _Roll_DEC | 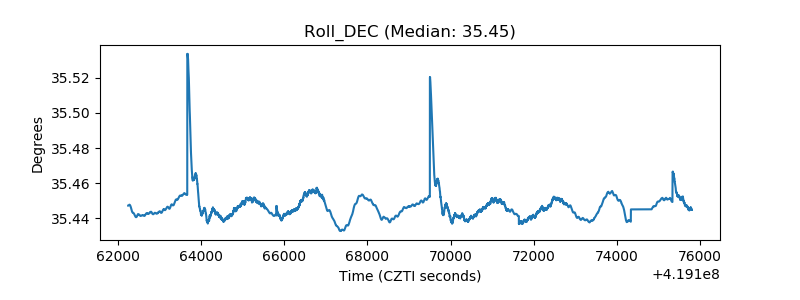 |
| _Roll_RA | 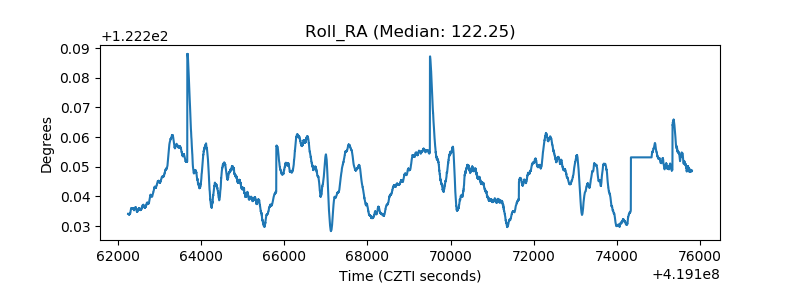 |
| Veto Counter |  |