| Param | Original file | Final file |
|---|---|---|
| Filename | modeM0/AS1A12_095T02_9000005568_40788cztM0_level2.fits | modeM0/AS1A12_095T02_9000005568_40788cztM0_level2_quad_clean.evt |
| Size (bytes) | 309,335,040 | 88,905,600 |
| Size | 295.0 MB | 84.8 MB |
| Events in quadrant A | 2,953,789 | 591,164 |
| Events in quadrant B | 2,590,952 | 607,688 |
| Events in quadrant C | 2,637,742 | 576,714 |
| Events in quadrant D | 2,841,349 | 533,085 |
| Mode M9 | |||
|---|---|---|---|
| Quadrant | BADHDUFLAG | Total packets | Discarded packets |
| A | 0 | 15 | 0 |
| B | 0 | 15 | 0 |
| C | 0 | 15 | 0 |
| D | 0 | 15 | 0 |
| Mode SS | |||
|---|---|---|---|
| Quadrant | BADHDUFLAG | Total packets | Discarded packets |
| A | 0 | 112 | 0 |
| B | 0 | 112 | 0 |
| C | 0 | 112 | 0 |
| D | 0 | 112 | 0 |
| Mode M0 | |||
|---|---|---|---|
| Quadrant | BADHDUFLAG | Total packets | Discarded packets |
| A | 0 | 12194 | 2 |
| B | 0 | 11385 | 1 |
| C | 0 | 11371 | 1 |
| D | 0 | 12411 | 1 |
| Quadrant | Total seconds | Saturated seconds | Saturation percentage |
|---|---|---|---|
| A | 5473 | 19 | 0.347159% |
| B | 5473 | 14 | 0.255801% |
| C | 5473 | 42 | 0.767404% |
| D | 5473 | 72 | 1.315549% |
Noise dominated data is calculated using 1-second bins in cleaned event files. If a bin has >2000 counts, and if more than 50% of those come from <1% of pixels, then it is considered to be noise-dominated and hence unusable.
| Quadrant | # 1 sec bins | Bins with >0 counts | Bins with >2000 counts | High rate bins dominated by noise | Noise dominated (total time) | Noise dominated (detector-on time) | Marked lightcurve |
|---|---|---|---|---|---|---|---|
| A | 7026 | 5474 | 15 | 15 | 0.21% | 0.27% | 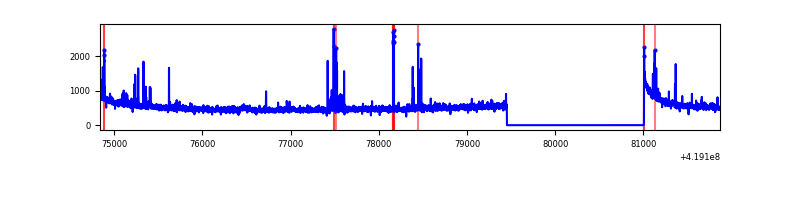 |
| B | 7025 | 5472 | 2 | 2 | 0.03% | 0.04% | 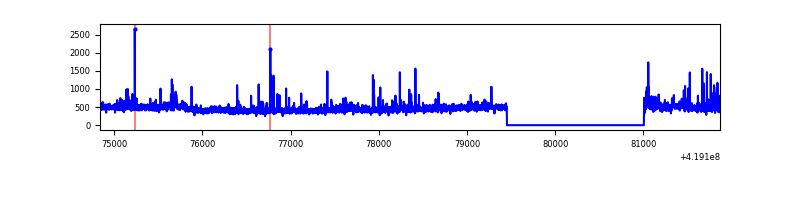 |
| C | 7025 | 5472 | 37 | 37 | 0.53% | 0.68% | 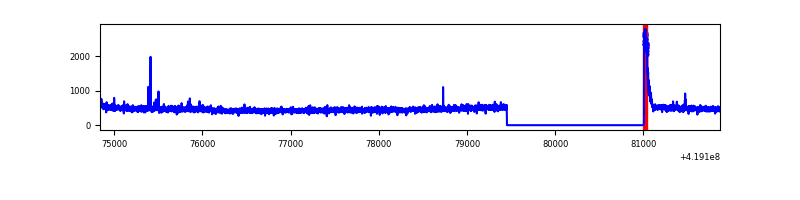 |
| D | 7026 | 5473 | 61 | 61 | 0.87% | 1.11% | 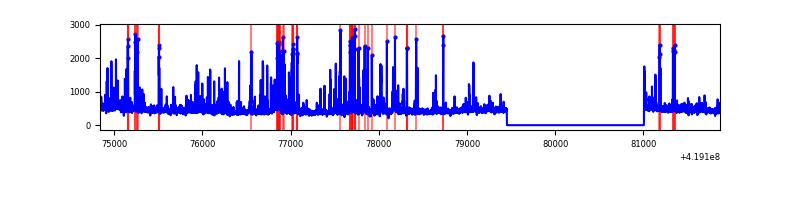 |
Top three noisy pixels from each quadrant. If the there are fewer than three noisy pixels in the level2.evt file, extra rows are filled as -1
| Pixel properties | Quadrant properties | ||||||
|---|---|---|---|---|---|---|---|
| Quadrant | DetID | PixID | Counts | Sigma | Mean | Median | Sigma |
| A | 10 | 83 | 492254 | 4047.42 | 591 | 578 | 121.5 |
| A | 13 | 248 | 81145 | 663.22 | 591 | 578 | 121.5 |
| A | 12 | 189 | 49329 | 401.31 | 591 | 578 | 121.5 |
| B | 0 | 230 | 86876 | 751.48 | 589 | 573 | 114.8 |
| B | 4 | 171 | 77212 | 667.33 | 589 | 573 | 114.8 |
| B | 5 | 255 | 36459 | 312.48 | 589 | 573 | 114.8 |
| C | 15 | 214 | 234895 | 1725.53 | 579 | 582 | 135.8 |
| C | 0 | 10 | 112226 | 822.17 | 579 | 582 | 135.8 |
| C | 3 | 233 | 17340 | 123.41 | 579 | 582 | 135.8 |
| D | 2 | 249 | 289668 | 2014.14 | 579 | 560 | 143.5 |
| D | 2 | 153 | 101000 | 699.74 | 579 | 560 | 143.5 |
| D | 5 | 222 | 65097 | 449.61 | 579 | 560 | 143.5 |
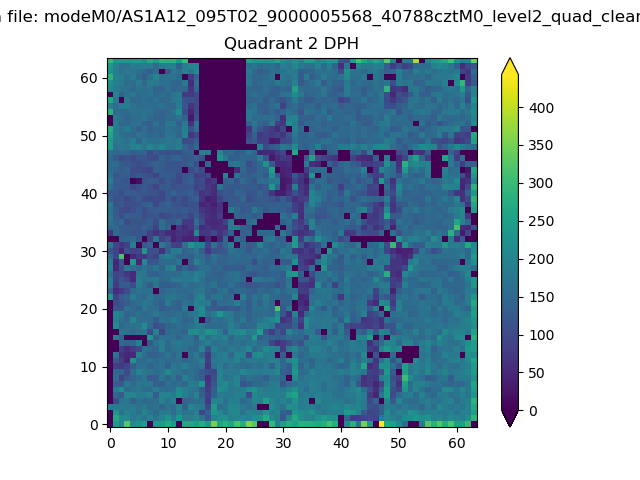
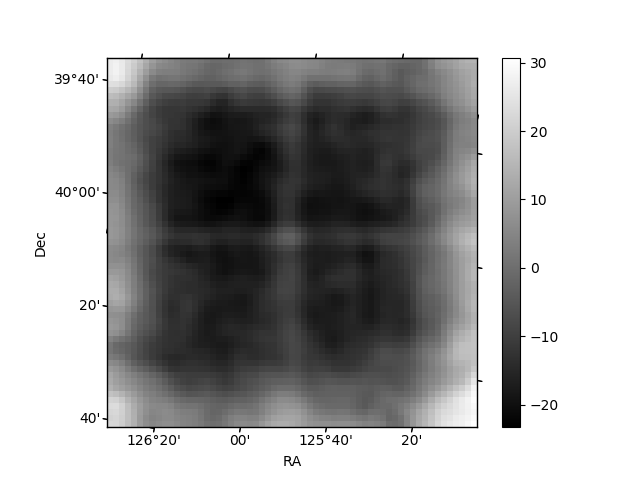
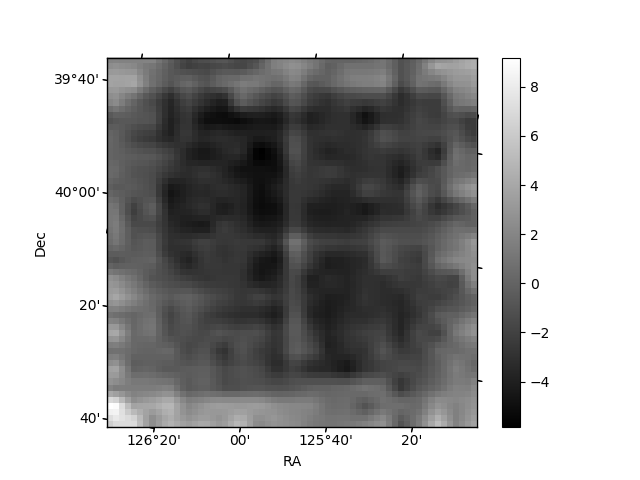
Histogram calculated using DETX and DETY for each event in the final _common_clean file
| Quadrant A | 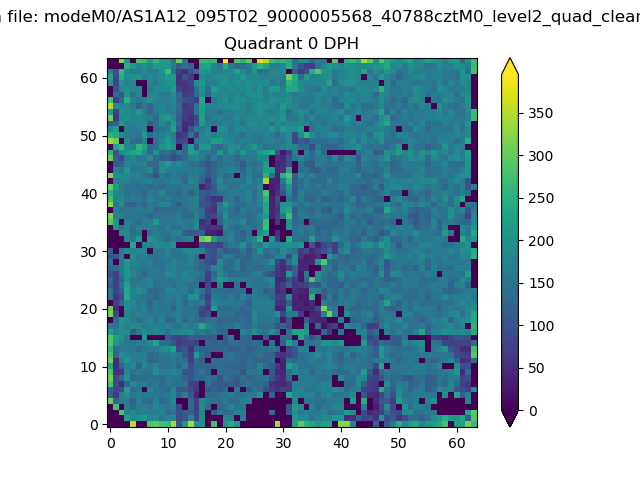 |
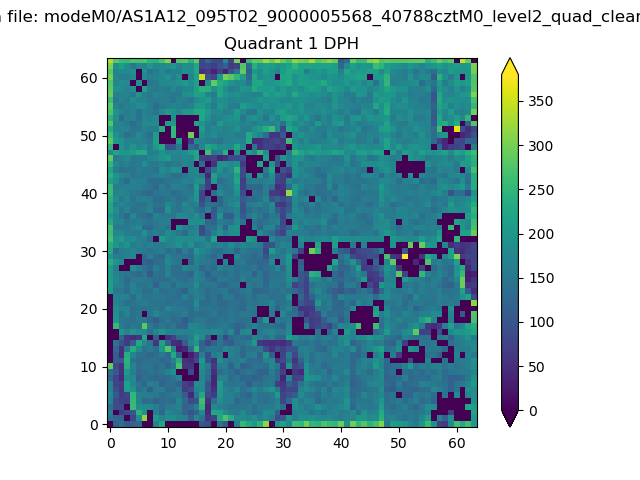 |
Quadrant B |
|---|---|---|---|
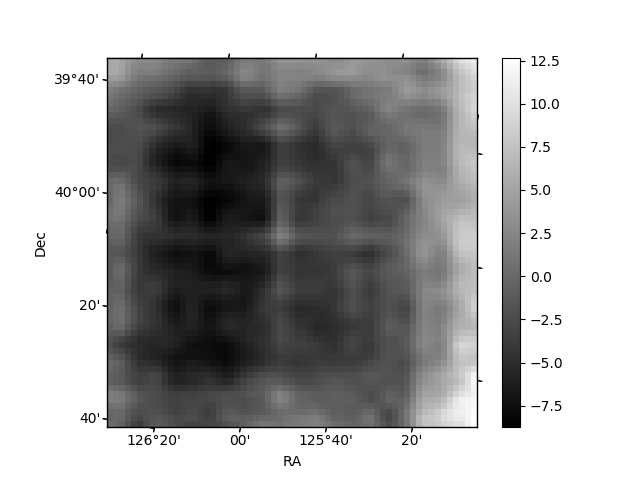
| Quadrant D | 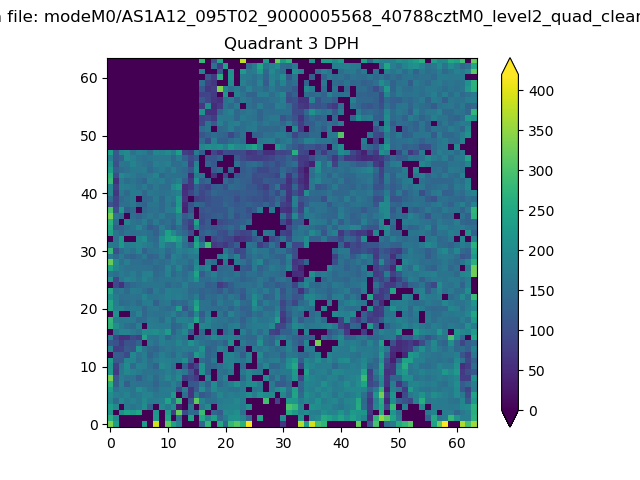 |
 |
Quadrant C |
| Plot type | Count rate plots | Images |
|---|---|---|
| Comparison with Poisson distribution Blue bars denote a histogram of data divided into 1 sec bins. Red curve is a Poisson curve with rate = median count rate of data. |
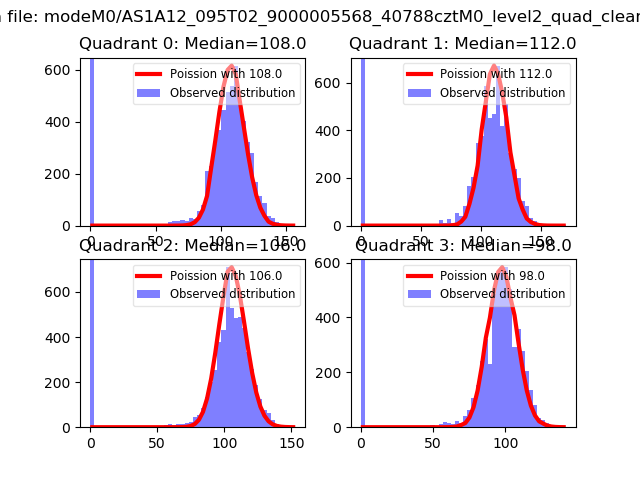 |
 |
| Quadrant-wise count rates Data is divided into 100 sec bins |
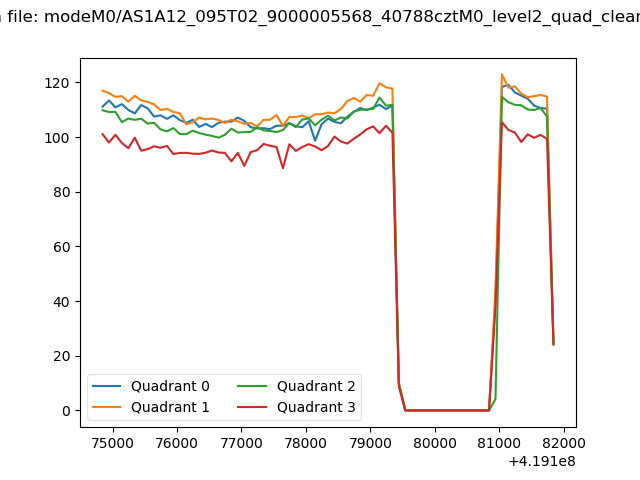 |
|
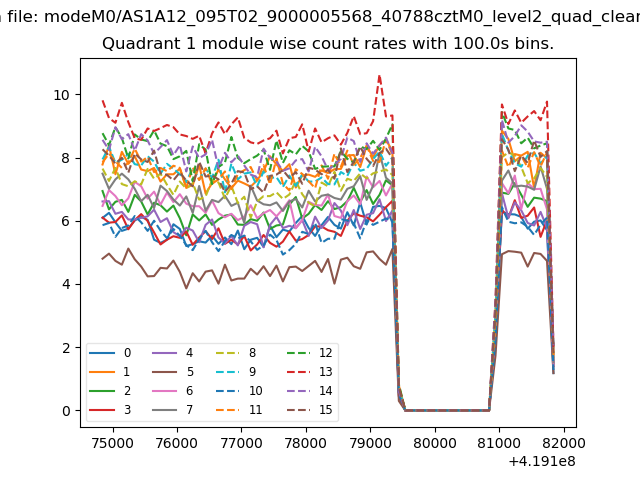
| Module-wise count rates for Quadrant A Data is divided into 100 sec bins |
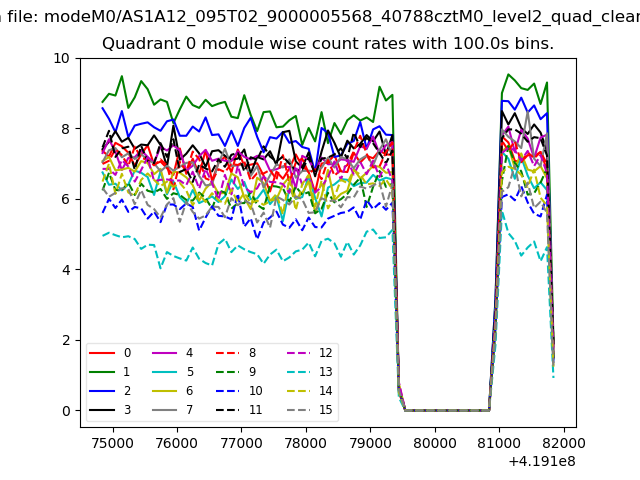 |
 |
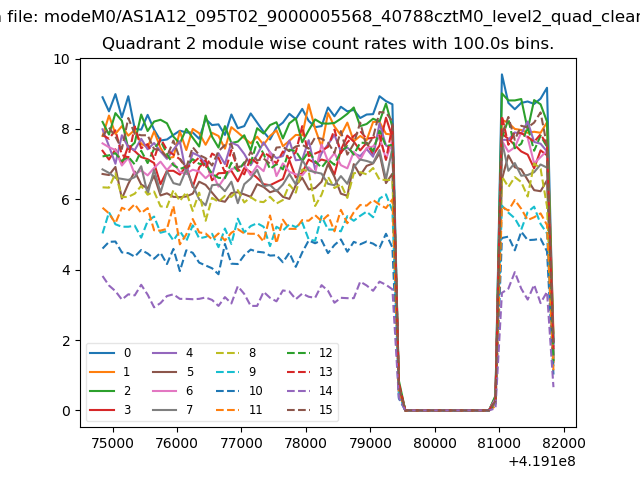
| Module-wise count rates for Quadrant B Data is divided into 100 sec bins |
 |
 |
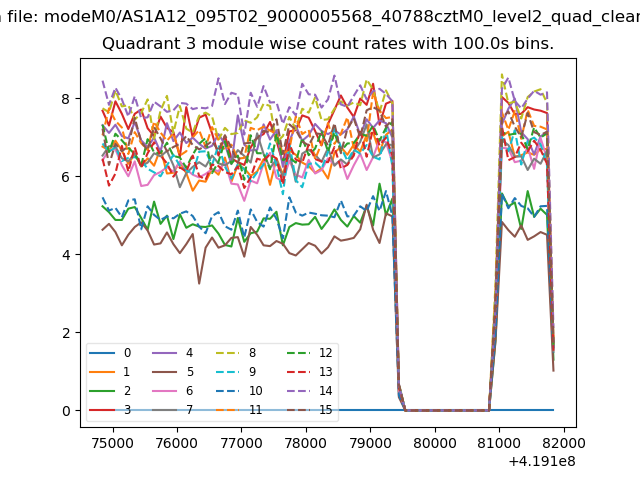
| Module-wise count rates for Quadrant C Data is divided into 100 sec bins |
 |
 |
| Module-wise count rates for Quadrant D Data is divided into 100 sec bins |
 |
 |
| Parameter | Plot |
|---|---|
| CZT HV Monitor | 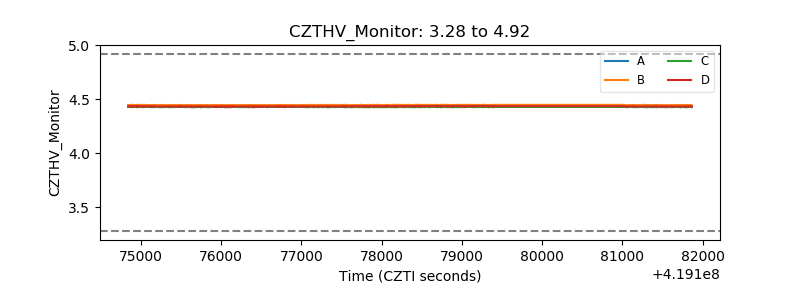 |
| D_VDD | 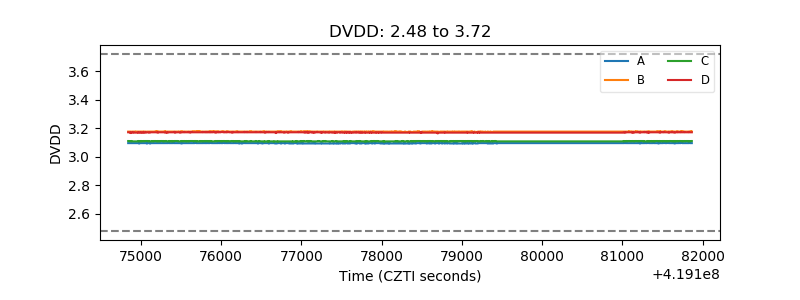 |
| Temperature 1 | 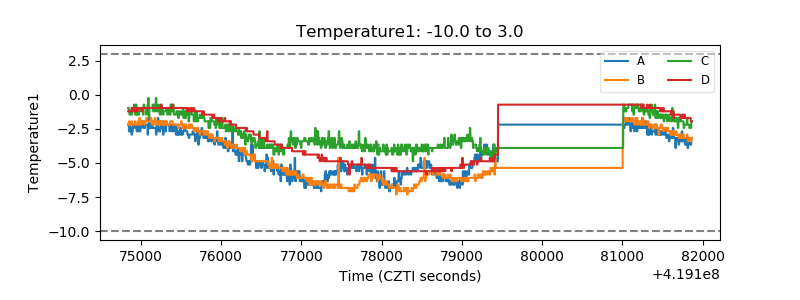 |
| Veto HV Monitor | 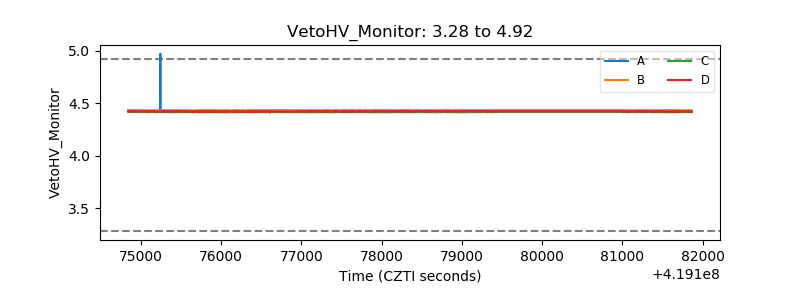 |
| Veto LLD | 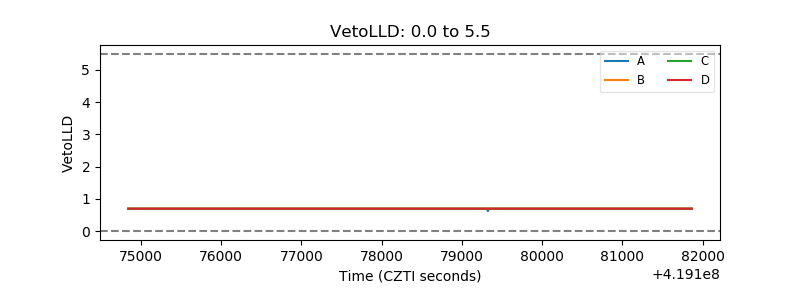 |
| Alpha Counter | 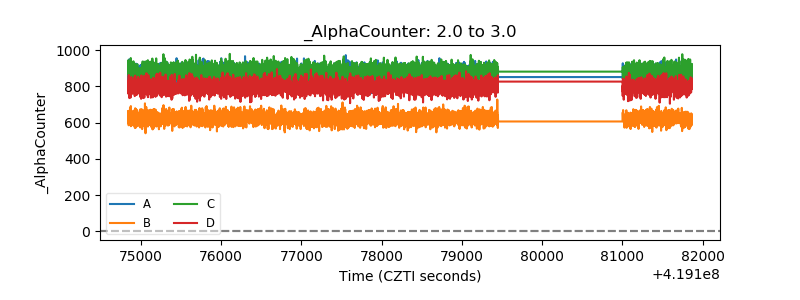 |
| _CPM_Rate | 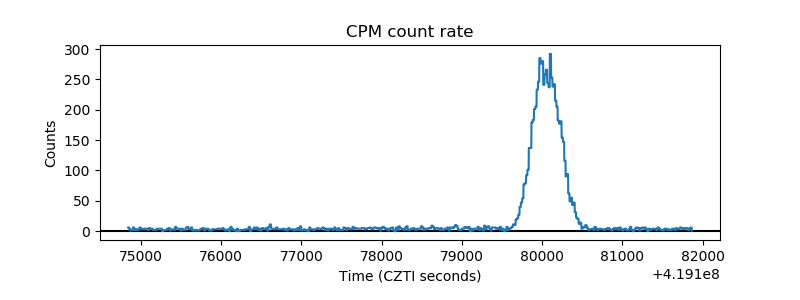 |
| CZT Counter | 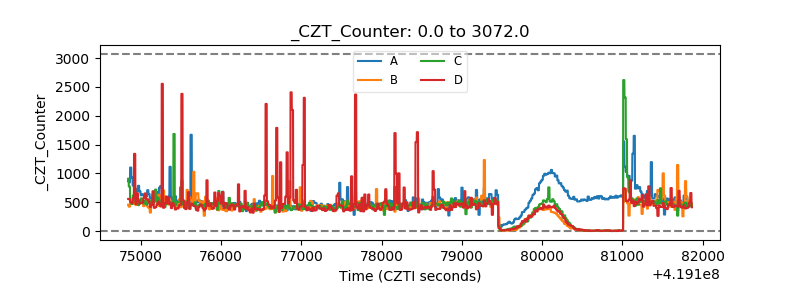 |
| +2.5 Volts monitor | 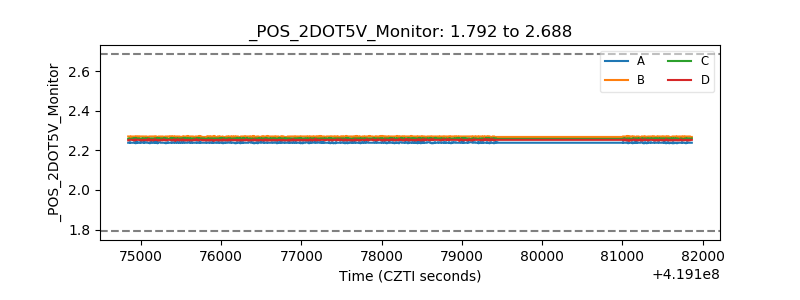 |
| +5 Volts monitor | 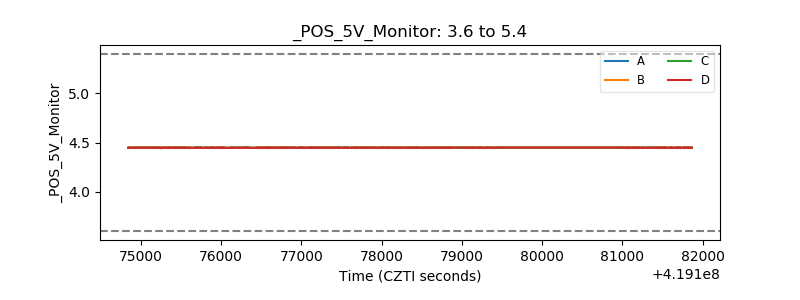 |
| _ROLL_ROT | 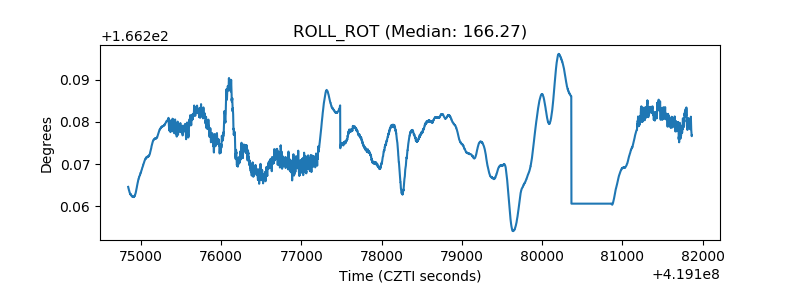 |
| _Roll_DEC | 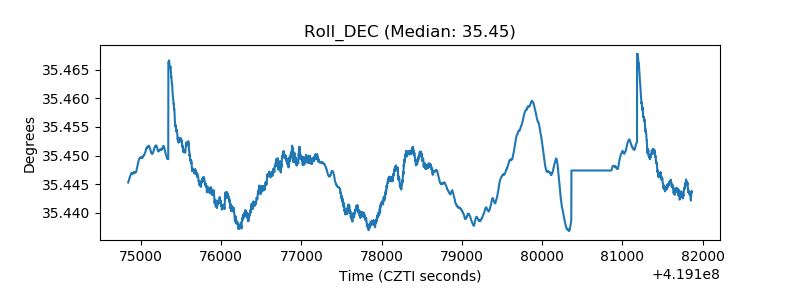 |
| _Roll_RA | 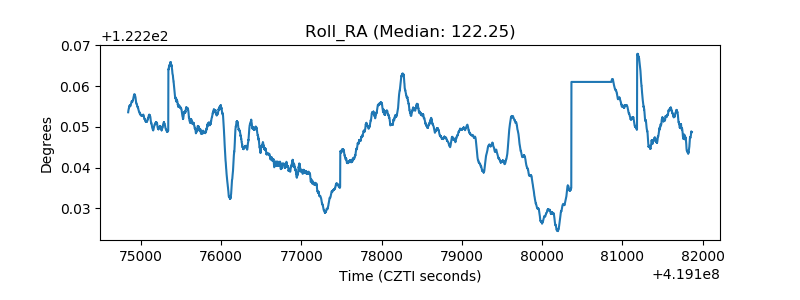 |
| Veto Counter | 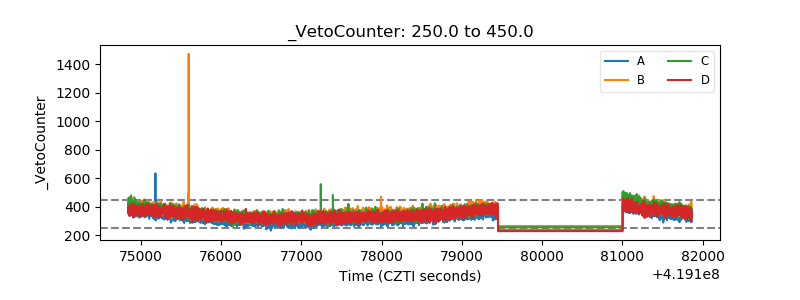 |