| Param | Original file | Final file |
|---|---|---|
| Filename | modeM0/AS1A12_095T02_9000005568_40789cztM0_level2.fits | modeM0/AS1A12_095T02_9000005568_40789cztM0_level2_quad_clean.evt |
| Size (bytes) | 322,488,000 | 87,926,400 |
| Size | 307.5 MB | 83.9 MB |
| Events in quadrant A | 2,972,607 | 591,299 |
| Events in quadrant B | 2,525,259 | 606,467 |
| Events in quadrant C | 2,745,700 | 573,988 |
| Events in quadrant D | 3,272,957 | 512,465 |
| Mode M9 | |||
|---|---|---|---|
| Quadrant | BADHDUFLAG | Total packets | Discarded packets |
| A | 0 | 17 | 0 |
| B | 0 | 17 | 0 |
| C | 0 | 17 | 0 |
| D | 0 | 18 | 0 |
| Mode SS | |||
|---|---|---|---|
| Quadrant | BADHDUFLAG | Total packets | Discarded packets |
| A | 0 | 110 | 0 |
| B | 0 | 110 | 0 |
| C | 0 | 110 | 0 |
| D | 0 | 110 | 0 |
| Mode M0 | |||
|---|---|---|---|
| Quadrant | BADHDUFLAG | Total packets | Discarded packets |
| A | 0 | 12263 | 3 |
| B | 0 | 11259 | 2 |
| C | 0 | 11675 | 2 |
| D | 0 | 13689 | 2 |
| Quadrant | Total seconds | Saturated seconds | Saturation percentage |
|---|---|---|---|
| A | 5400 | 25 | 0.462963% |
| B | 5400 | 19 | 0.351852% |
| C | 5400 | 68 | 1.259259% |
| D | 5400 | 269 | 4.981481% |
Noise dominated data is calculated using 1-second bins in cleaned event files. If a bin has >2000 counts, and if more than 50% of those come from <1% of pixels, then it is considered to be noise-dominated and hence unusable.
| Quadrant | # 1 sec bins | Bins with >0 counts | Bins with >2000 counts | High rate bins dominated by noise | Noise dominated (total time) | Noise dominated (detector-on time) | Marked lightcurve |
|---|---|---|---|---|---|---|---|
| A | 7072 | 5401 | 13 | 13 | 0.18% | 0.24% | 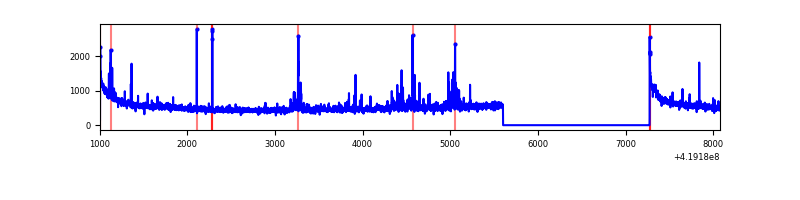 |
| B | 7071 | 5399 | 6 | 6 | 0.08% | 0.11% | 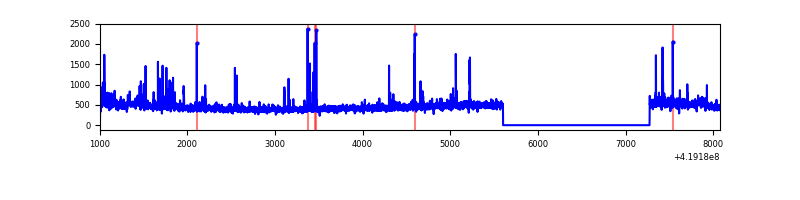 |
| C | 7071 | 5399 | 70 | 70 | 0.99% | 1.30% | 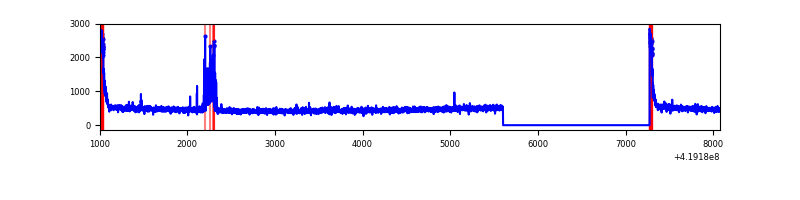 |
| D | 7071 | 5400 | 253 | 253 | 3.58% | 4.69% | 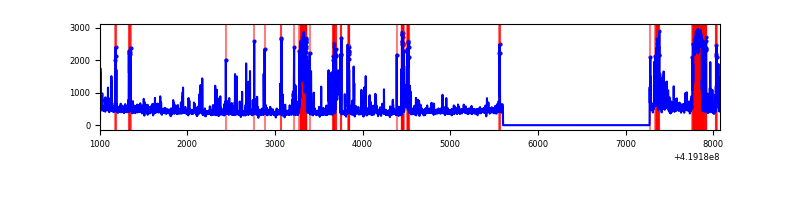 |
Top three noisy pixels from each quadrant. If the there are fewer than three noisy pixels in the level2.evt file, extra rows are filled as -1
| Pixel properties | Quadrant properties | ||||||
|---|---|---|---|---|---|---|---|
| Quadrant | DetID | PixID | Counts | Sigma | Mean | Median | Sigma |
| A | 10 | 83 | 526537 | 4358.78 | 583 | 570 | 120.7 |
| A | 13 | 248 | 92299 | 760.17 | 583 | 570 | 120.7 |
| A | 12 | 189 | 64786 | 532.17 | 583 | 570 | 120.7 |
| B | 0 | 230 | 65908 | 577.25 | 583 | 565 | 113.2 |
| B | 0 | 190 | 58229 | 509.41 | 583 | 565 | 113.2 |
| B | 5 | 255 | 41337 | 360.19 | 583 | 565 | 113.2 |
| C | 15 | 214 | 230724 | 1717.01 | 570 | 573 | 134.0 |
| C | 0 | 10 | 186930 | 1390.29 | 570 | 573 | 134.0 |
| C | 14 | 254 | 97830 | 725.57 | 570 | 573 | 134.0 |
| D | 2 | 153 | 519620 | 3818.67 | 558 | 543 | 135.9 |
| D | 2 | 249 | 286443 | 2103.27 | 558 | 543 | 135.9 |
| D | 12 | 233 | 144992 | 1062.66 | 558 | 543 | 135.9 |
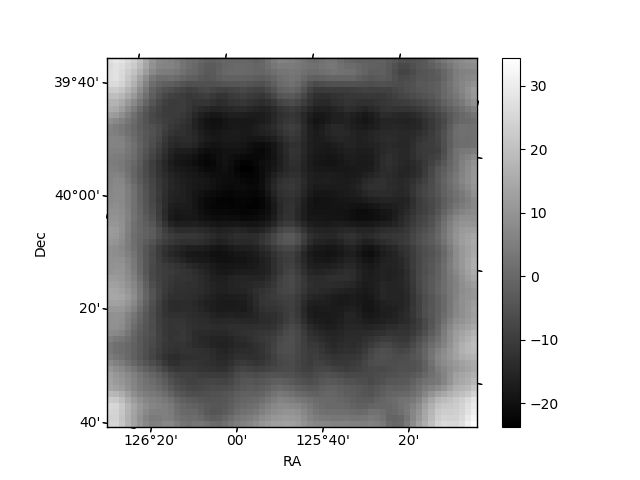
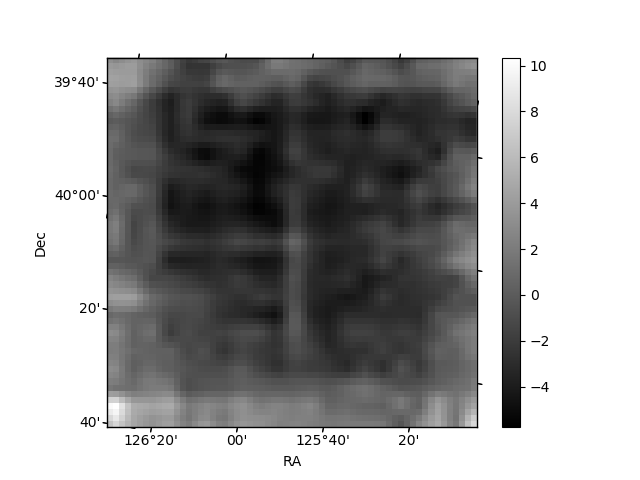
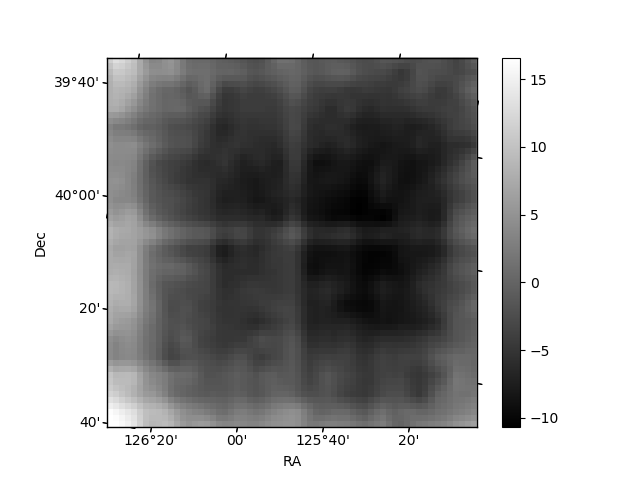
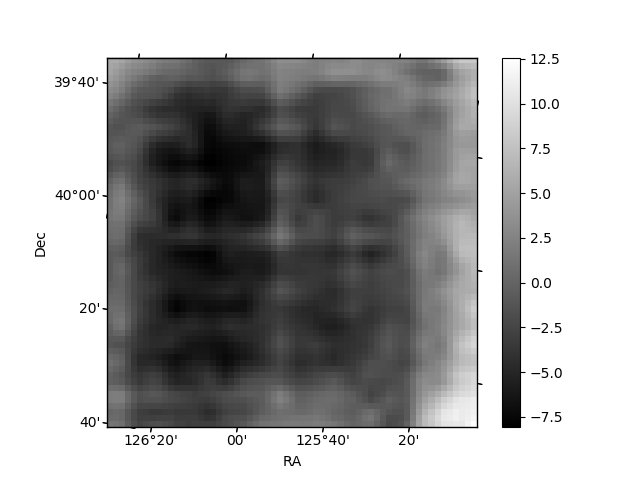
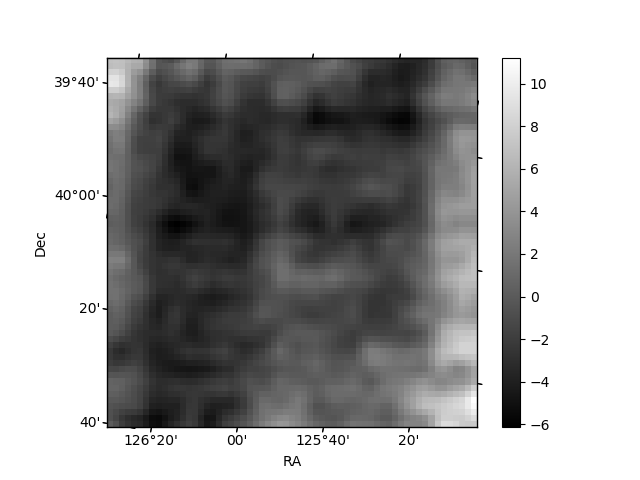
Histogram calculated using DETX and DETY for each event in the final _common_clean file
| Quadrant A | 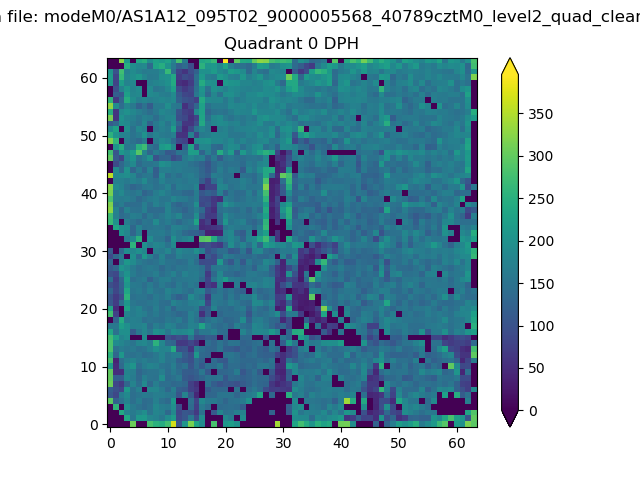 |
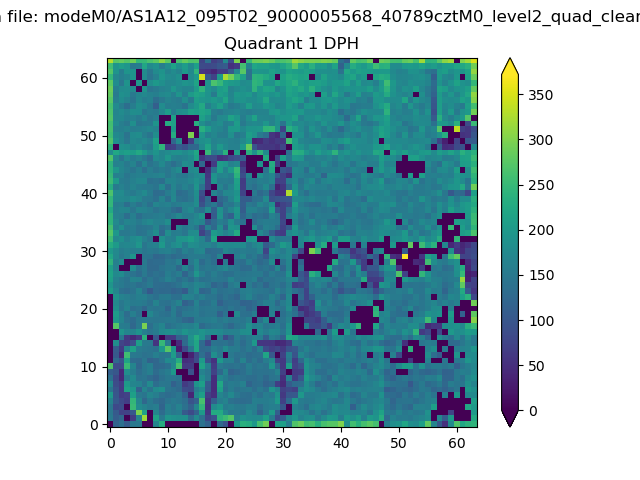 |
Quadrant B |
|---|---|---|---|
| Quadrant D | 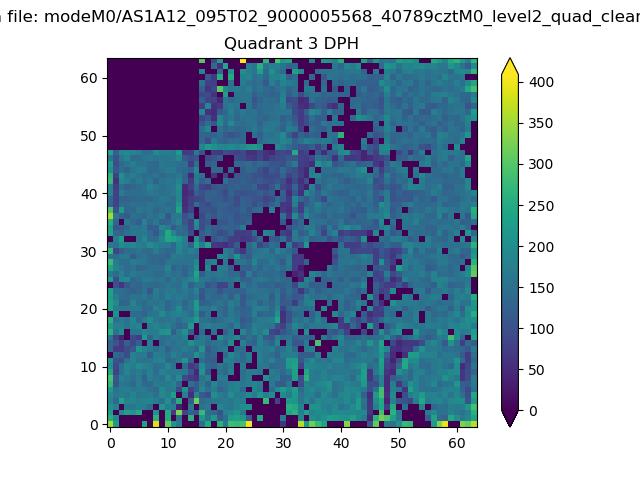 |
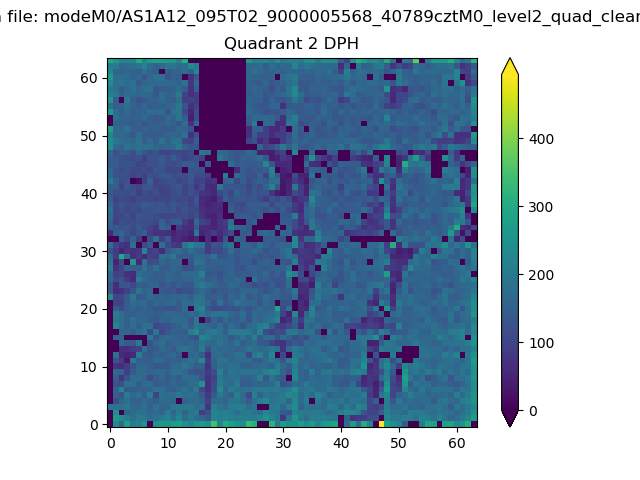 |
Quadrant C |
| Plot type | Count rate plots | Images |
|---|---|---|
| Comparison with Poisson distribution Blue bars denote a histogram of data divided into 1 sec bins. Red curve is a Poisson curve with rate = median count rate of data. |
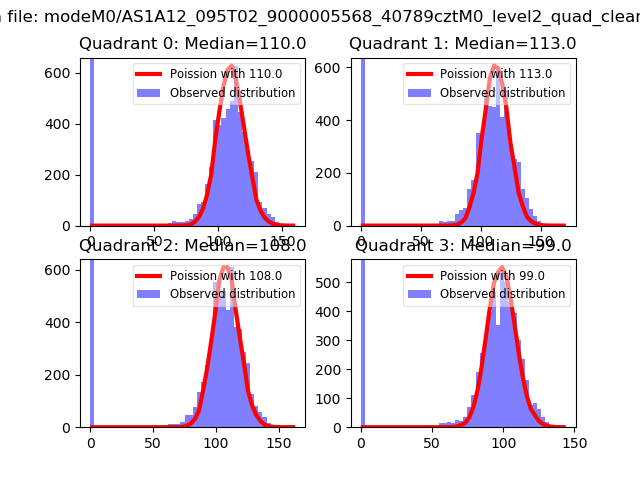 |
 |
| Quadrant-wise count rates Data is divided into 100 sec bins |
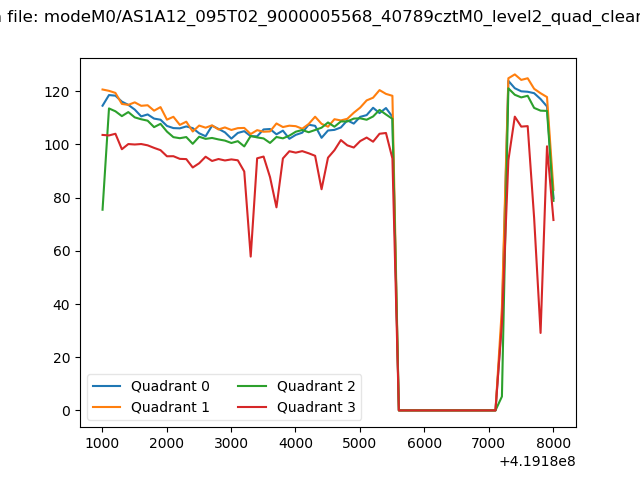 |
|
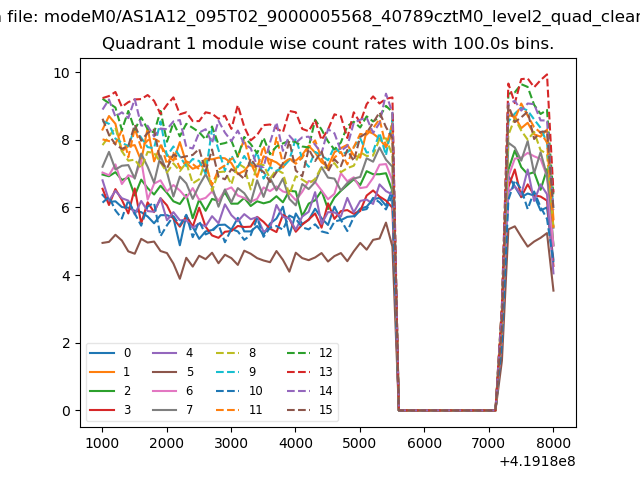
| Module-wise count rates for Quadrant A Data is divided into 100 sec bins |
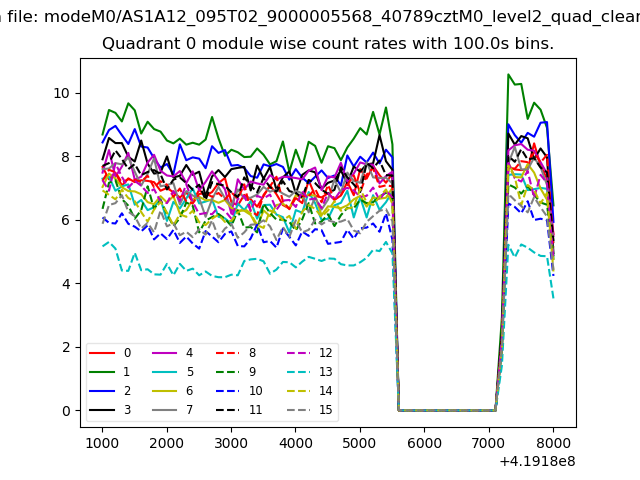 |
 |
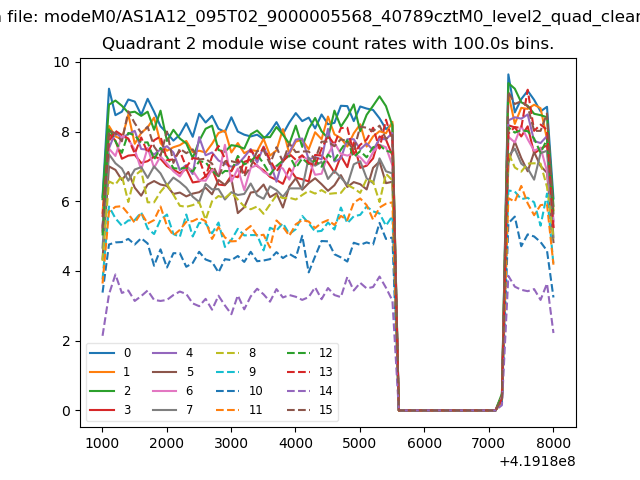
| Module-wise count rates for Quadrant B Data is divided into 100 sec bins |
 |
 |
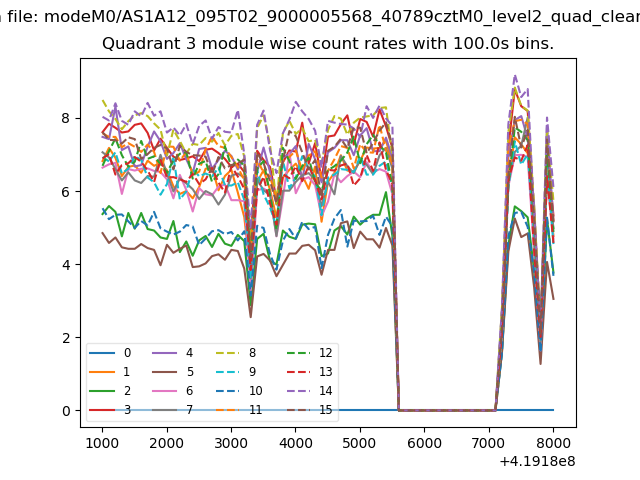
| Module-wise count rates for Quadrant C Data is divided into 100 sec bins |
 |
 |
| Module-wise count rates for Quadrant D Data is divided into 100 sec bins |
 |
 |
| Parameter | Plot |
|---|---|
| CZT HV Monitor | 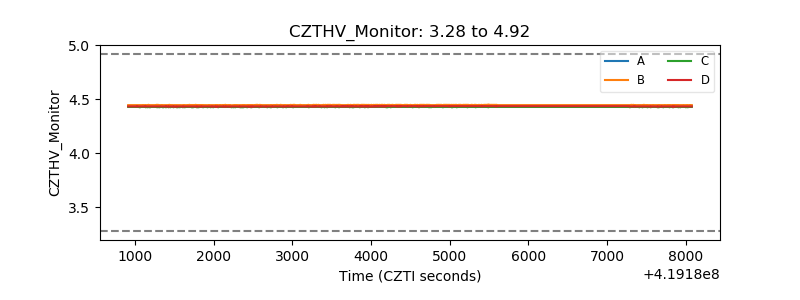 |
| D_VDD | 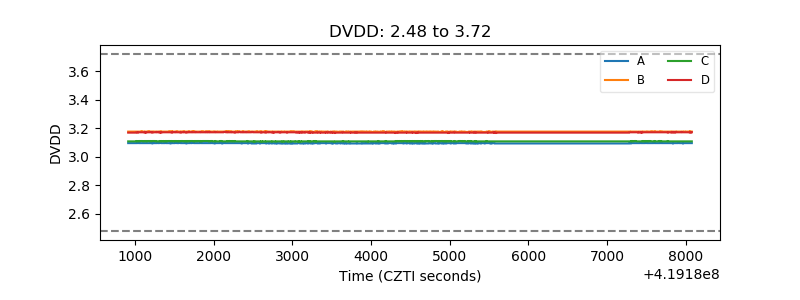 |
| Temperature 1 | 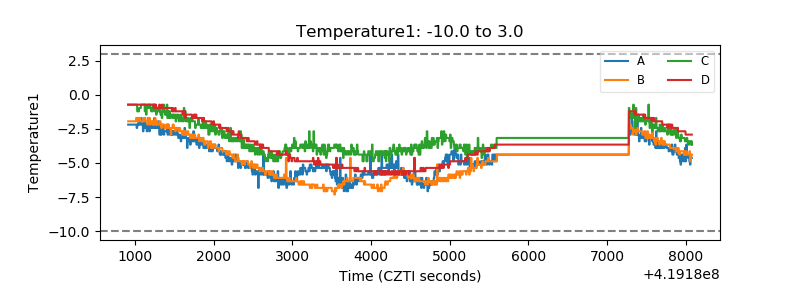 |
| Veto HV Monitor |  |
| Veto LLD | 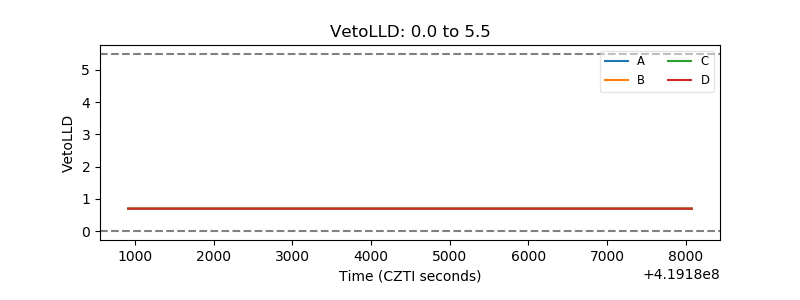 |
| Alpha Counter | 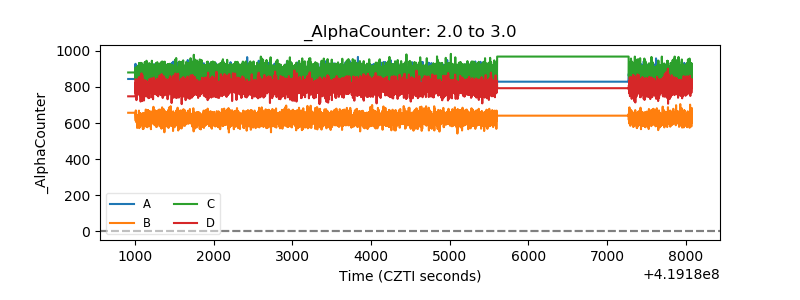 |
| _CPM_Rate | 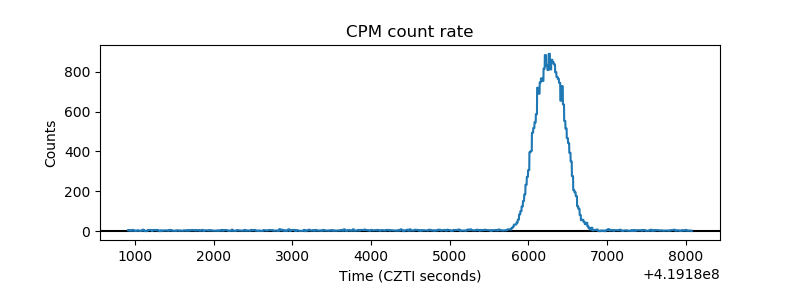 |
| CZT Counter | 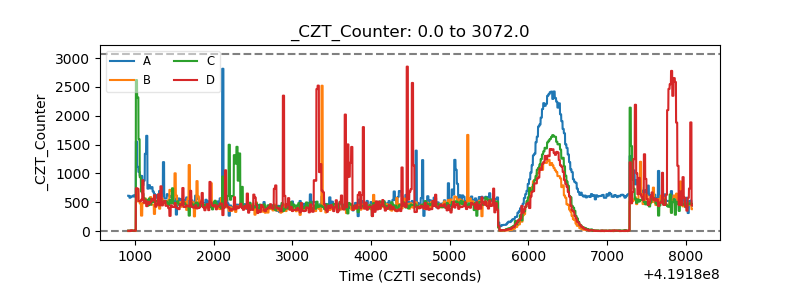 |
| +2.5 Volts monitor | 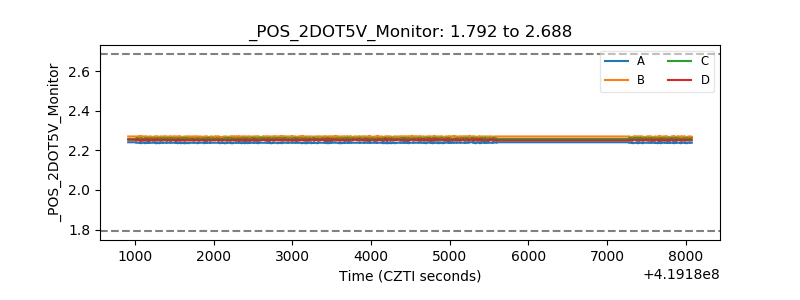 |
| +5 Volts monitor |  |
| _ROLL_ROT | 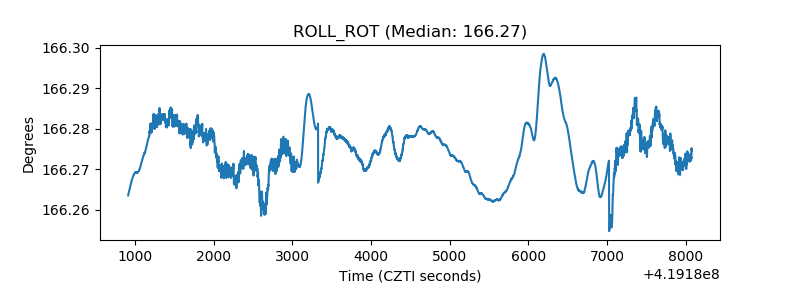 |
| _Roll_DEC | 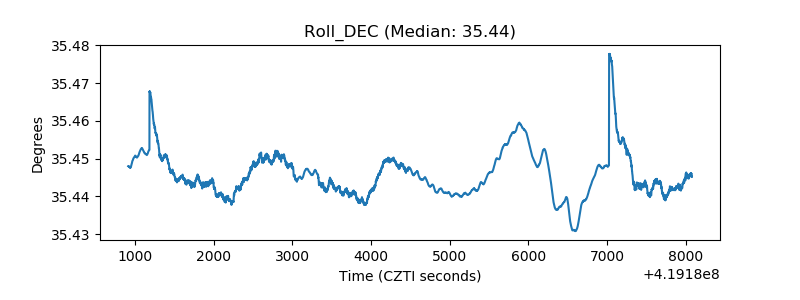 |
| _Roll_RA | 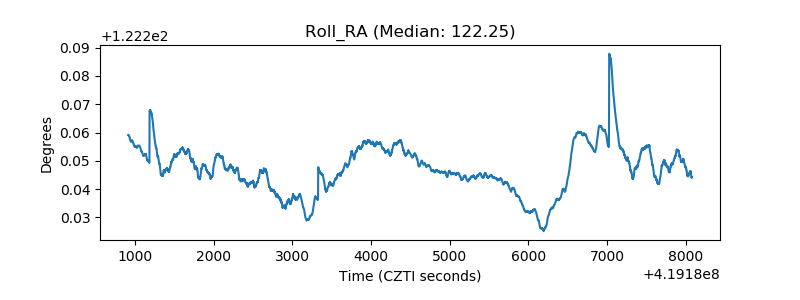 |
| Veto Counter | 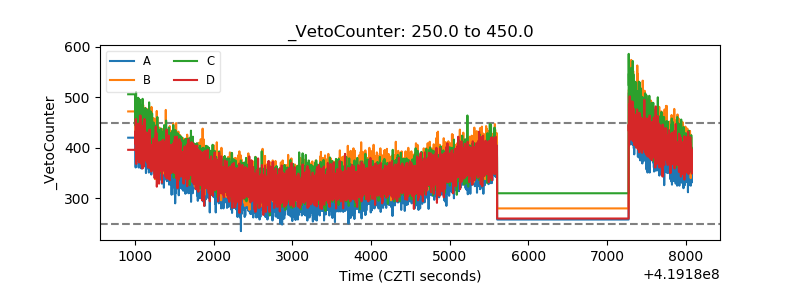 |