| Param | Original file | Final file |
|---|---|---|
| Filename | modeM0/AS1A12_095T02_9000005568_40792cztM0_level2.fits | modeM0/AS1A12_095T02_9000005568_40792cztM0_level2_quad_clean.evt |
| Size (bytes) | 335,540,160 | 86,872,320 |
| Size | 320.0 MB | 82.8 MB |
| Events in quadrant A | 2,874,595 | 590,833 |
| Events in quadrant B | 3,578,722 | 589,405 |
| Events in quadrant C | 2,690,793 | 575,247 |
| Events in quadrant D | 2,882,208 | 520,782 |
| Mode M9 | |||
|---|---|---|---|
| Quadrant | BADHDUFLAG | Total packets | Discarded packets |
| A | 0 | 26 | 0 |
| B | 0 | 26 | 0 |
| C | 0 | 26 | 0 |
| D | 0 | 27 | 0 |
| Mode SS | |||
|---|---|---|---|
| Quadrant | BADHDUFLAG | Total packets | Discarded packets |
| A | 0 | 102 | 0 |
| B | 0 | 102 | 0 |
| C | 0 | 102 | 0 |
| D | 0 | 102 | 0 |
| Mode M0 | |||
|---|---|---|---|
| Quadrant | BADHDUFLAG | Total packets | Discarded packets |
| A | 0 | 11633 | 3 |
| B | 0 | 13883 | 2 |
| C | 0 | 11081 | 2 |
| D | 0 | 12227 | 2 |
| Quadrant | Total seconds | Saturated seconds | Saturation percentage |
|---|---|---|---|
| A | 5058 | 20 | 0.395413% |
| B | 5058 | 329 | 6.504547% |
| C | 5058 | 89 | 1.759589% |
| D | 5058 | 163 | 3.222618% |
Noise dominated data is calculated using 1-second bins in cleaned event files. If a bin has >2000 counts, and if more than 50% of those come from <1% of pixels, then it is considered to be noise-dominated and hence unusable.
| Quadrant | # 1 sec bins | Bins with >0 counts | Bins with >2000 counts | High rate bins dominated by noise | Noise dominated (total time) | Noise dominated (detector-on time) | Marked lightcurve |
|---|---|---|---|---|---|---|---|
| A | 7001 | 5059 | 11 | 11 | 0.16% | 0.22% | 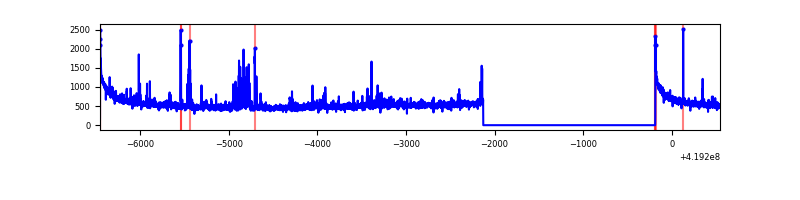 |
| B | 7000 | 5058 | 342 | 342 | 4.89% | 6.76% | 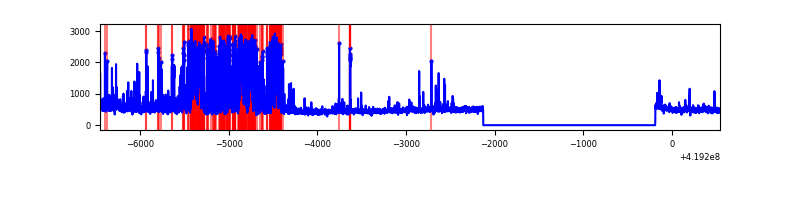 |
| C | 7000 | 5058 | 94 | 94 | 1.34% | 1.86% | 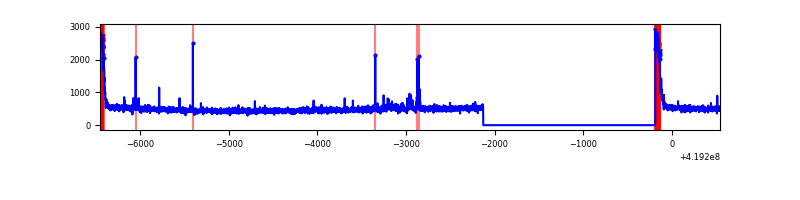 |
| D | 7001 | 5059 | 140 | 140 | 2.00% | 2.77% | 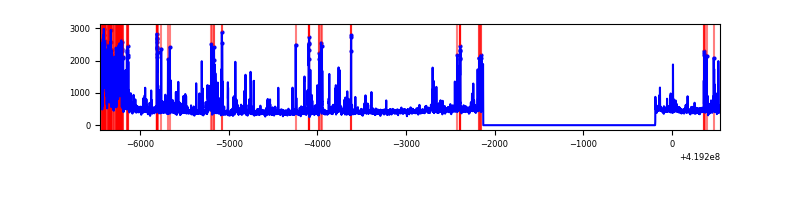 |
Top three noisy pixels from each quadrant. If the there are fewer than three noisy pixels in the level2.evt file, extra rows are filled as -1
| Pixel properties | Quadrant properties | ||||||
|---|---|---|---|---|---|---|---|
| Quadrant | DetID | PixID | Counts | Sigma | Mean | Median | Sigma |
| A | 10 | 83 | 481258 | 4159.98 | 564 | 554 | 115.6 |
| A | 13 | 248 | 135200 | 1165.22 | 564 | 554 | 115.6 |
| A | 12 | 189 | 46562 | 398.15 | 564 | 554 | 115.6 |
| B | 12 | 18 | 1071726 | 10002.07 | 555 | 539 | 107.1 |
| B | 7 | 202 | 201884 | 1880.03 | 555 | 539 | 107.1 |
| B | 5 | 255 | 69564 | 644.51 | 555 | 539 | 107.1 |
| C | 0 | 10 | 237120 | 1827.62 | 553 | 556 | 129.4 |
| C | 15 | 214 | 216848 | 1671.0 | 553 | 556 | 129.4 |
| C | 14 | 254 | 53600 | 409.8 | 553 | 556 | 129.4 |
| D | 2 | 249 | 421697 | 3131.65 | 542 | 527 | 134.5 |
| D | 1 | 47 | 124631 | 922.79 | 542 | 527 | 134.5 |
| D | 2 | 153 | 109662 | 811.48 | 542 | 527 | 134.5 |
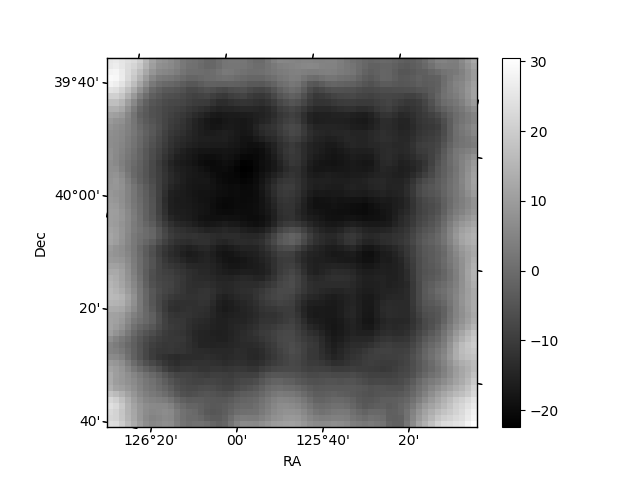
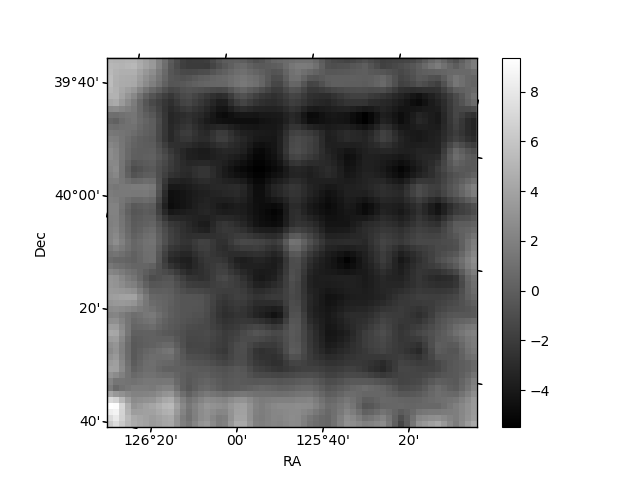
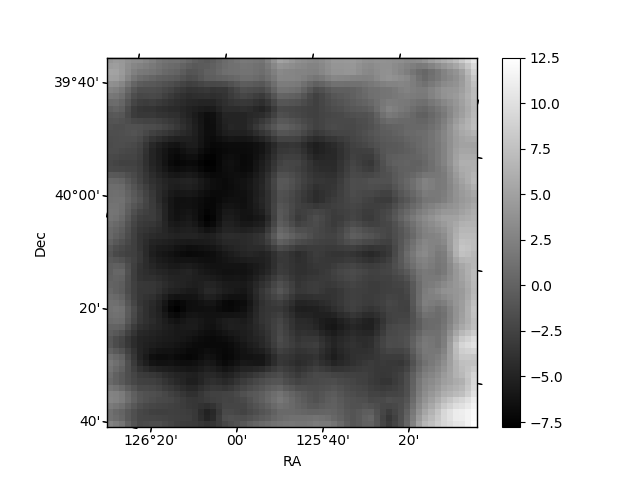
Histogram calculated using DETX and DETY for each event in the final _common_clean file
| Quadrant A | 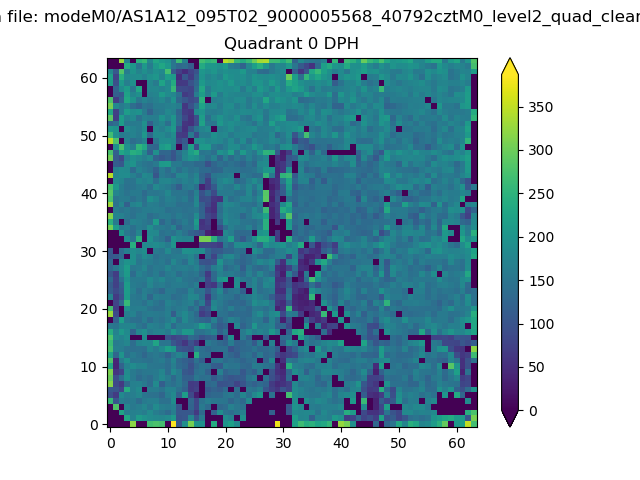 |
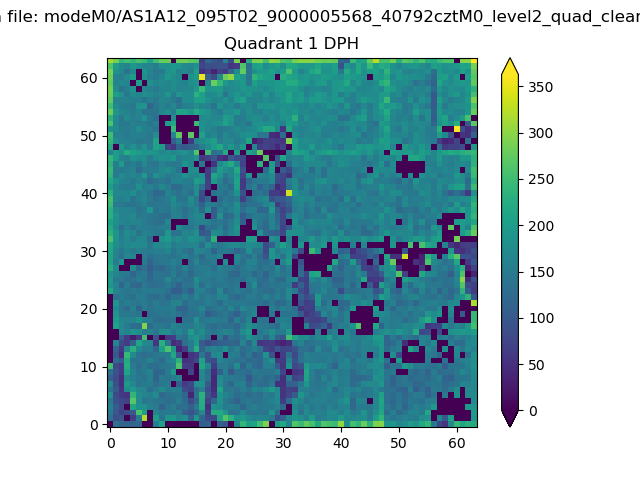 |
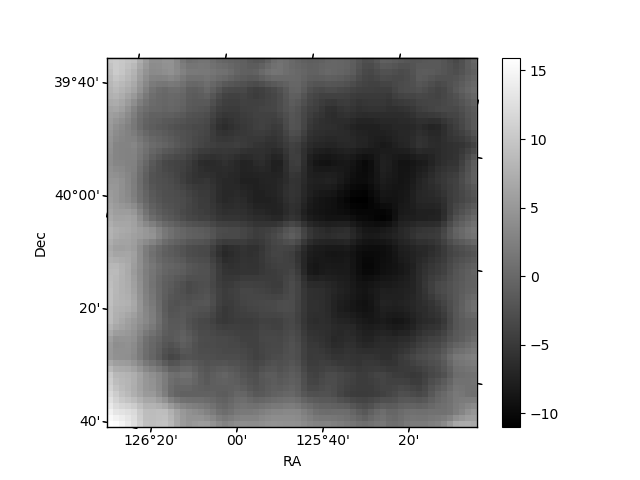
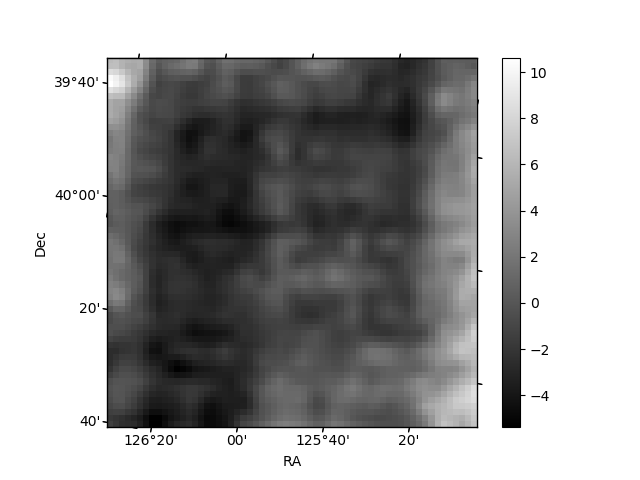
Quadrant B |
|---|---|---|---|
| Quadrant D | 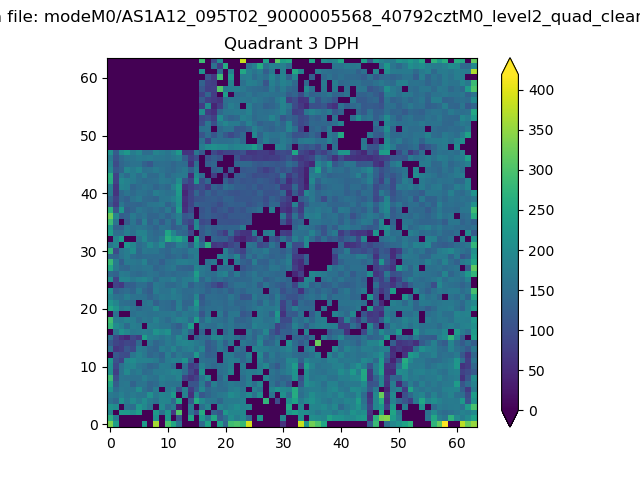 |
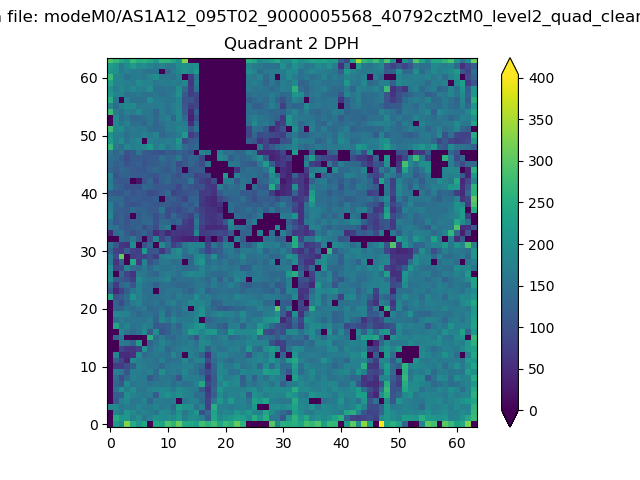 |
Quadrant C |
| Plot type | Count rate plots | Images |
|---|---|---|
| Comparison with Poisson distribution Blue bars denote a histogram of data divided into 1 sec bins. Red curve is a Poisson curve with rate = median count rate of data. |
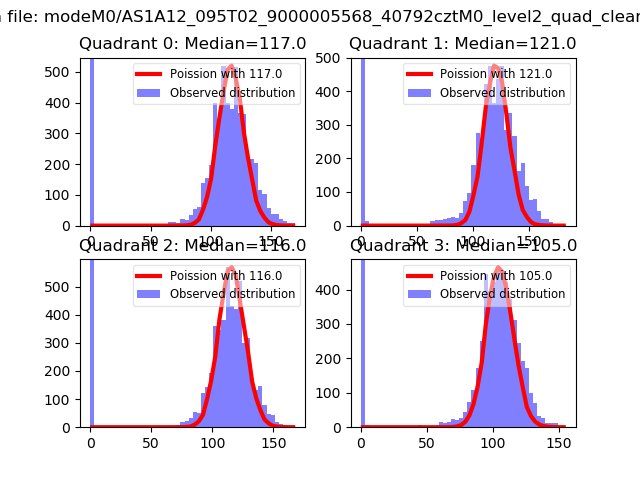 |
 |
| Quadrant-wise count rates Data is divided into 100 sec bins |
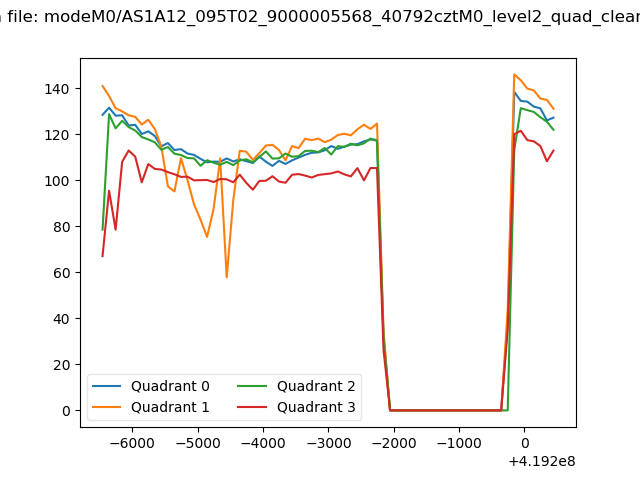 |
|
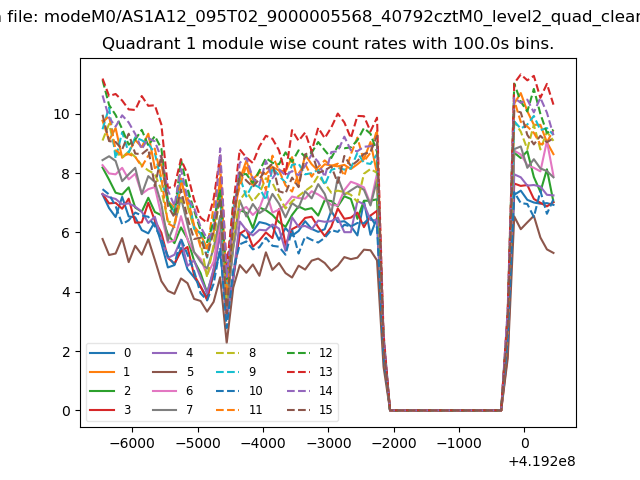
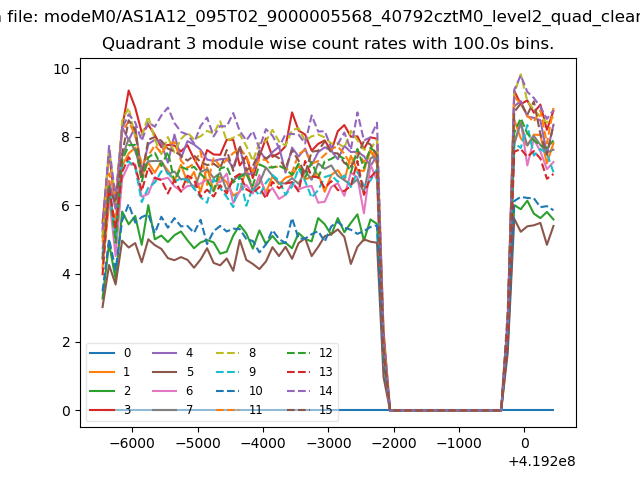
| Module-wise count rates for Quadrant A Data is divided into 100 sec bins |
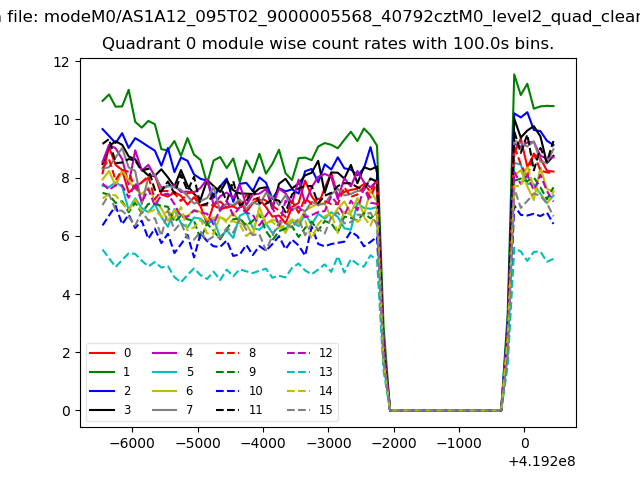 |
 |
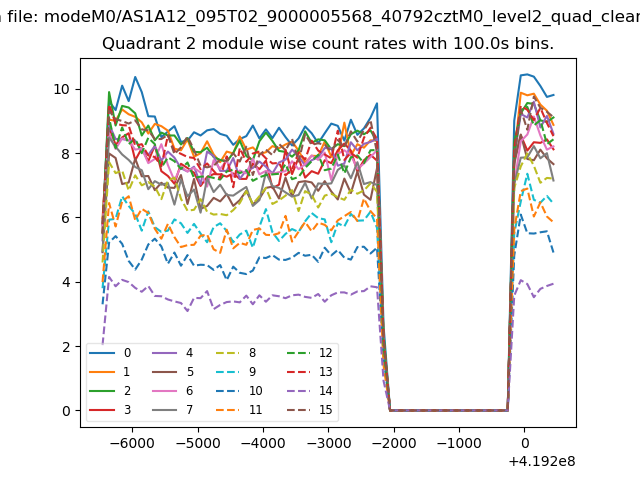
| Module-wise count rates for Quadrant B Data is divided into 100 sec bins |
 |
 |
| Module-wise count rates for Quadrant C Data is divided into 100 sec bins |
 |
 |
| Module-wise count rates for Quadrant D Data is divided into 100 sec bins |
 |
 |
| Parameter | Plot |
|---|---|
| CZT HV Monitor |  |
| D_VDD | 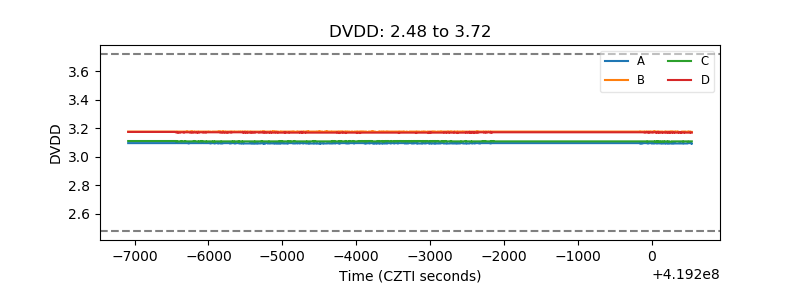 |
| Temperature 1 | 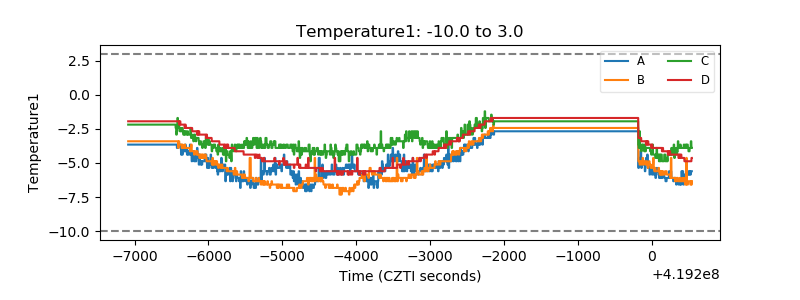 |
| Veto HV Monitor | 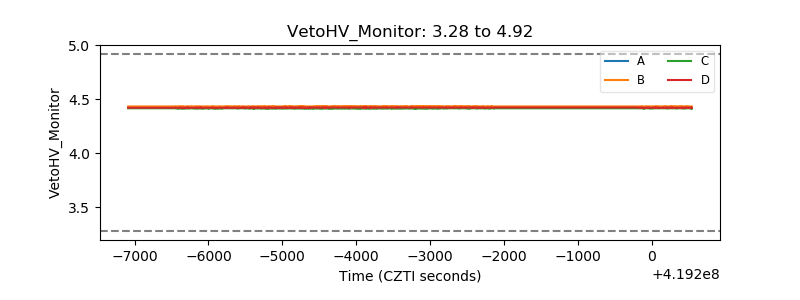 |
| Veto LLD | 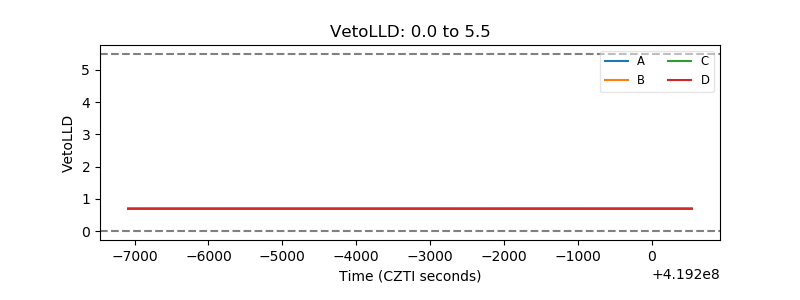 |
| Alpha Counter | 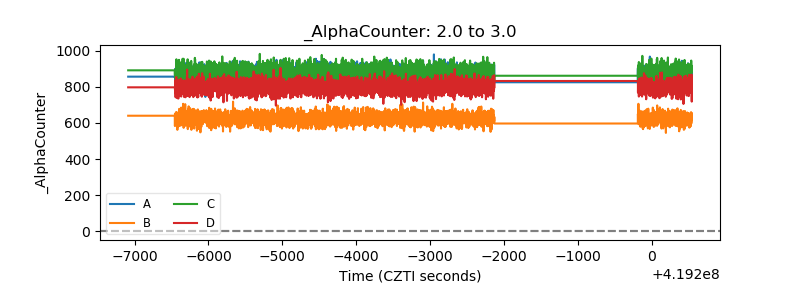 |
| _CPM_Rate |  |
| CZT Counter | 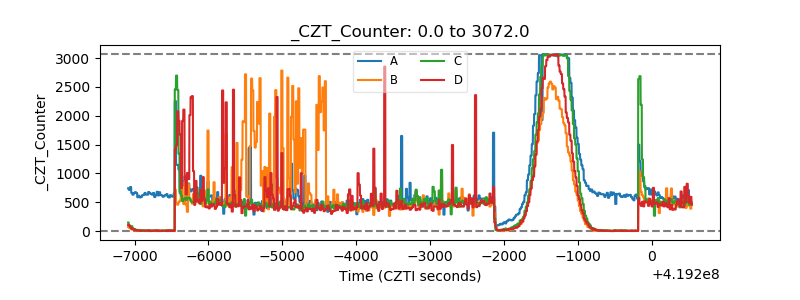 |
| +2.5 Volts monitor | 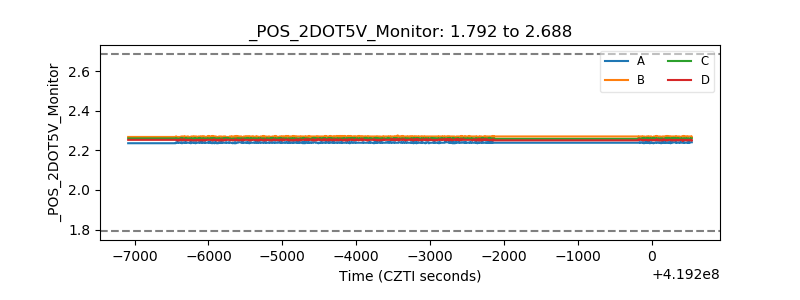 |
| +5 Volts monitor | 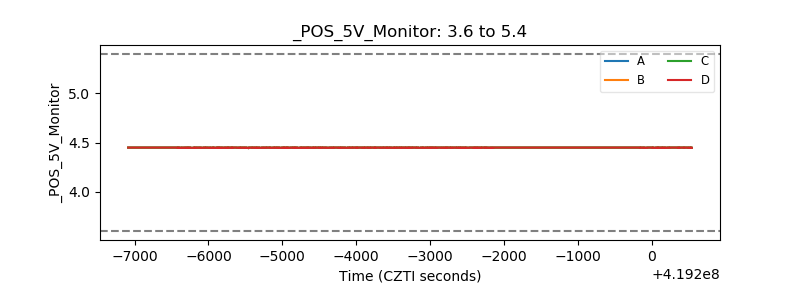 |
| _ROLL_ROT | 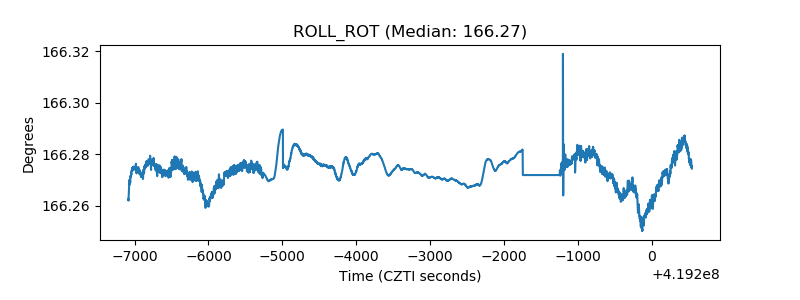 |
| _Roll_DEC | 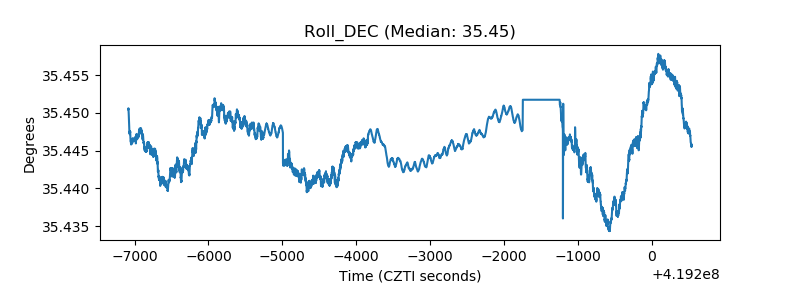 |
| _Roll_RA | 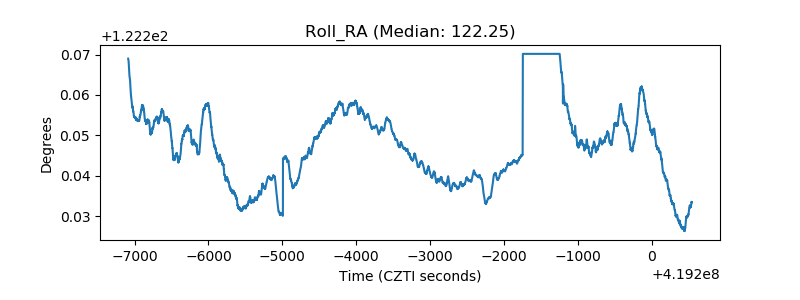 |
| Veto Counter | 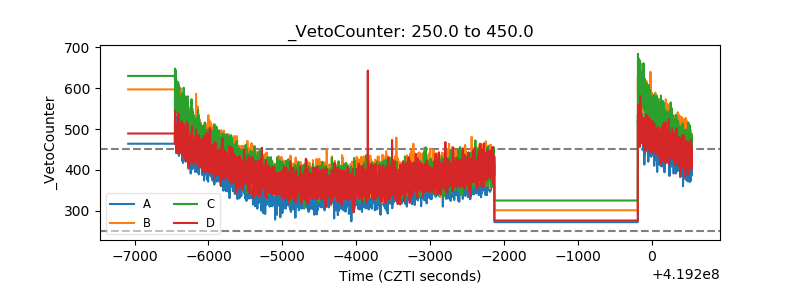 |