| Param | Original file | Final file |
|---|---|---|
| Filename | modeM0/AS1A12_095T02_9000005568_40794cztM0_level2.fits | modeM0/AS1A12_095T02_9000005568_40794cztM0_level2_quad_clean.evt |
| Size (bytes) | 312,416,640 | 84,686,400 |
| Size | 297.9 MB | 80.8 MB |
| Events in quadrant A | 2,677,108 | 573,296 |
| Events in quadrant B | 3,336,035 | 582,897 |
| Events in quadrant C | 2,510,528 | 561,359 |
| Events in quadrant D | 2,666,970 | 510,046 |
| Mode M9 | |||
|---|---|---|---|
| Quadrant | BADHDUFLAG | Total packets | Discarded packets |
| A | 0 | 33 | 0 |
| B | 0 | 33 | 0 |
| C | 0 | 33 | 0 |
| D | 0 | 34 | 0 |
| Mode SS | |||
|---|---|---|---|
| Quadrant | BADHDUFLAG | Total packets | Discarded packets |
| A | 0 | 98 | 0 |
| B | 0 | 98 | 0 |
| C | 0 | 98 | 0 |
| D | 0 | 98 | 0 |
| Mode M0 | |||
|---|---|---|---|
| Quadrant | BADHDUFLAG | Total packets | Discarded packets |
| A | 0 | 10845 | 3 |
| B | 0 | 13053 | 2 |
| C | 0 | 10334 | 2 |
| D | 0 | 11265 | 2 |
| Quadrant | Total seconds | Saturated seconds | Saturation percentage |
|---|---|---|---|
| A | 4799 | 31 | 0.645968% |
| B | 4799 | 253 | 5.271932% |
| C | 4799 | 69 | 1.437800% |
| D | 4799 | 83 | 1.729527% |
Noise dominated data is calculated using 1-second bins in cleaned event files. If a bin has >2000 counts, and if more than 50% of those come from <1% of pixels, then it is considered to be noise-dominated and hence unusable.
| Quadrant | # 1 sec bins | Bins with >0 counts | Bins with >2000 counts | High rate bins dominated by noise | Noise dominated (total time) | Noise dominated (detector-on time) | Marked lightcurve |
|---|---|---|---|---|---|---|---|
| A | 6922 | 4800 | 27 | 27 | 0.39% | 0.56% | 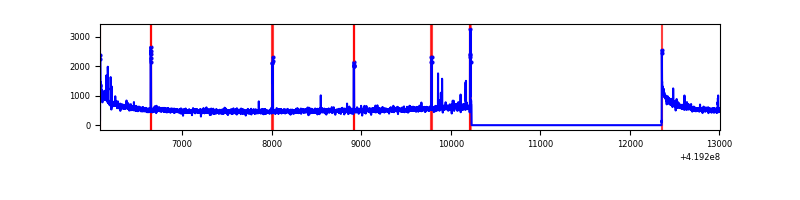 |
| B | 6922 | 4800 | 165 | 165 | 2.38% | 3.44% | 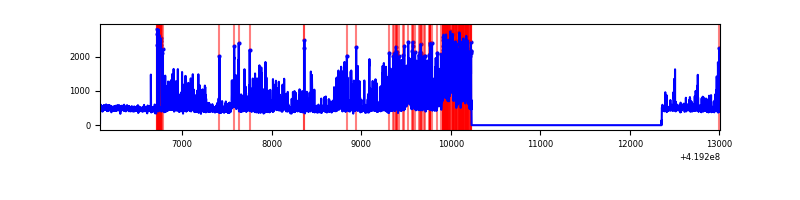 |
| C | 6922 | 4800 | 62 | 62 | 0.90% | 1.29% | 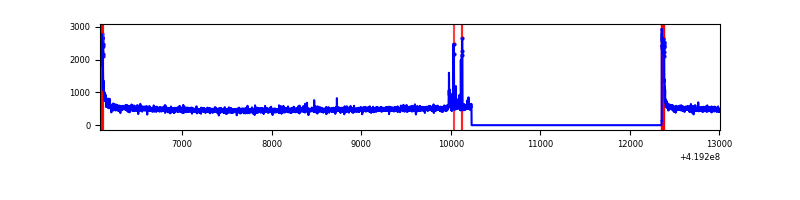 |
| D | 6922 | 4800 | 76 | 76 | 1.10% | 1.58% | 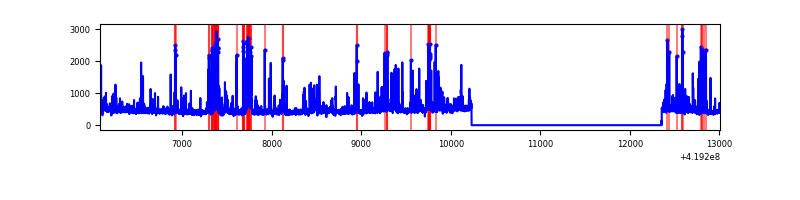 |
Top three noisy pixels from each quadrant. If the there are fewer than three noisy pixels in the level2.evt file, extra rows are filled as -1
| Pixel properties | Quadrant properties | ||||||
|---|---|---|---|---|---|---|---|
| Quadrant | DetID | PixID | Counts | Sigma | Mean | Median | Sigma |
| A | 10 | 83 | 457778 | 4097.06 | 545 | 535 | 111.6 |
| A | 6 | 10 | 47494 | 420.77 | 545 | 535 | 111.6 |
| A | 10 | 255 | 21643 | 189.13 | 545 | 535 | 111.6 |
| B | 7 | 202 | 1085109 | 10308.29 | 544 | 528 | 105.2 |
| B | 5 | 255 | 67069 | 632.43 | 544 | 528 | 105.2 |
| B | 0 | 190 | 20001 | 185.08 | 544 | 528 | 105.2 |
| C | 15 | 214 | 206432 | 1646.83 | 536 | 540 | 125.0 |
| C | 0 | 10 | 161089 | 1284.15 | 536 | 540 | 125.0 |
| C | 14 | 254 | 47204 | 373.24 | 536 | 540 | 125.0 |
| D | 2 | 249 | 386122 | 2949.21 | 526 | 512 | 130.8 |
| D | 1 | 47 | 119813 | 912.43 | 526 | 512 | 130.8 |
| D | 13 | 249 | 98941 | 752.8 | 526 | 512 | 130.8 |
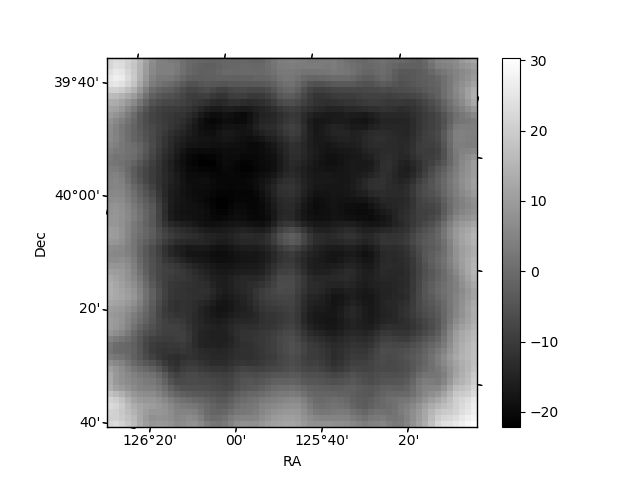
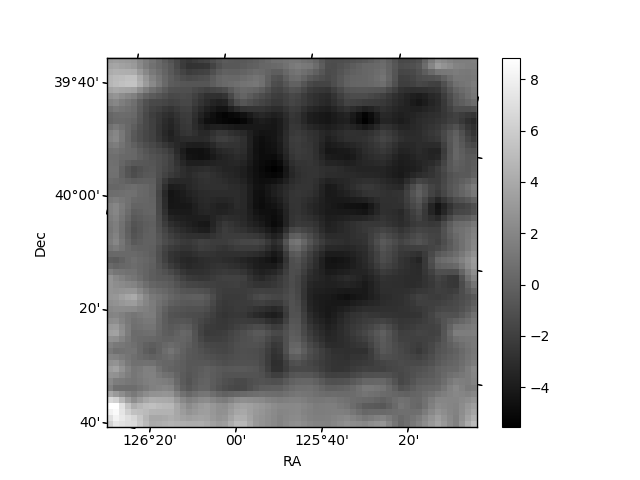
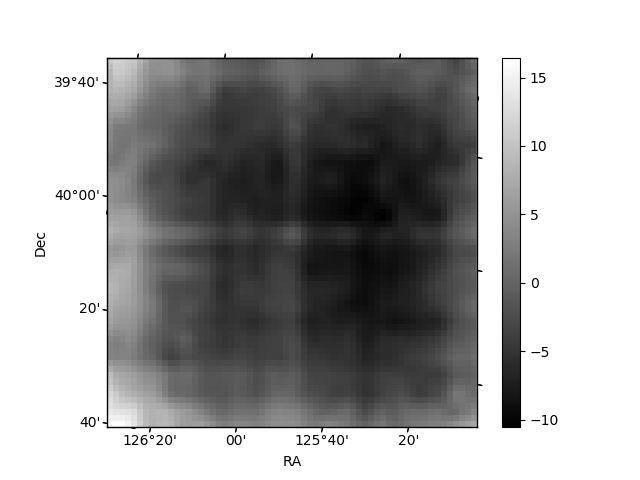
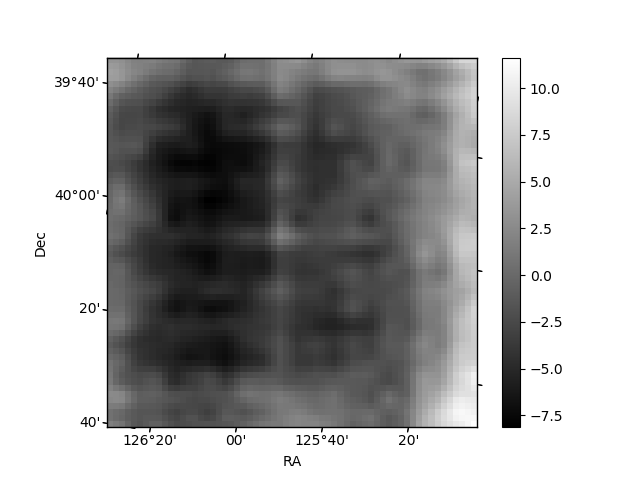
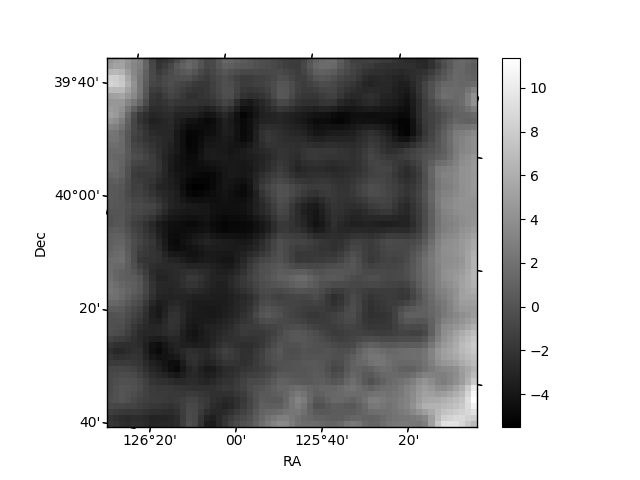
Histogram calculated using DETX and DETY for each event in the final _common_clean file
| Quadrant A | 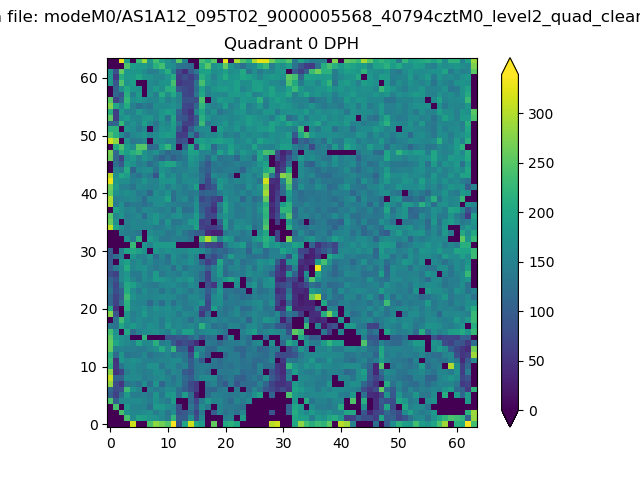 |
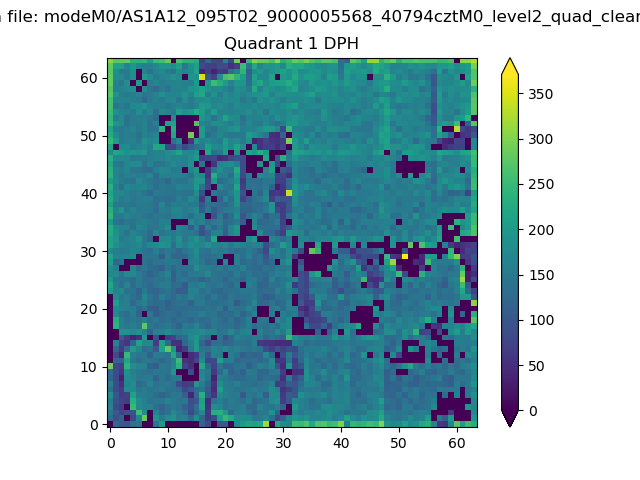 |
Quadrant B |
|---|---|---|---|
| Quadrant D | 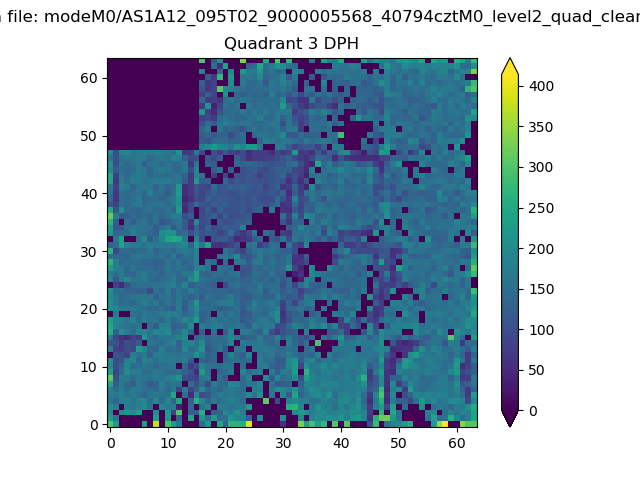 |
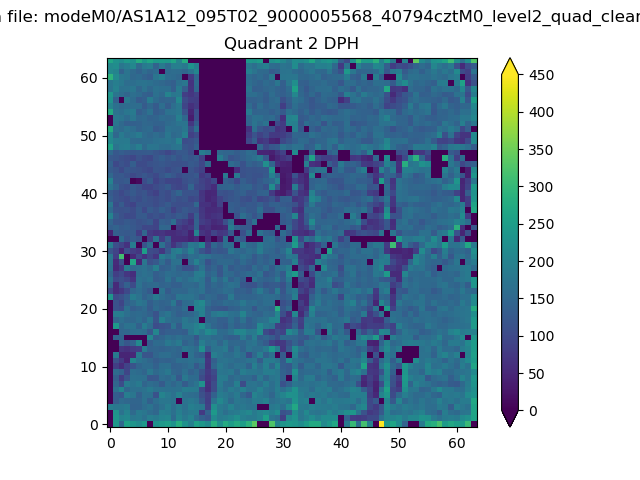 |
Quadrant C |
| Plot type | Count rate plots | Images |
|---|---|---|
| Comparison with Poisson distribution Blue bars denote a histogram of data divided into 1 sec bins. Red curve is a Poisson curve with rate = median count rate of data. |
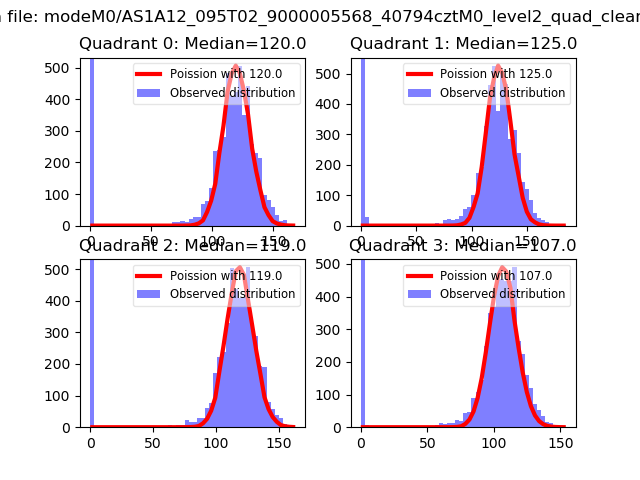 |
 |
| Quadrant-wise count rates Data is divided into 100 sec bins |
 |
|
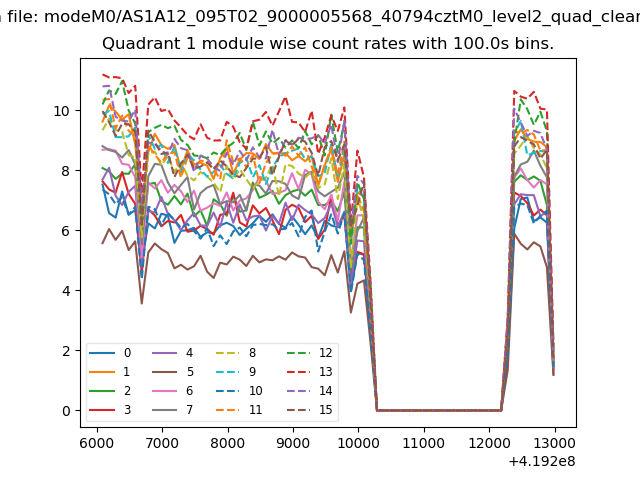
| Module-wise count rates for Quadrant A Data is divided into 100 sec bins |
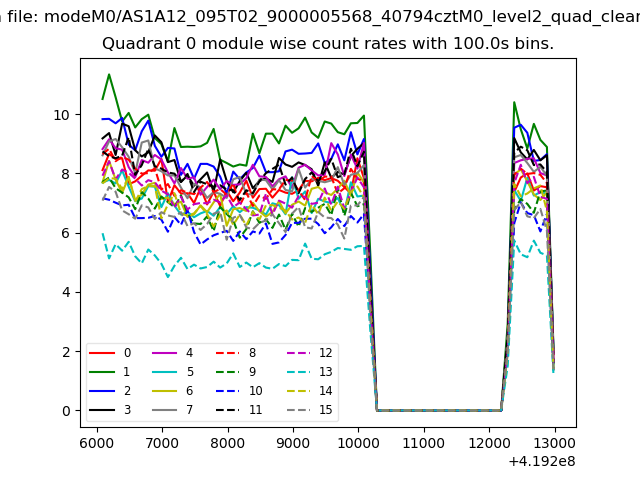 |
 |
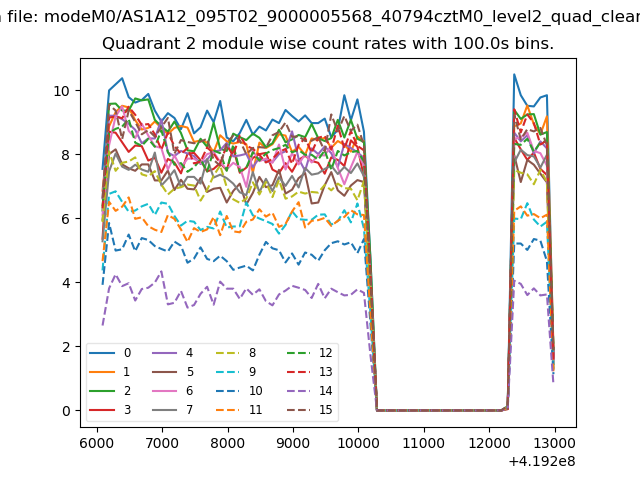
| Module-wise count rates for Quadrant B Data is divided into 100 sec bins |
 |
 |
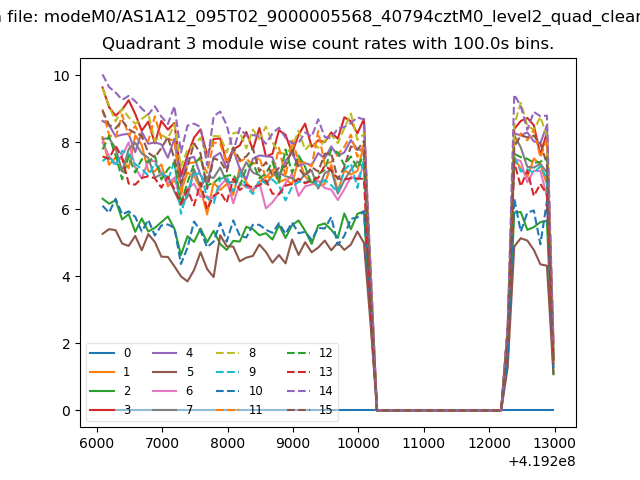
| Module-wise count rates for Quadrant C Data is divided into 100 sec bins |
 |
 |
| Module-wise count rates for Quadrant D Data is divided into 100 sec bins |
 |
 |
| Parameter | Plot |
|---|---|
| CZT HV Monitor |  |
| D_VDD | 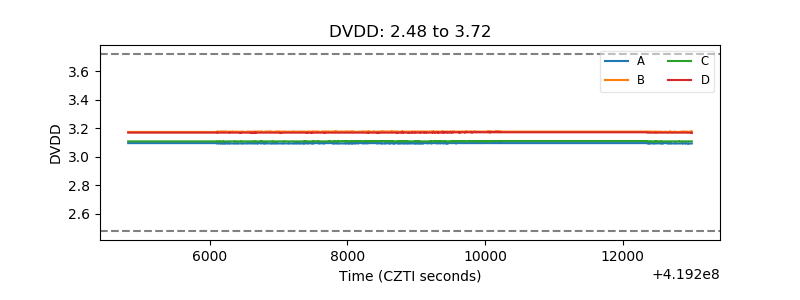 |
| Temperature 1 | 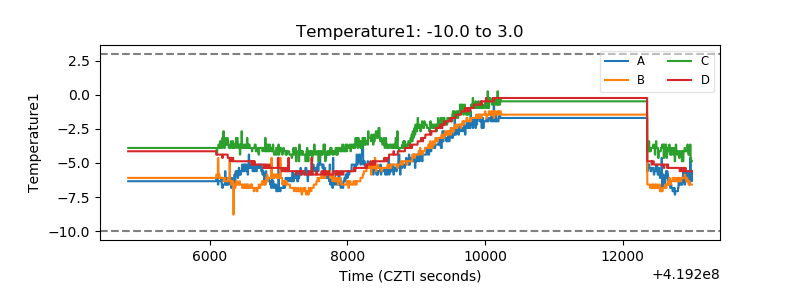 |
| Veto HV Monitor | 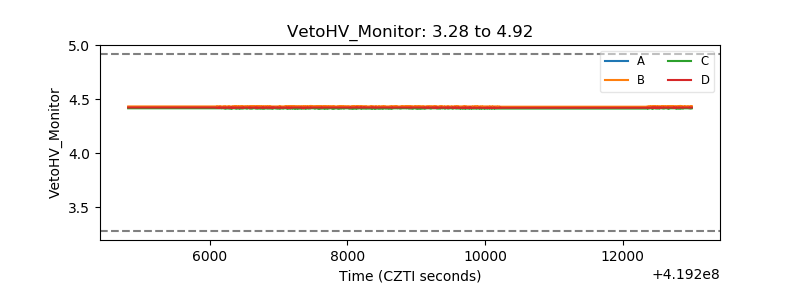 |
| Veto LLD | 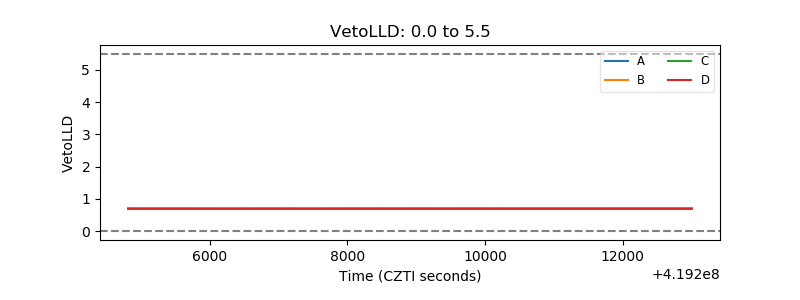 |
| Alpha Counter | 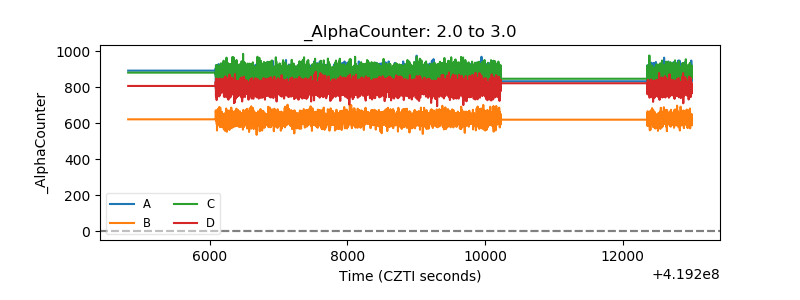 |
| _CPM_Rate | 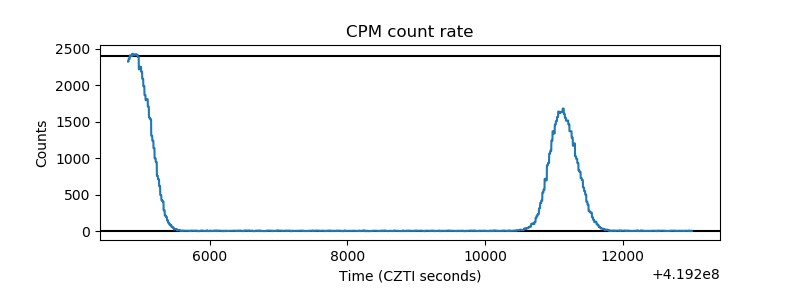 |
| CZT Counter | 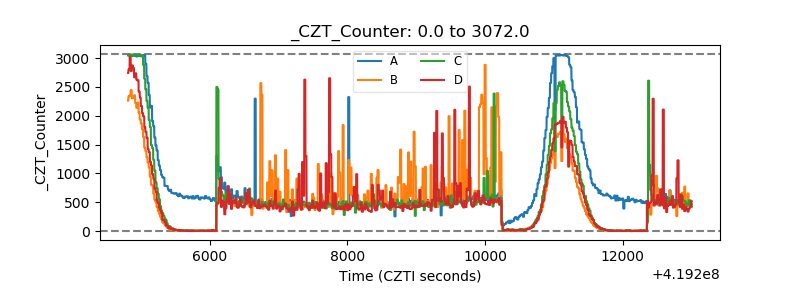 |
| +2.5 Volts monitor | 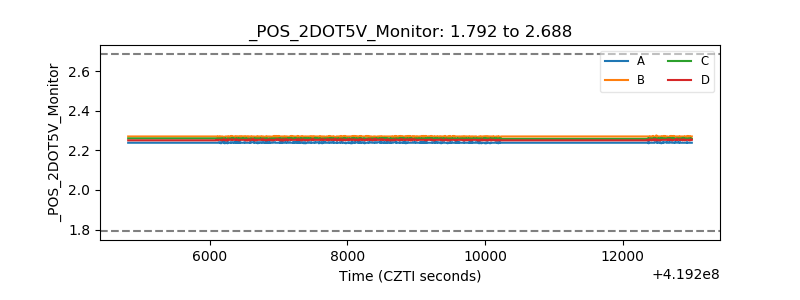 |
| +5 Volts monitor | 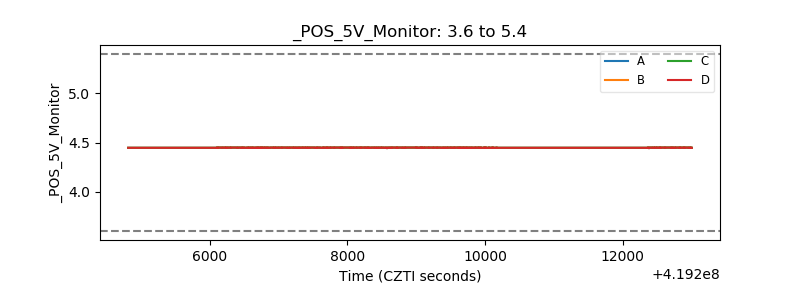 |
| _ROLL_ROT |  |
| _Roll_DEC | 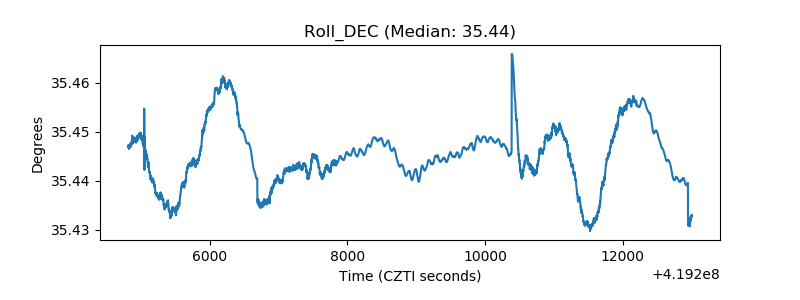 |
| _Roll_RA | 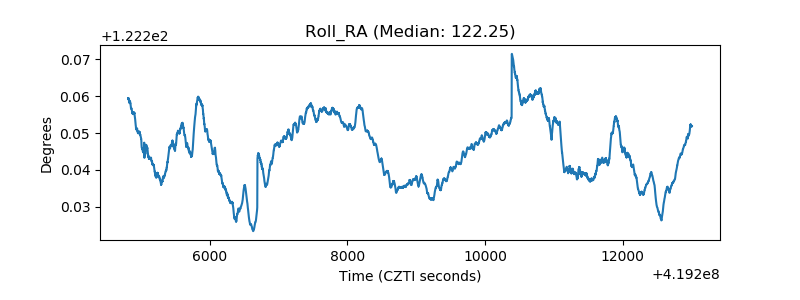 |
| Veto Counter | 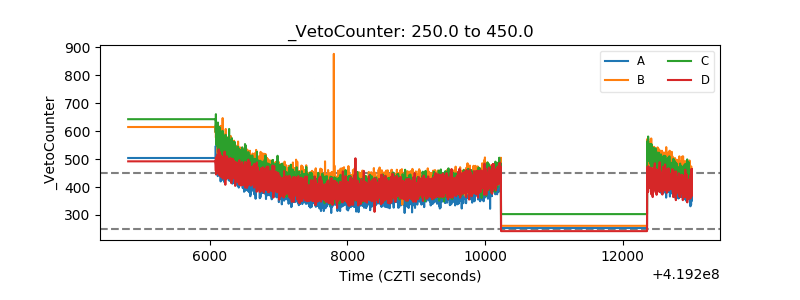 |