| Param | Original file | Final file |
|---|---|---|
| Filename | modeM0/AS1A12_095T02_9000005568_40795cztM0_level2.fits | modeM0/AS1A12_095T02_9000005568_40795cztM0_level2_quad_clean.evt |
| Size (bytes) | 296,490,240 | 84,911,040 |
| Size | 282.8 MB | 81.0 MB |
| Events in quadrant A | 2,663,951 | 567,607 |
| Events in quadrant B | 2,626,494 | 590,505 |
| Events in quadrant C | 2,611,648 | 561,069 |
| Events in quadrant D | 2,690,336 | 507,890 |
| Mode M9 | |||
|---|---|---|---|
| Quadrant | BADHDUFLAG | Total packets | Discarded packets |
| A | 0 | 38 | 0 |
| B | 0 | 38 | 0 |
| C | 0 | 38 | 0 |
| D | 0 | 39 | 0 |
| Mode SS | |||
|---|---|---|---|
| Quadrant | BADHDUFLAG | Total packets | Discarded packets |
| A | 0 | 100 | 0 |
| B | 0 | 100 | 0 |
| C | 0 | 100 | 0 |
| D | 0 | 100 | 0 |
| Mode M0 | |||
|---|---|---|---|
| Quadrant | BADHDUFLAG | Total packets | Discarded packets |
| A | 0 | 10785 | 3 |
| B | 0 | 11049 | 2 |
| C | 0 | 10743 | 2 |
| D | 0 | 11647 | 2 |
| Quadrant | Total seconds | Saturated seconds | Saturation percentage |
|---|---|---|---|
| A | 4907 | 7 | 0.142653% |
| B | 4907 | 64 | 1.304259% |
| C | 4907 | 45 | 0.917057% |
| D | 4907 | 77 | 1.569187% |
Noise dominated data is calculated using 1-second bins in cleaned event files. If a bin has >2000 counts, and if more than 50% of those come from <1% of pixels, then it is considered to be noise-dominated and hence unusable.
| Quadrant | # 1 sec bins | Bins with >0 counts | Bins with >2000 counts | High rate bins dominated by noise | Noise dominated (total time) | Noise dominated (detector-on time) | Marked lightcurve |
|---|---|---|---|---|---|---|---|
| A | 7060 | 4908 | 4 | 4 | 0.06% | 0.08% | 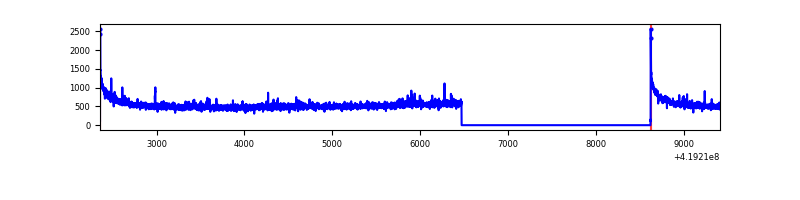 |
| B | 7060 | 4908 | 42 | 42 | 0.59% | 0.86% | 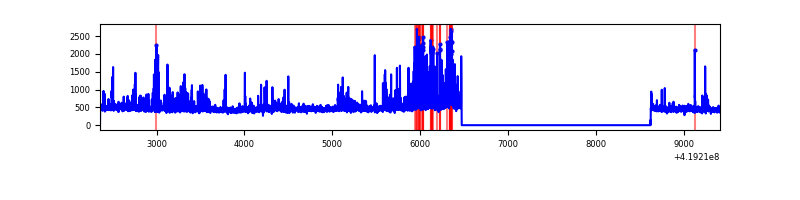 |
| C | 7060 | 4908 | 44 | 44 | 0.62% | 0.90% | 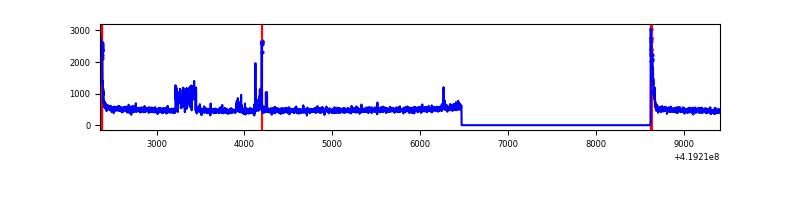 |
| D | 7060 | 4908 | 60 | 60 | 0.85% | 1.22% | 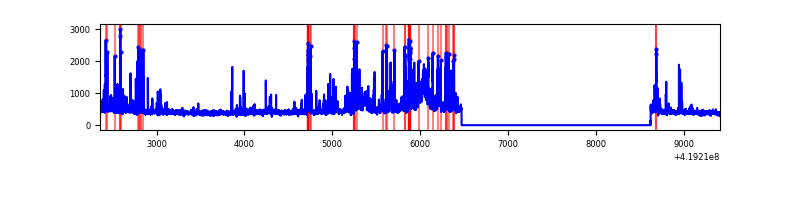 |
Top three noisy pixels from each quadrant. If the there are fewer than three noisy pixels in the level2.evt file, extra rows are filled as -1
| Pixel properties | Quadrant properties | ||||||
|---|---|---|---|---|---|---|---|
| Quadrant | DetID | PixID | Counts | Sigma | Mean | Median | Sigma |
| A | 10 | 83 | 465795 | 4134.08 | 551 | 540 | 112.5 |
| A | 12 | 189 | 41721 | 365.92 | 551 | 540 | 112.5 |
| A | 13 | 254 | 7930 | 65.66 | 551 | 540 | 112.5 |
| B | 7 | 202 | 309434 | 2903.78 | 551 | 536 | 106.4 |
| B | 15 | 85 | 54211 | 504.57 | 551 | 536 | 106.4 |
| B | 5 | 255 | 47783 | 444.14 | 551 | 536 | 106.4 |
| C | 15 | 214 | 212216 | 1695.92 | 538 | 543 | 124.8 |
| C | 0 | 10 | 127056 | 1013.62 | 538 | 543 | 124.8 |
| C | 3 | 233 | 121045 | 965.46 | 538 | 543 | 124.8 |
| D | 2 | 249 | 271074 | 2061.28 | 530 | 515 | 131.3 |
| D | 13 | 171 | 149015 | 1131.36 | 530 | 515 | 131.3 |
| D | 1 | 47 | 84811 | 642.22 | 530 | 515 | 131.3 |
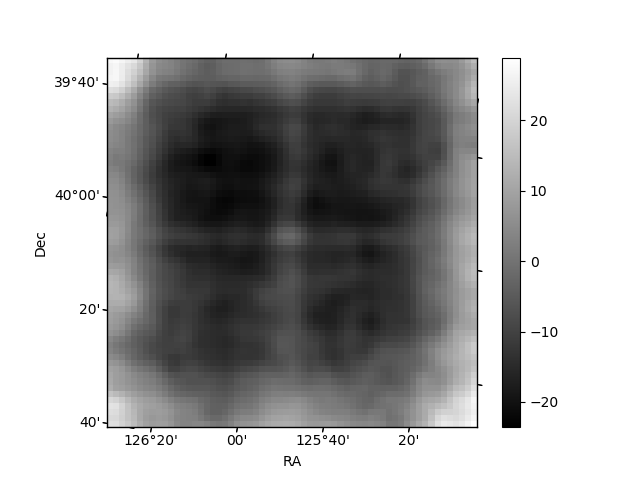
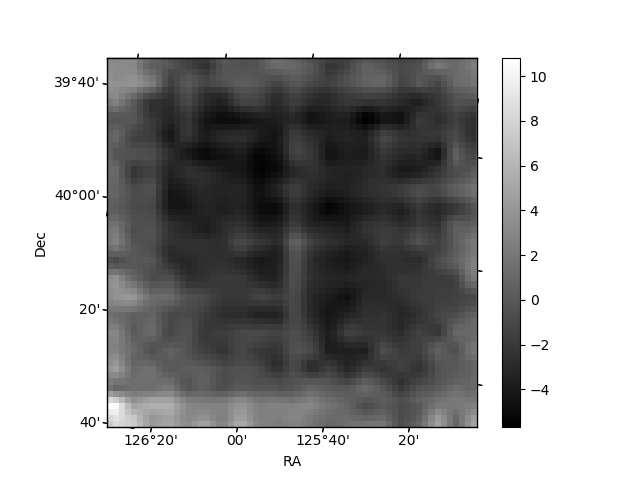
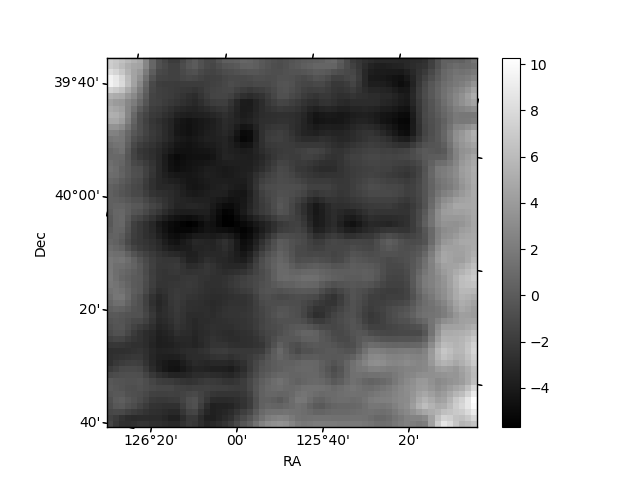
Histogram calculated using DETX and DETY for each event in the final _common_clean file
| Quadrant A | 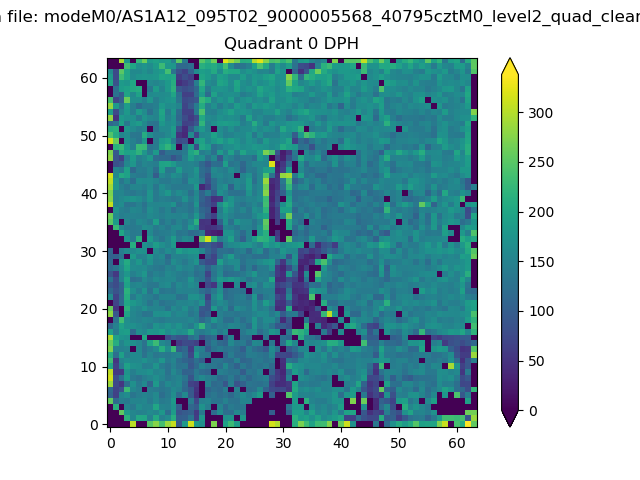 |
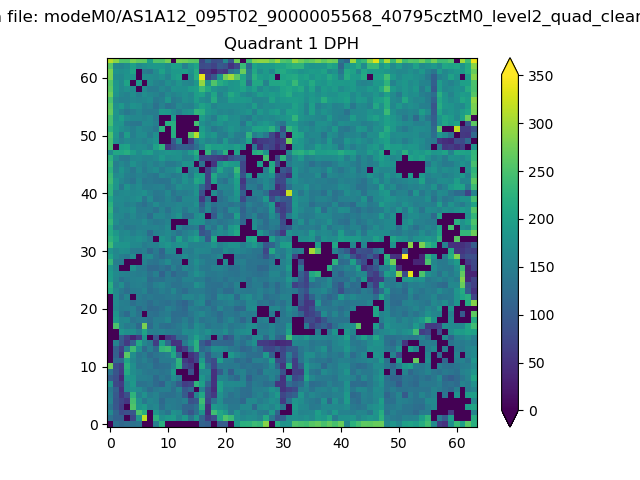 |
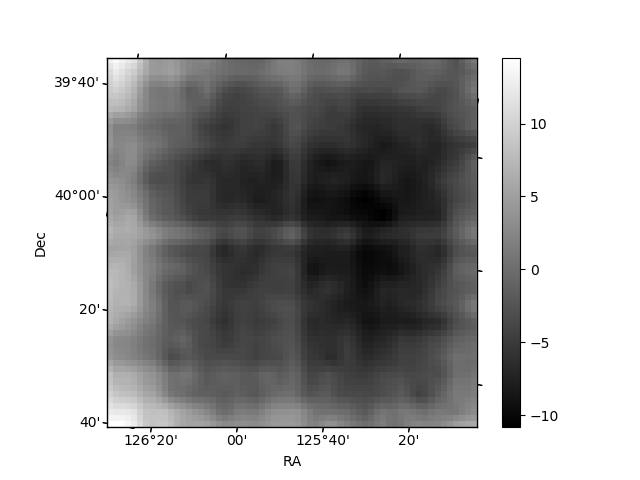
Quadrant B |
|---|---|---|---|
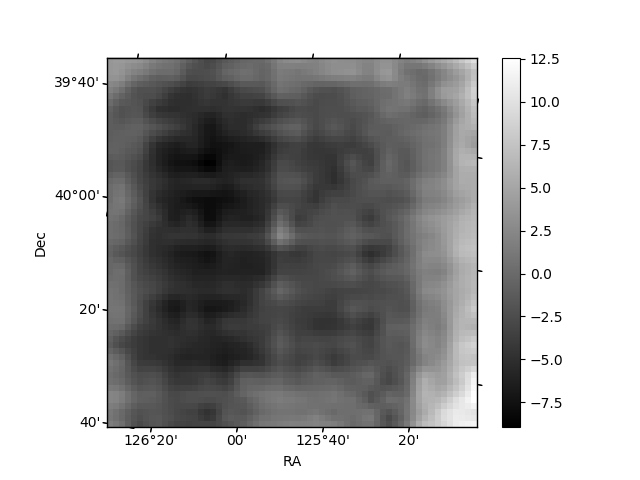
| Quadrant D | 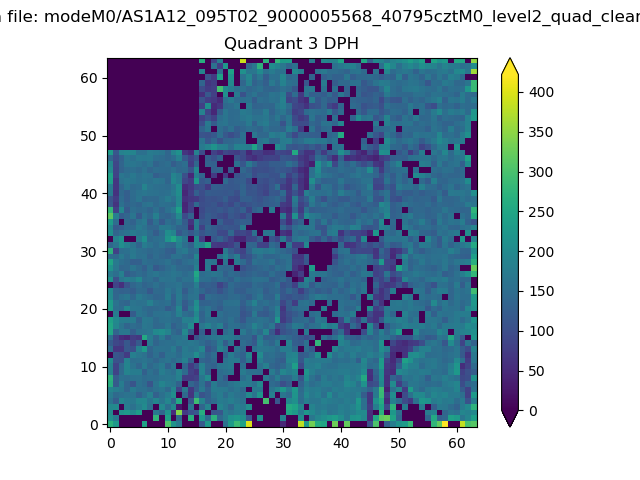 |
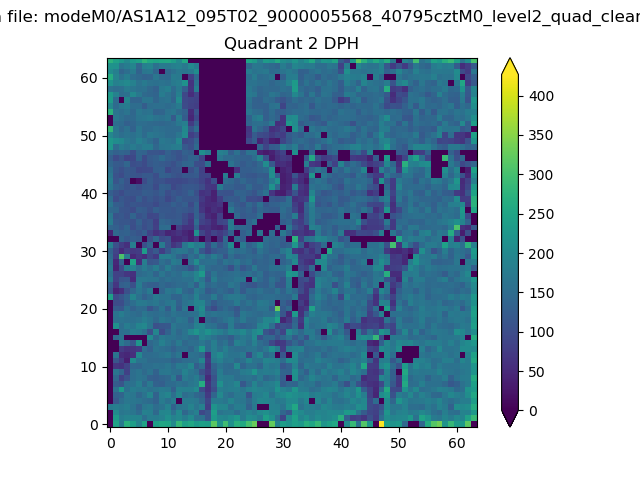 |
Quadrant C |
| Plot type | Count rate plots | Images |
|---|---|---|
| Comparison with Poisson distribution Blue bars denote a histogram of data divided into 1 sec bins. Red curve is a Poisson curve with rate = median count rate of data. |
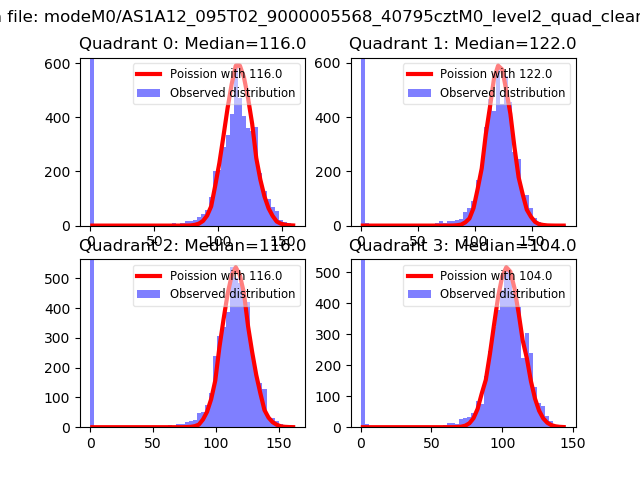 |
 |
| Quadrant-wise count rates Data is divided into 100 sec bins |
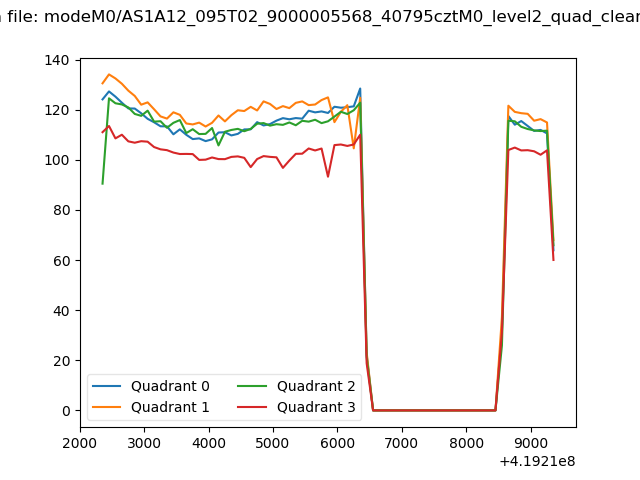 |
|
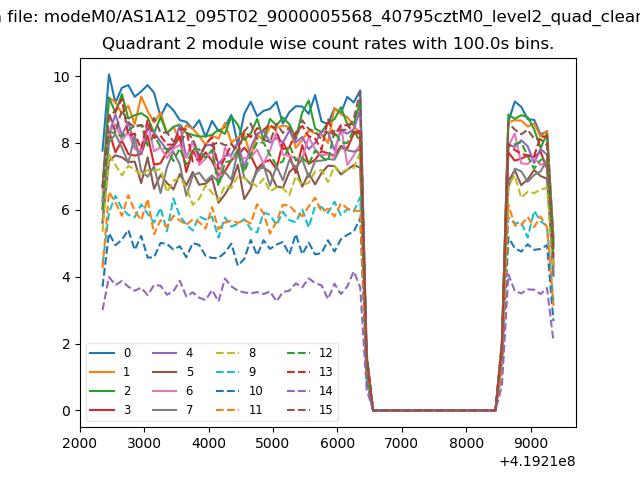
| Module-wise count rates for Quadrant A Data is divided into 100 sec bins |
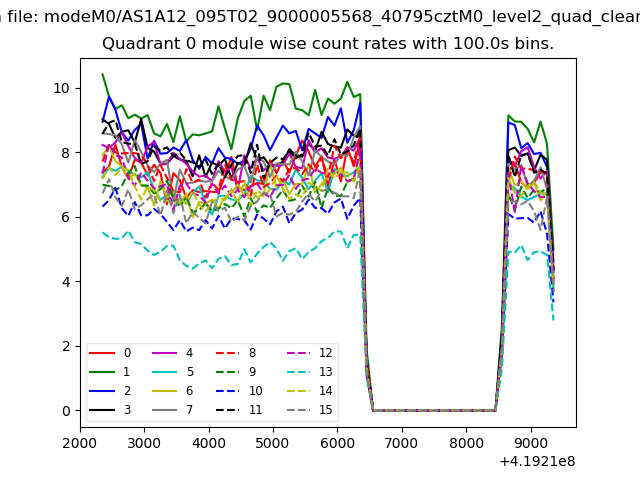 |
 |
| Module-wise count rates for Quadrant B Data is divided into 100 sec bins |
 |
 |
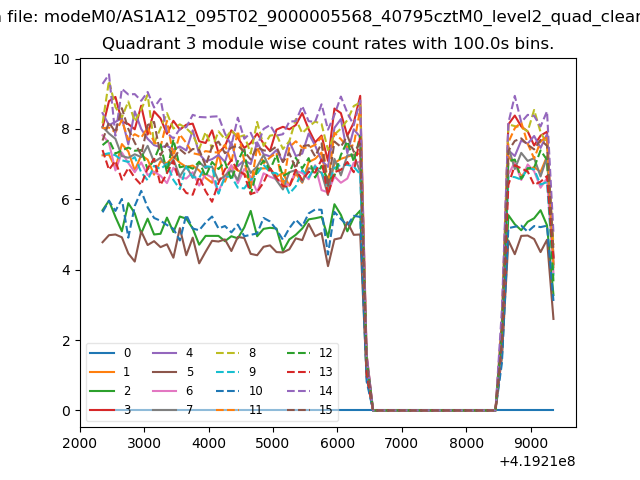
| Module-wise count rates for Quadrant C Data is divided into 100 sec bins |
 |
 |
| Module-wise count rates for Quadrant D Data is divided into 100 sec bins |
 |
 |
| Parameter | Plot |
|---|---|
| CZT HV Monitor | 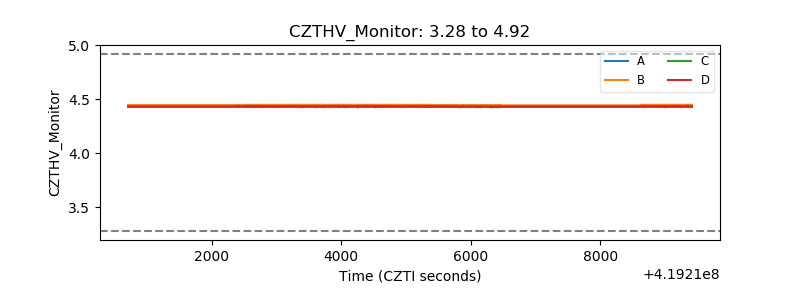 |
| D_VDD | 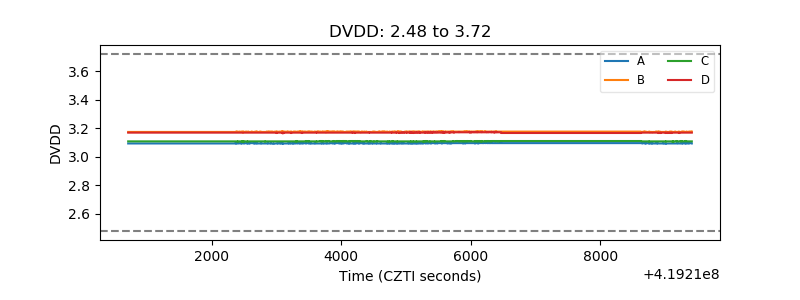 |
| Temperature 1 | 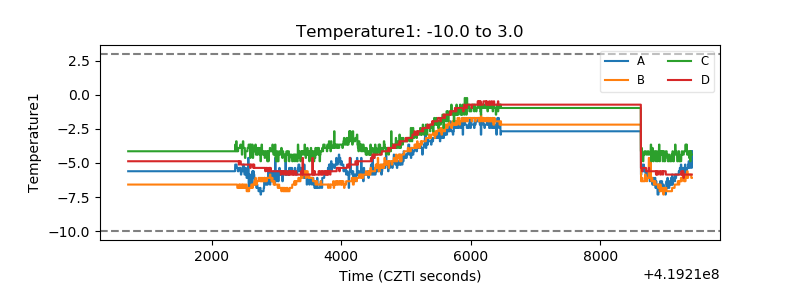 |
| Veto HV Monitor | 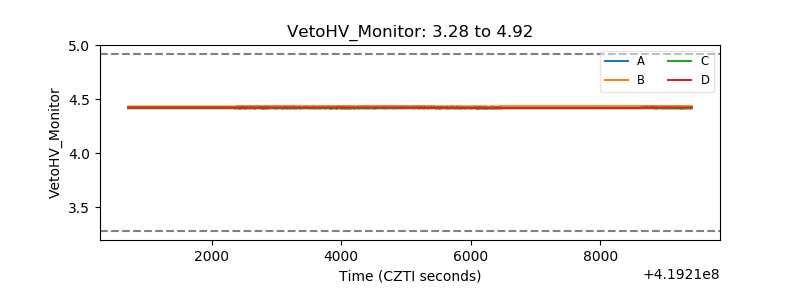 |
| Veto LLD | 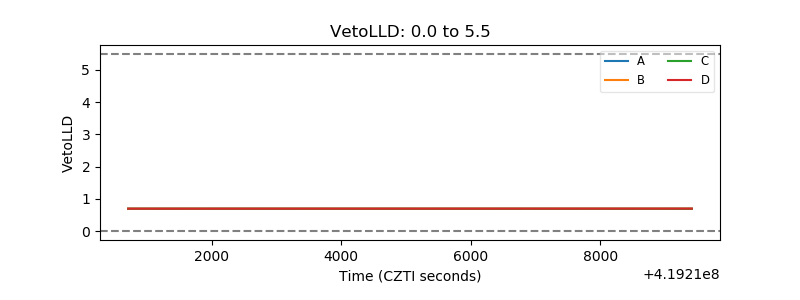 |
| Alpha Counter | 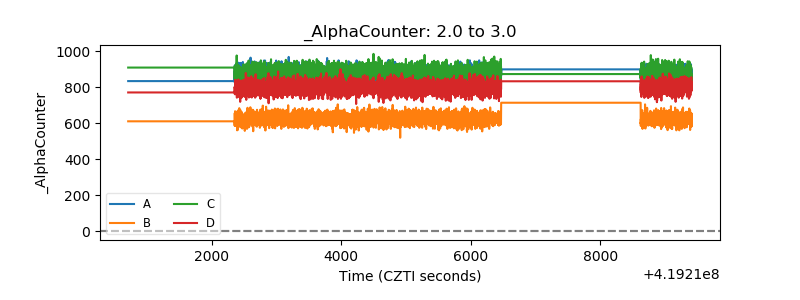 |
| _CPM_Rate | 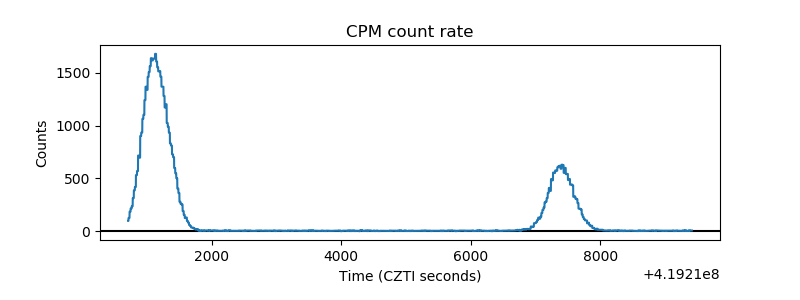 |
| CZT Counter | 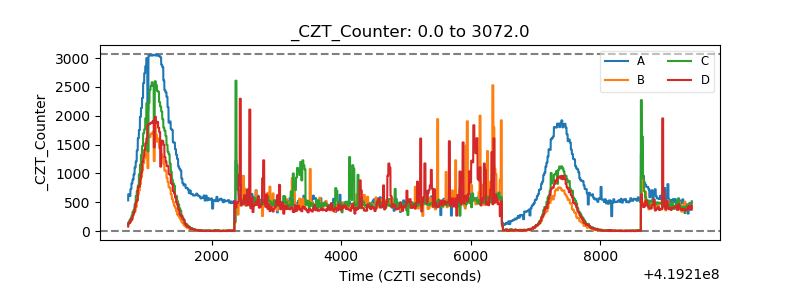 |
| +2.5 Volts monitor | 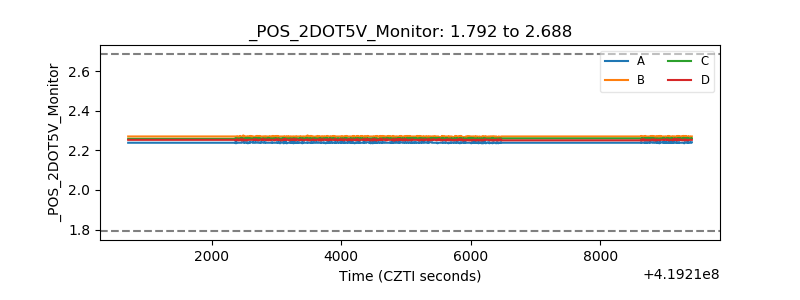 |
| +5 Volts monitor | 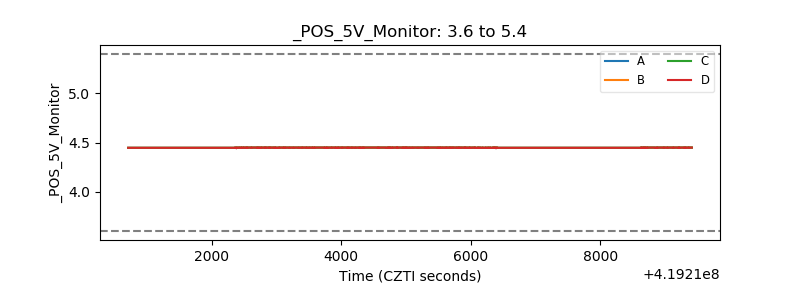 |
| _ROLL_ROT | 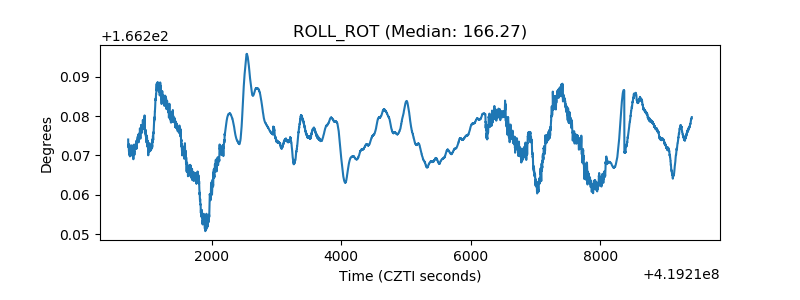 |
| _Roll_DEC | 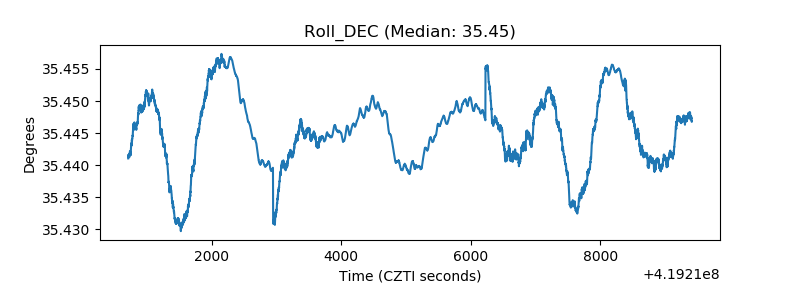 |
| _Roll_RA | 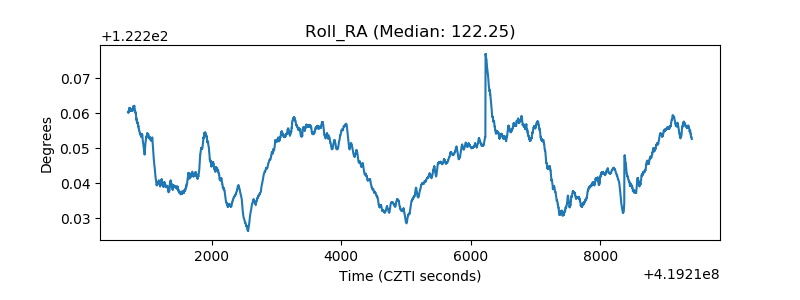 |
| Veto Counter | 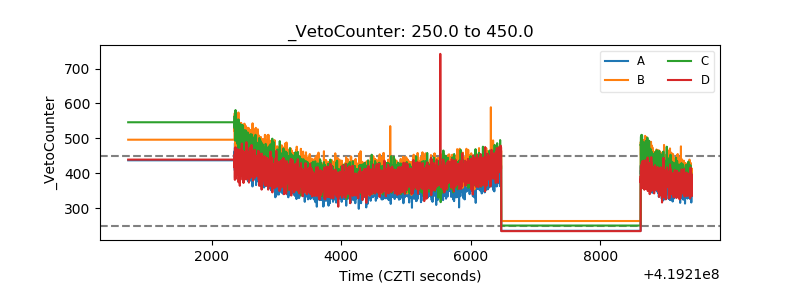 |