| Param | Original file | Final file |
|---|---|---|
| Filename | modeM0/AS1A12_095T02_9000005568_40796cztM0_level2.fits | modeM0/AS1A12_095T02_9000005568_40796cztM0_level2_quad_clean.evt |
| Size (bytes) | 561,985,920 | 160,056,000 |
| Size | 536.0 MB | 152.6 MB |
| Events in quadrant A | 5,358,589 | 1,064,186 |
| Events in quadrant B | 4,869,554 | 1,109,194 |
| Events in quadrant C | 4,758,483 | 1,059,532 |
| Events in quadrant D | 5,081,961 | 958,076 |
| Mode M9 | |||
|---|---|---|---|
| Quadrant | BADHDUFLAG | Total packets | Discarded packets |
| A | 0 | 42 | 0 |
| B | 0 | 42 | 0 |
| C | 0 | 42 | 0 |
| D | 0 | 42 | 0 |
| Mode SS | |||
|---|---|---|---|
| Quadrant | BADHDUFLAG | Total packets | Discarded packets |
| A | 0 | 192 | 0 |
| B | 0 | 192 | 0 |
| C | 0 | 192 | 0 |
| D | 0 | 192 | 0 |
| Mode M0 | |||
|---|---|---|---|
| Quadrant | BADHDUFLAG | Total packets | Discarded packets |
| A | 0 | 21540 | 4 |
| B | 0 | 20884 | 3 |
| C | 0 | 19997 | 3 |
| D | 0 | 22188 | 3 |
| Quadrant | Total seconds | Saturated seconds | Saturation percentage |
|---|---|---|---|
| A | 9458 | 58 | 0.613237% |
| B | 9458 | 85 | 0.898710% |
| C | 9458 | 53 | 0.560372% |
| D | 9459 | 124 | 1.310921% |
Noise dominated data is calculated using 1-second bins in cleaned event files. If a bin has >2000 counts, and if more than 50% of those come from <1% of pixels, then it is considered to be noise-dominated and hence unusable.
| Quadrant | # 1 sec bins | Bins with >0 counts | Bins with >2000 counts | High rate bins dominated by noise | Noise dominated (total time) | Noise dominated (detector-on time) | Marked lightcurve |
|---|---|---|---|---|---|---|---|
| A | 13614 | 9460 | 58 | 58 | 0.43% | 0.61% | 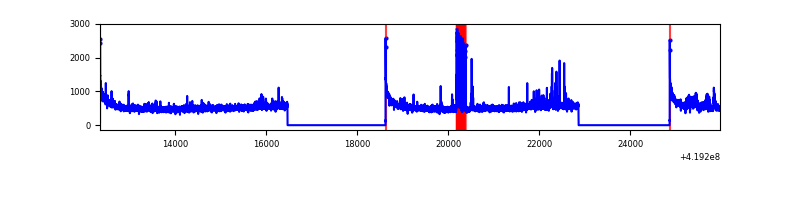 |
| B | 13614 | 9460 | 48 | 48 | 0.35% | 0.51% | 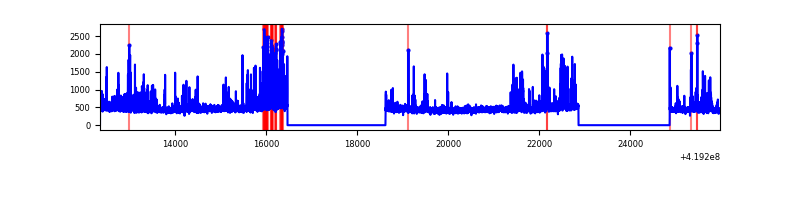 |
| C | 13614 | 9460 | 52 | 52 | 0.38% | 0.55% | 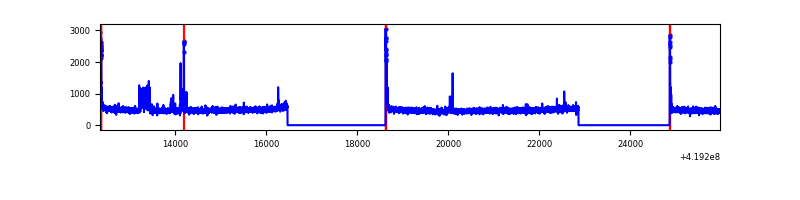 |
| D | 13615 | 9461 | 106 | 106 | 0.78% | 1.12% | 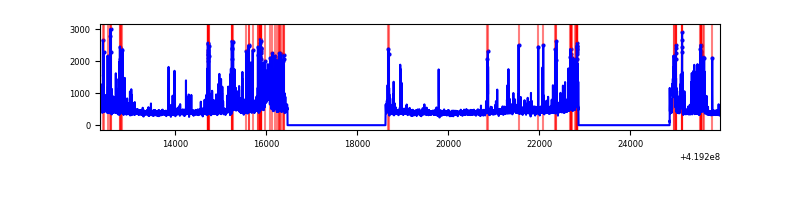 |
Top three noisy pixels from each quadrant. If the there are fewer than three noisy pixels in the level2.evt file, extra rows are filled as -1
| Pixel properties | Quadrant properties | ||||||
|---|---|---|---|---|---|---|---|
| Quadrant | DetID | PixID | Counts | Sigma | Mean | Median | Sigma |
| A | 10 | 83 | 836688 | 3880.73 | 1053 | 1032 | 215.3 |
| A | 6 | 10 | 268693 | 1243.0 | 1053 | 1032 | 215.3 |
| A | 12 | 189 | 104836 | 482.06 | 1053 | 1032 | 215.3 |
| B | 7 | 202 | 358318 | 1761.0 | 1052 | 1023 | 202.9 |
| B | 15 | 85 | 160118 | 784.13 | 1052 | 1023 | 202.9 |
| B | 5 | 255 | 133595 | 653.41 | 1052 | 1023 | 202.9 |
| C | 15 | 214 | 403801 | 1698.49 | 1028 | 1037 | 237.1 |
| C | 0 | 10 | 163367 | 684.56 | 1028 | 1037 | 237.1 |
| C | 3 | 233 | 122692 | 513.03 | 1028 | 1037 | 237.1 |
| D | 13 | 249 | 401080 | 1612.48 | 1015 | 986 | 248.1 |
| D | 2 | 249 | 356087 | 1431.15 | 1015 | 986 | 248.1 |
| D | 13 | 171 | 149637 | 599.1 | 1015 | 986 | 248.1 |
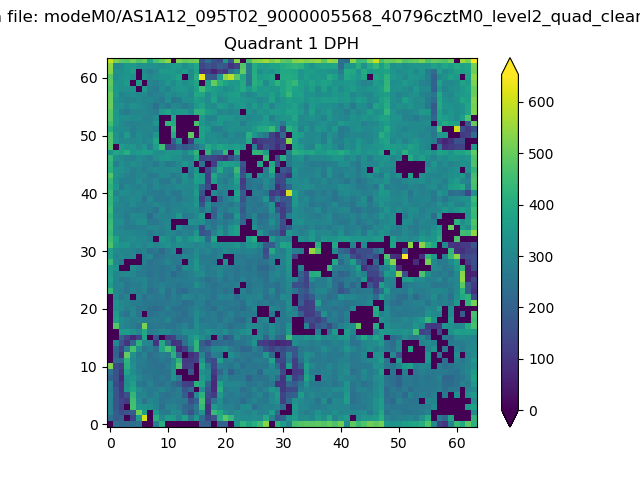
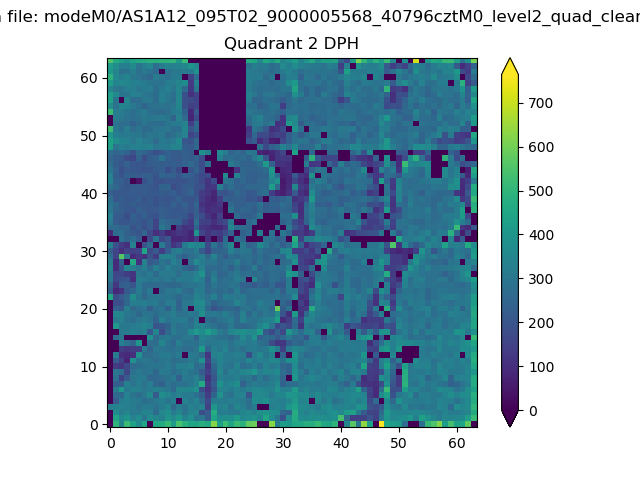
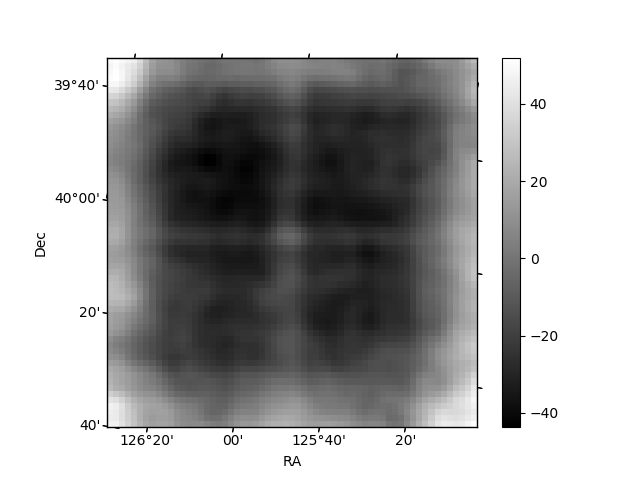
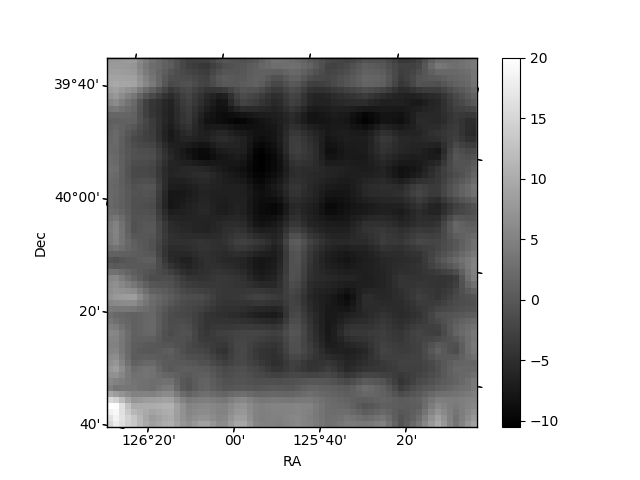
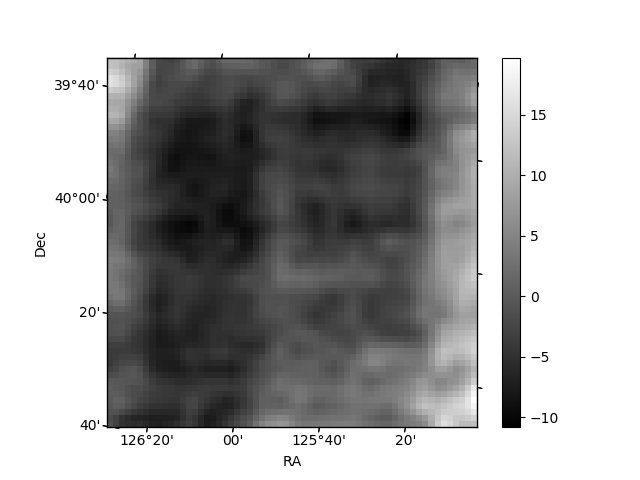
Histogram calculated using DETX and DETY for each event in the final _common_clean file
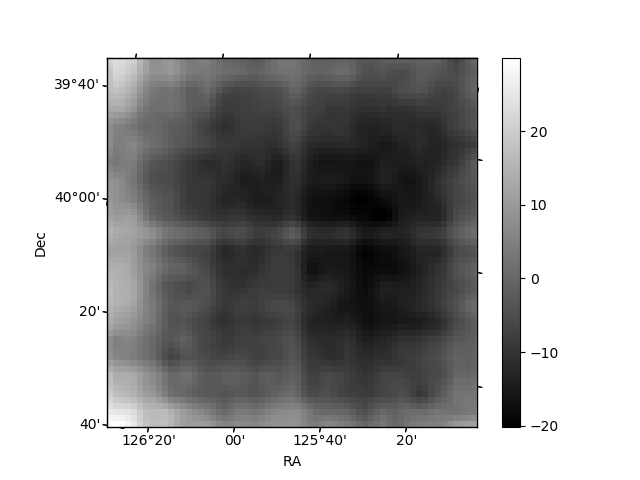
| Quadrant A |  |
 |
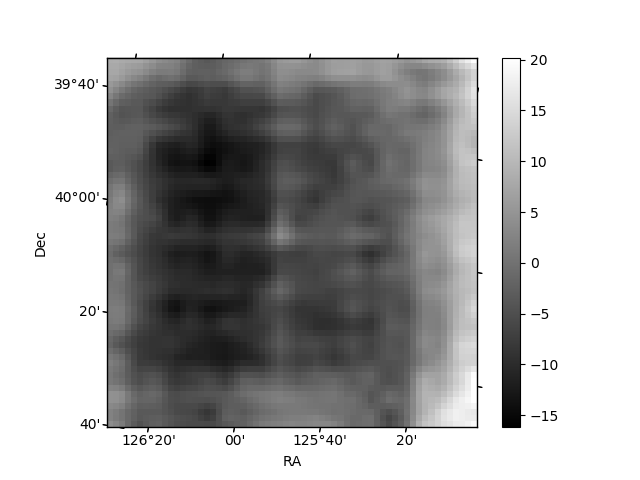
Quadrant B |
|---|---|---|---|
| Quadrant D | 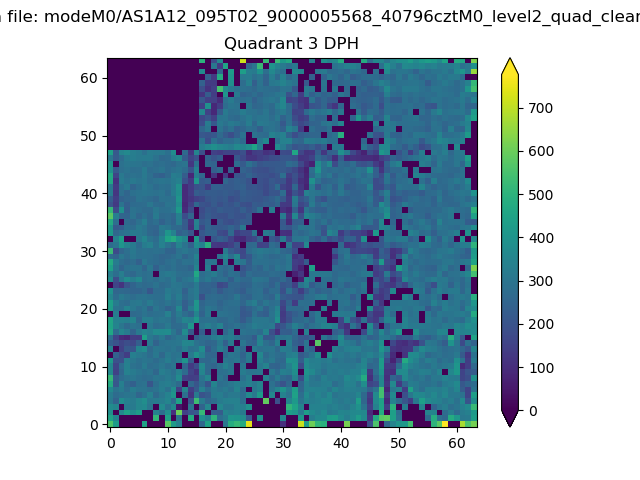 |
 |
Quadrant C |
| Plot type | Count rate plots | Images |
|---|---|---|
| Comparison with Poisson distribution Blue bars denote a histogram of data divided into 1 sec bins. Red curve is a Poisson curve with rate = median count rate of data. |
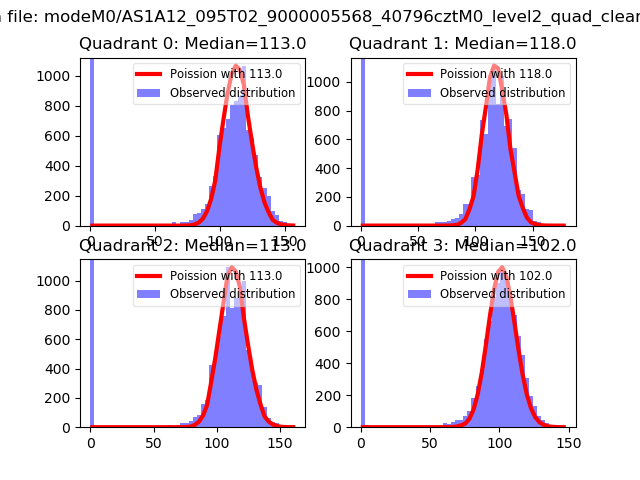 |
 |
| Quadrant-wise count rates Data is divided into 100 sec bins |
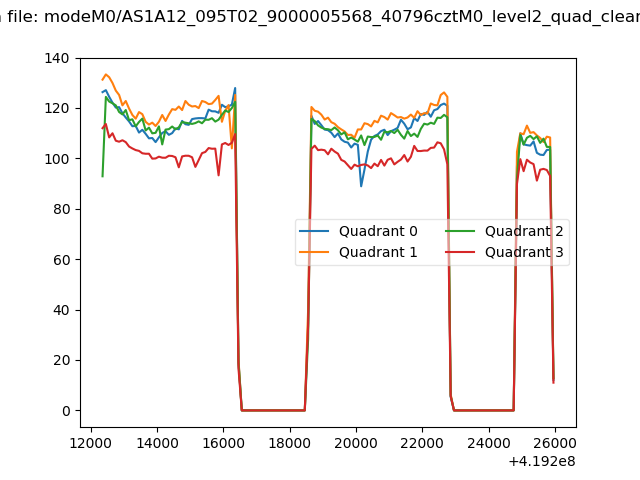 |
|
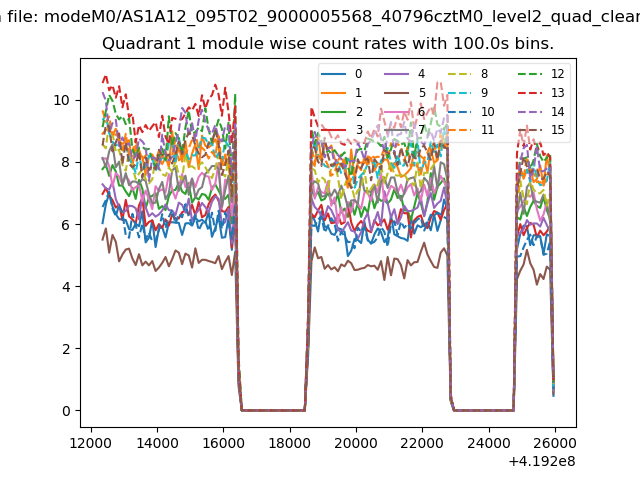
| Module-wise count rates for Quadrant A Data is divided into 100 sec bins |
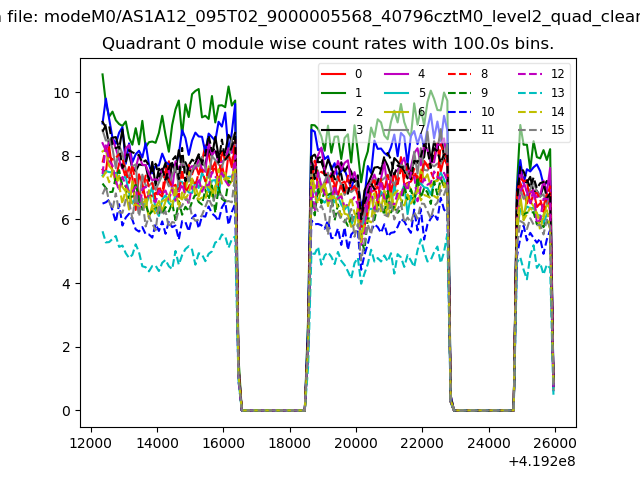 |
 |
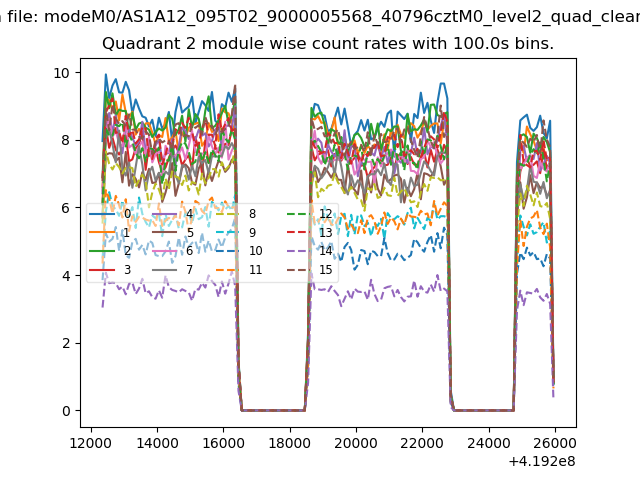
| Module-wise count rates for Quadrant B Data is divided into 100 sec bins |
 |
 |
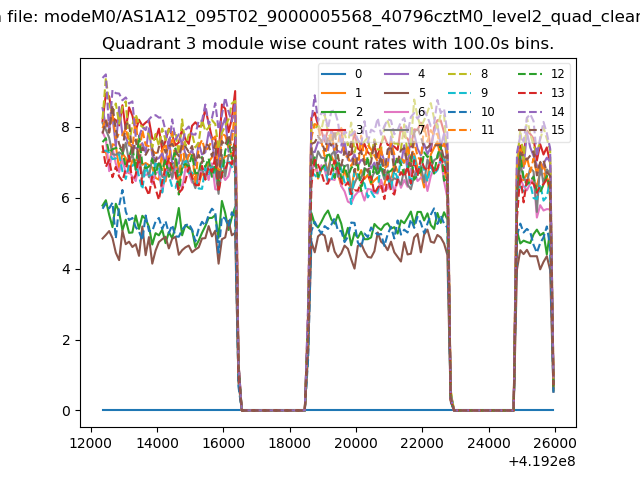
| Module-wise count rates for Quadrant C Data is divided into 100 sec bins |
 |
 |
| Module-wise count rates for Quadrant D Data is divided into 100 sec bins |
 |
 |
| Parameter | Plot |
|---|---|
| CZT HV Monitor | 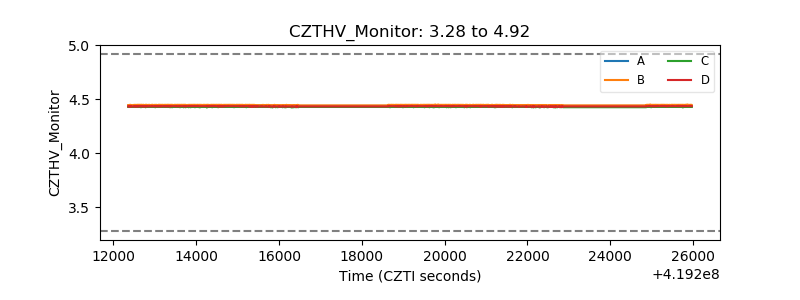 |
| D_VDD | 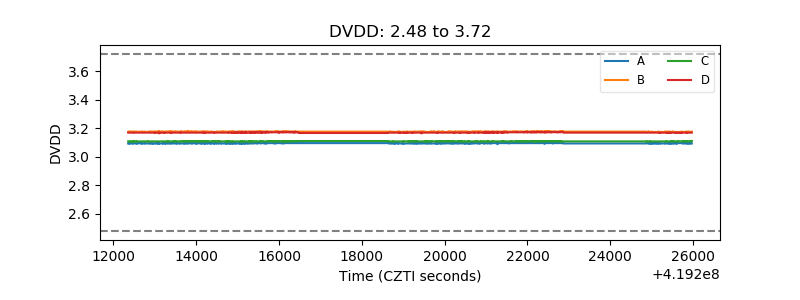 |
| Temperature 1 | 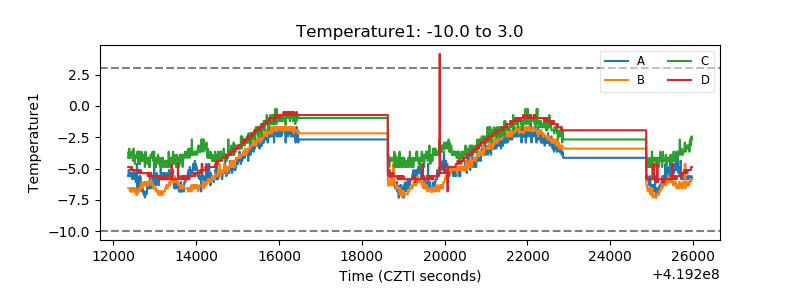 |
| Veto HV Monitor | 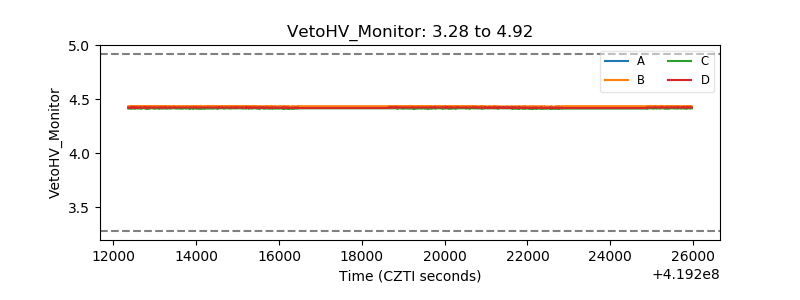 |
| Veto LLD | 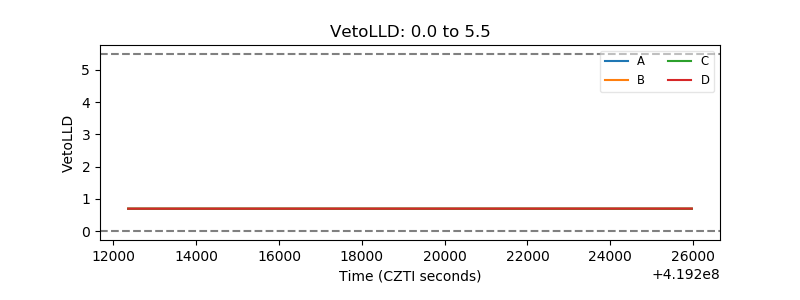 |
| Alpha Counter | 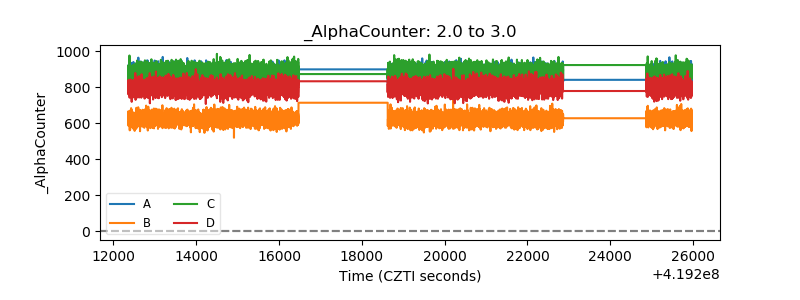 |
| _CPM_Rate | 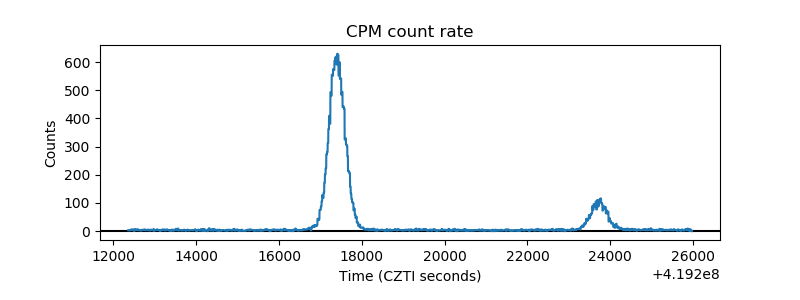 |
| CZT Counter | 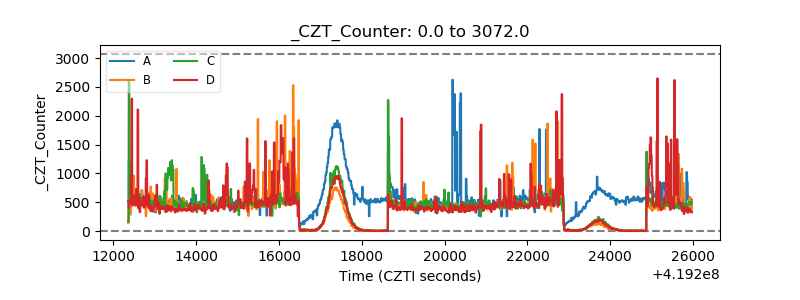 |
| +2.5 Volts monitor |  |
| +5 Volts monitor | 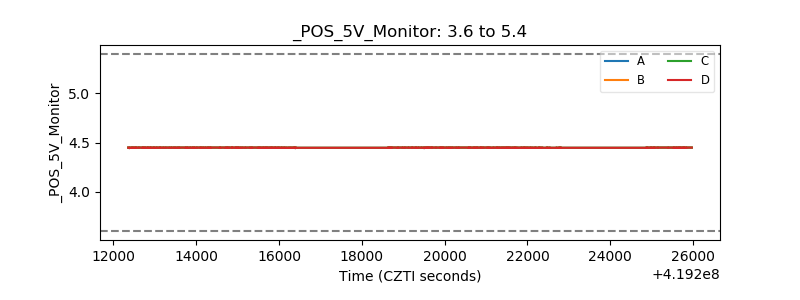 |
| _ROLL_ROT | 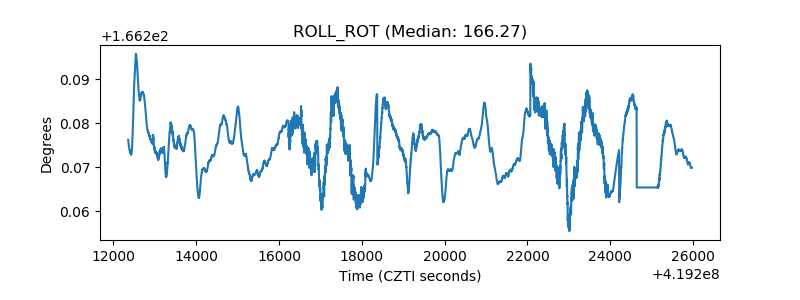 |
| _Roll_DEC | 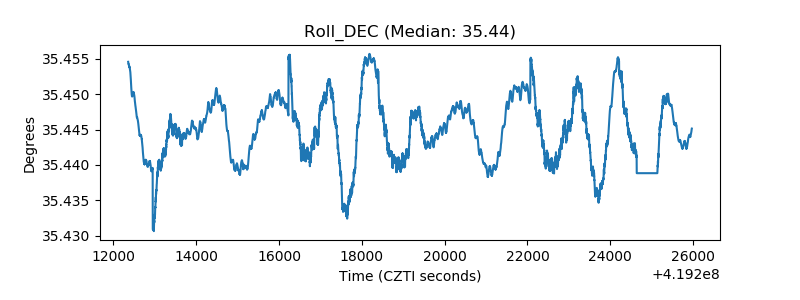 |
| _Roll_RA | 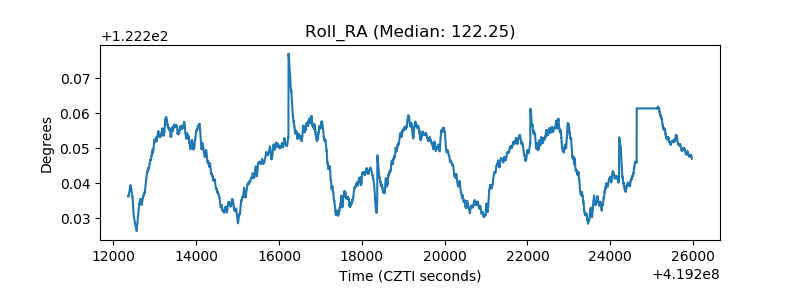 |
| Veto Counter | 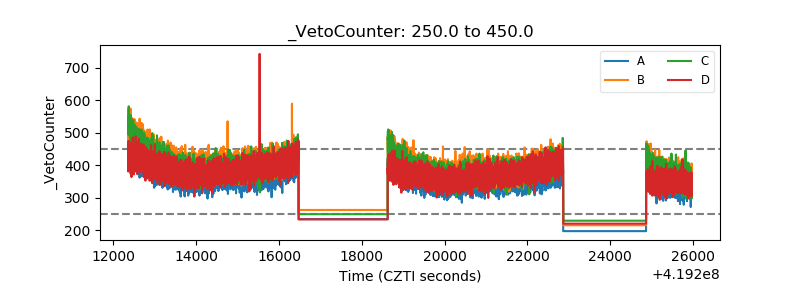 |