| Param | Original file | Final file |
|---|---|---|
| Filename | modeM0/AS1A12_095T02_9000005568_40797cztM0_level2.fits | modeM0/AS1A12_095T02_9000005568_40797cztM0_level2_quad_clean.evt |
| Size (bytes) | 269,112,960 | 73,673,280 |
| Size | 256.6 MB | 70.3 MB |
| Events in quadrant A | 2,554,568 | 490,703 |
| Events in quadrant B | 2,117,554 | 507,342 |
| Events in quadrant C | 2,103,156 | 482,141 |
| Events in quadrant D | 2,837,056 | 435,865 |
| Mode M9 | |||
|---|---|---|---|
| Quadrant | BADHDUFLAG | Total packets | Discarded packets |
| A | 0 | 20 | 0 |
| B | 0 | 20 | 0 |
| C | 0 | 20 | 0 |
| D | 0 | 20 | 0 |
| Mode SS | |||
|---|---|---|---|
| Quadrant | BADHDUFLAG | Total packets | Discarded packets |
| A | 0 | 92 | 0 |
| B | 0 | 92 | 0 |
| C | 0 | 92 | 0 |
| D | 0 | 92 | 0 |
| Mode M0 | |||
|---|---|---|---|
| Quadrant | BADHDUFLAG | Total packets | Discarded packets |
| A | 0 | 10280 | 1 |
| B | 0 | 9491 | 1 |
| C | 0 | 9084 | 1 |
| D | 0 | 11563 | 1 |
| Quadrant | Total seconds | Saturated seconds | Saturation percentage |
|---|---|---|---|
| A | 4474 | 9 | 0.201162% |
| B | 4474 | 11 | 0.245865% |
| C | 4474 | 9 | 0.201162% |
| D | 4474 | 87 | 1.944569% |
Noise dominated data is calculated using 1-second bins in cleaned event files. If a bin has >2000 counts, and if more than 50% of those come from <1% of pixels, then it is considered to be noise-dominated and hence unusable.
| Quadrant | # 1 sec bins | Bins with >0 counts | Bins with >2000 counts | High rate bins dominated by noise | Noise dominated (total time) | Noise dominated (detector-on time) | Marked lightcurve |
|---|---|---|---|---|---|---|---|
| A | 6477 | 4475 | 4 | 4 | 0.06% | 0.09% | 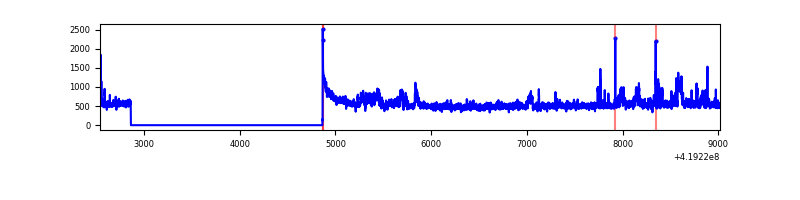 |
| B | 6477 | 4475 | 7 | 7 | 0.11% | 0.16% |  |
| C | 6477 | 4475 | 8 | 8 | 0.12% | 0.18% | 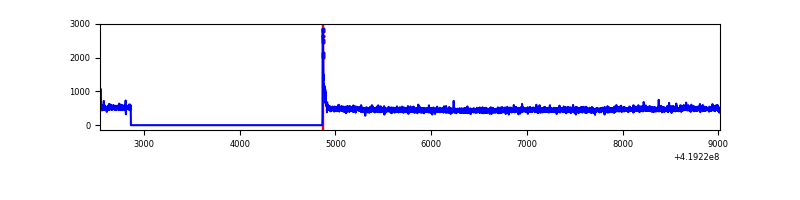 |
| D | 6477 | 4475 | 85 | 85 | 1.31% | 1.90% |  |
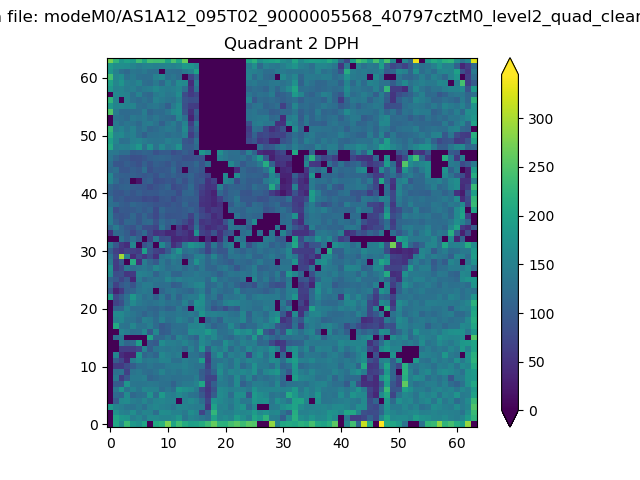
Top three noisy pixels from each quadrant. If the there are fewer than three noisy pixels in the level2.evt file, extra rows are filled as -1
| Pixel properties | Quadrant properties | ||||||
|---|---|---|---|---|---|---|---|
| Quadrant | DetID | PixID | Counts | Sigma | Mean | Median | Sigma |
| A | 10 | 83 | 370101 | 3646.29 | 490 | 481 | 101.4 |
| A | 6 | 10 | 149311 | 1468.2 | 490 | 481 | 101.4 |
| A | 12 | 189 | 75698 | 742.01 | 490 | 481 | 101.4 |
| B | 15 | 54 | 65686 | 677.79 | 487 | 473 | 96.2 |
| B | 7 | 202 | 47507 | 488.84 | 487 | 473 | 96.2 |
| B | 15 | 85 | 36425 | 373.66 | 487 | 473 | 96.2 |
| C | 15 | 214 | 188860 | 1679.28 | 479 | 482 | 112.2 |
| C | 0 | 10 | 36282 | 319.14 | 479 | 482 | 112.2 |
| C | 3 | 233 | 8051 | 67.47 | 479 | 482 | 112.2 |
| D | 13 | 249 | 677107 | 5853.28 | 474 | 461 | 115.6 |
| D | 2 | 153 | 147785 | 1274.42 | 474 | 461 | 115.6 |
| D | 2 | 249 | 81188 | 698.32 | 474 | 461 | 115.6 |
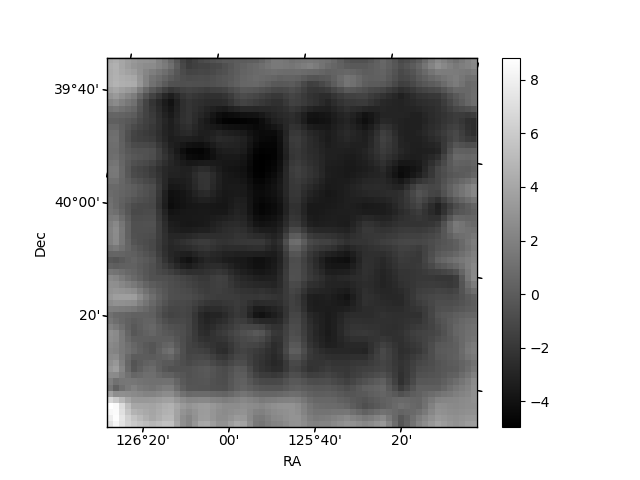
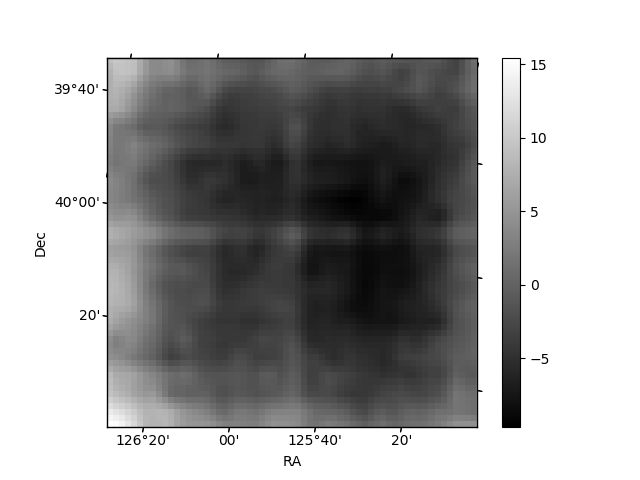
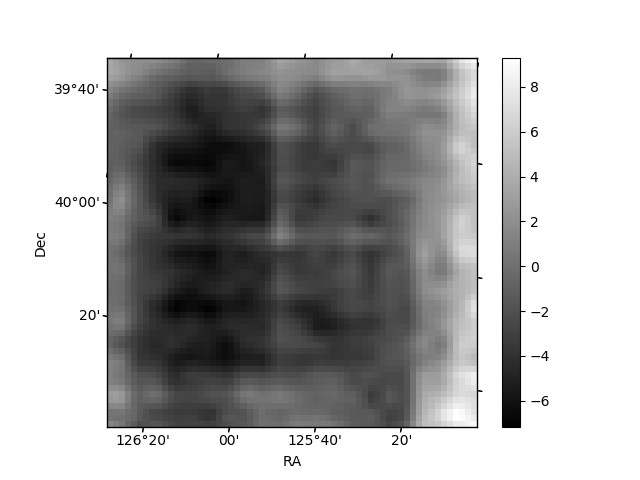
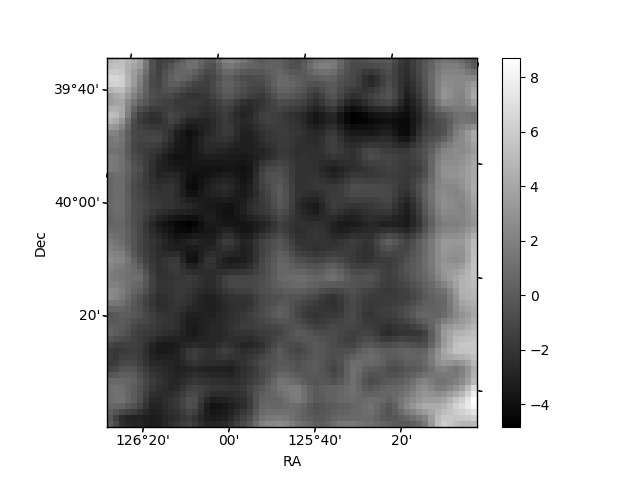
Histogram calculated using DETX and DETY for each event in the final _common_clean file
| Quadrant A |  |
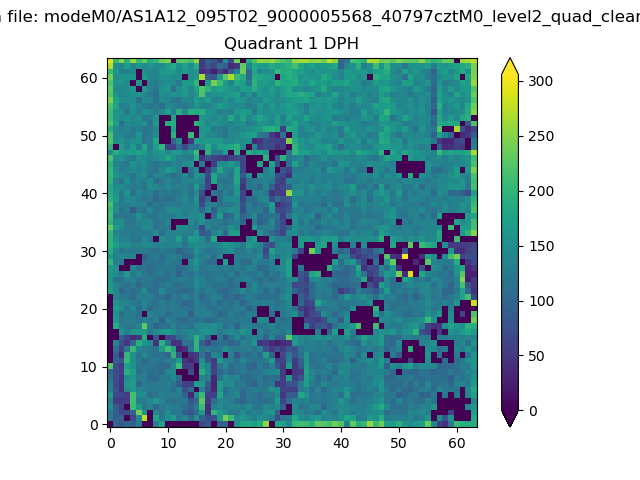 |
Quadrant B |
|---|---|---|---|
| Quadrant D | 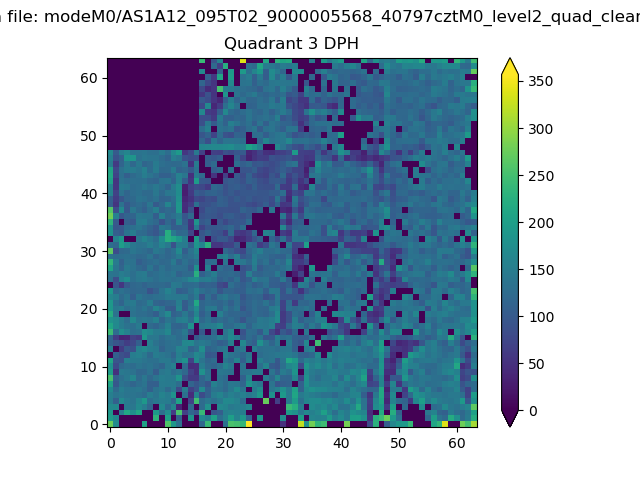 |
 |
Quadrant C |
| Plot type | Count rate plots | Images |
|---|---|---|
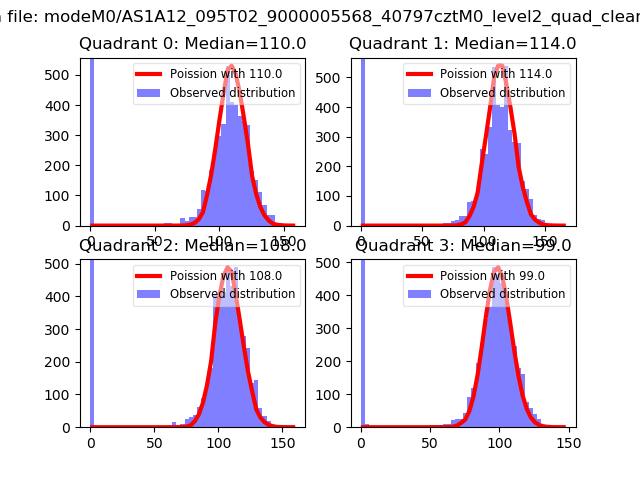
| Comparison with Poisson distribution Blue bars denote a histogram of data divided into 1 sec bins. Red curve is a Poisson curve with rate = median count rate of data. |
 |
 |
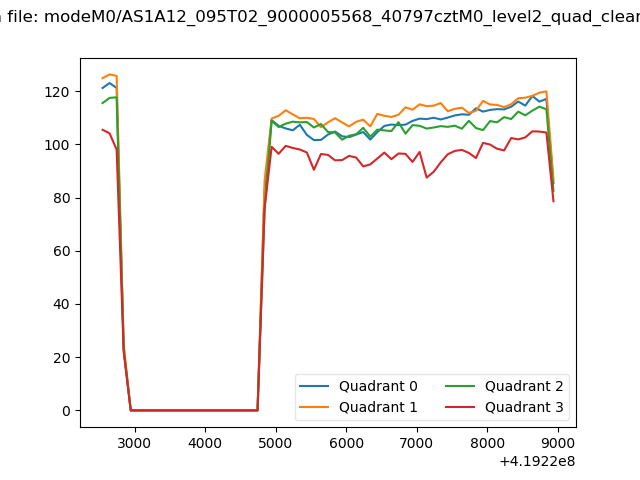
| Quadrant-wise count rates Data is divided into 100 sec bins |
 |
|
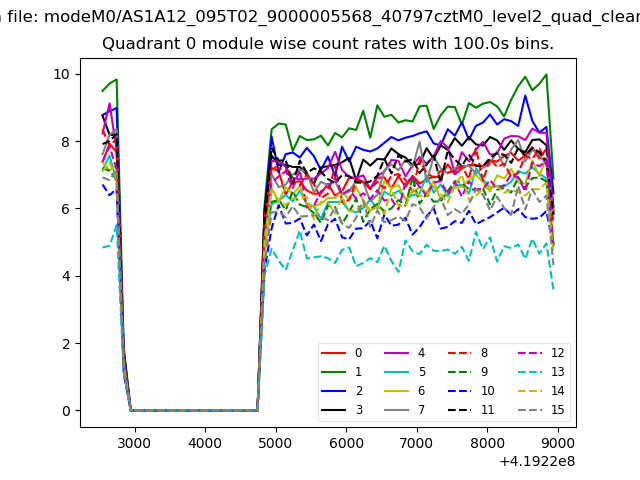
| Module-wise count rates for Quadrant A Data is divided into 100 sec bins |
 |
 |
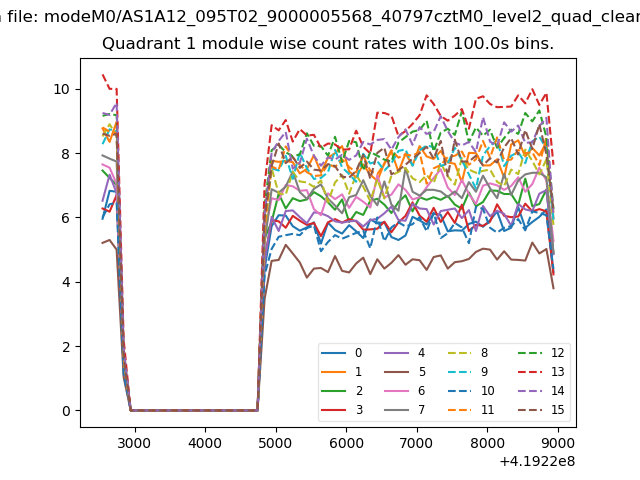
| Module-wise count rates for Quadrant B Data is divided into 100 sec bins |
 |
 |
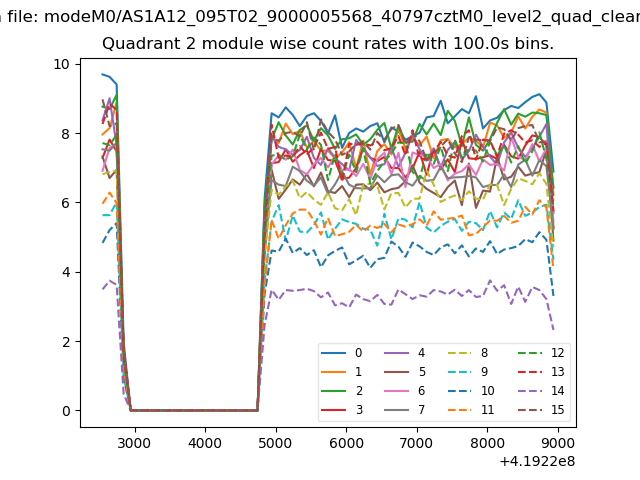
| Module-wise count rates for Quadrant C Data is divided into 100 sec bins |
 |
 |
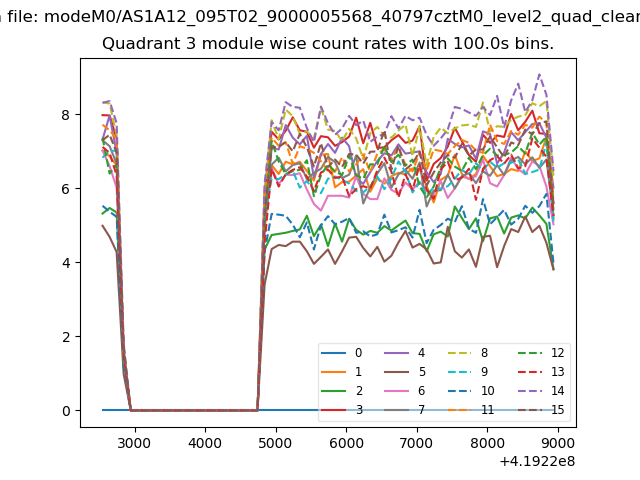
| Module-wise count rates for Quadrant D Data is divided into 100 sec bins |
 |
 |
| Parameter | Plot |
|---|---|
| CZT HV Monitor | 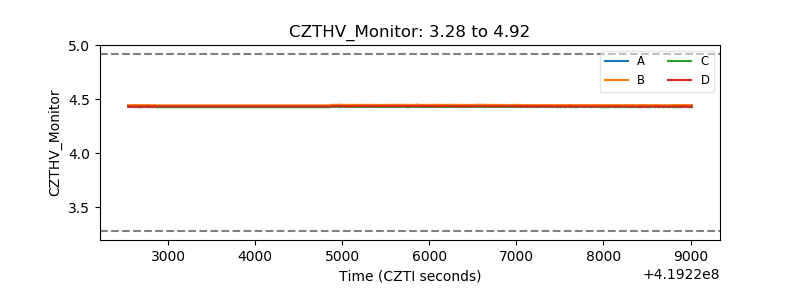 |
| D_VDD | 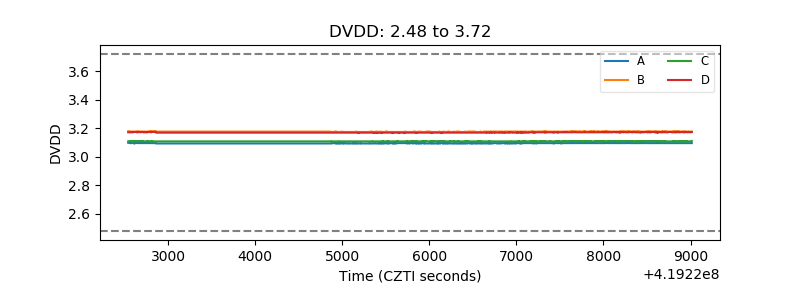 |
| Temperature 1 | 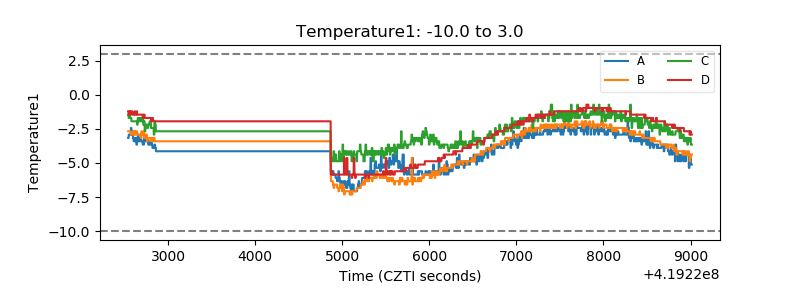 |
| Veto HV Monitor | 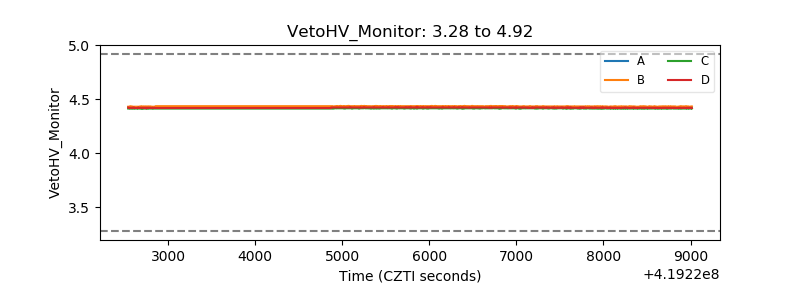 |
| Veto LLD | 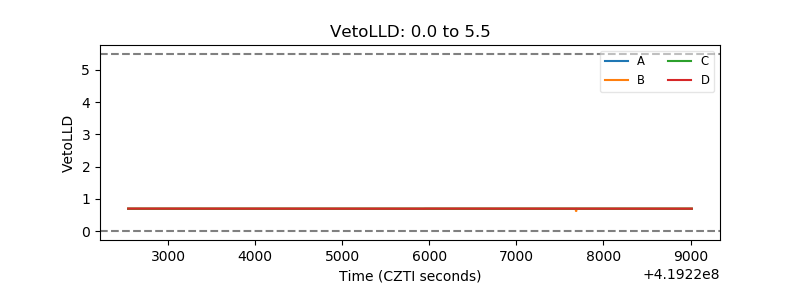 |
| Alpha Counter | 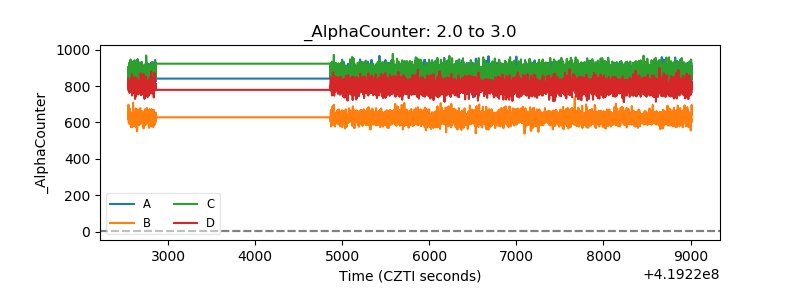 |
| _CPM_Rate | 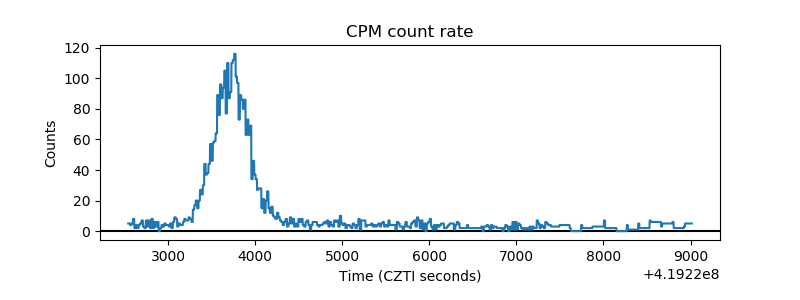 |
| CZT Counter | 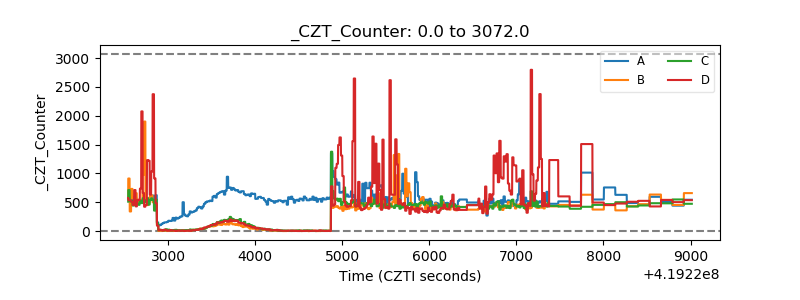 |
| +2.5 Volts monitor | 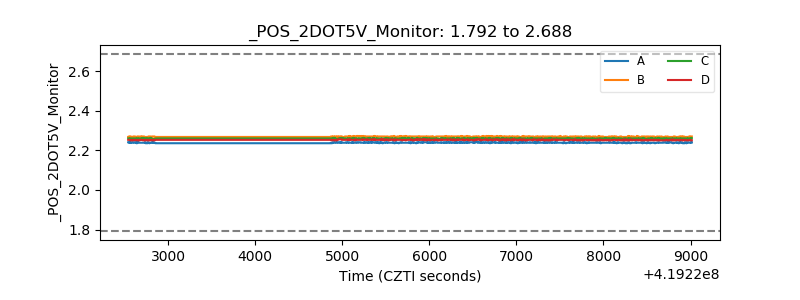 |
| +5 Volts monitor | 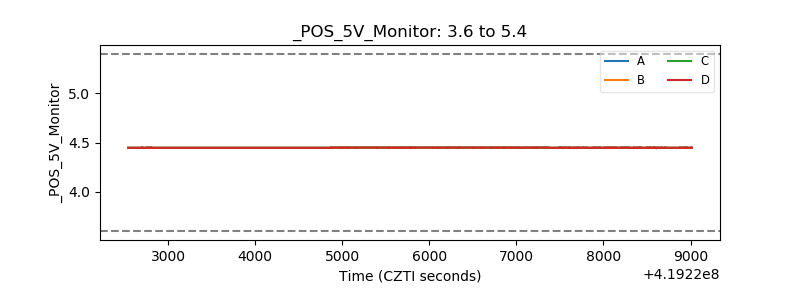 |
| _ROLL_ROT | 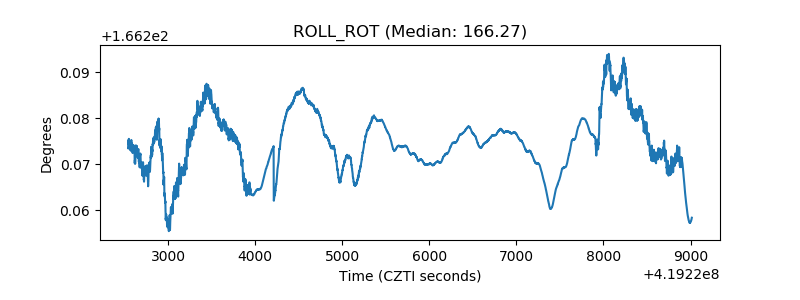 |
| _Roll_DEC | 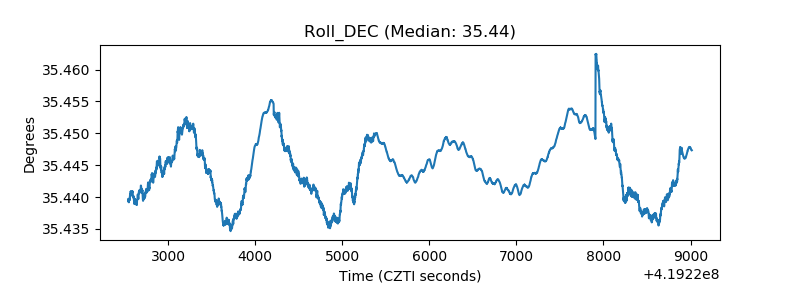 |
| _Roll_RA | 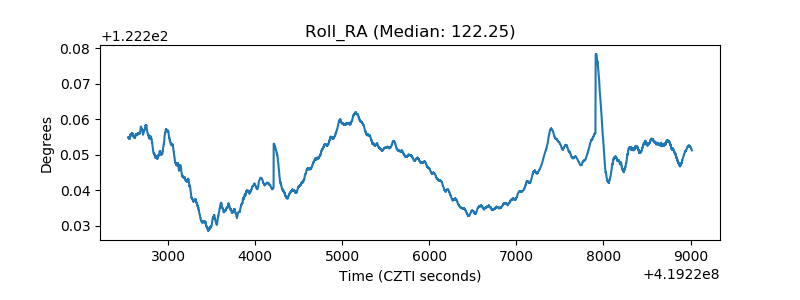 |
| Veto Counter | 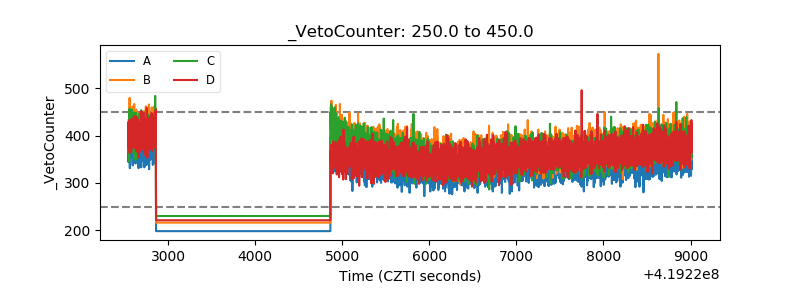 |