| Param | Original file | Final file |
|---|---|---|
| Filename | modeM0/AS1A12_095T02_9000005568_40798cztM0_level2.fits | modeM0/AS1A12_095T02_9000005568_40798cztM0_level2_quad_clean.evt |
| Size (bytes) | 4,726,080 | 538,560 |
| Size | 4.5 MB | 525.9 KB |
| Events in quadrant A | 42,598 | 665 |
| Events in quadrant B | 36,558 | 612 |
| Events in quadrant C | 38,992 | 591 |
| Events in quadrant D | 46,700 | 508 |
| Mode SS | |||
|---|---|---|---|
| Quadrant | BADHDUFLAG | Total packets | Discarded packets |
| A | 0 | 2 | 0 |
| B | 0 | 2 | 0 |
| C | 0 | 2 | 0 |
| D | 0 | 2 | 0 |
| Mode M0 | |||
|---|---|---|---|
| Quadrant | BADHDUFLAG | Total packets | Discarded packets |
| A | 0 | 169 | 0 |
| B | 0 | 159 | 0 |
| C | 0 | 159 | 0 |
| D | 0 | 186 | 0 |
| Quadrant | Total seconds | Saturated seconds | Saturation percentage |
|---|---|---|---|
| A | 79 | 0 | 0.000000% |
| B | 79 | 0 | 0.000000% |
| C | 79 | 0 | 0.000000% |
| D | 79 | 0 | 0.000000% |
Noise dominated data is calculated using 1-second bins in cleaned event files. If a bin has >2000 counts, and if more than 50% of those come from <1% of pixels, then it is considered to be noise-dominated and hence unusable.
| Quadrant | # 1 sec bins | Bins with >0 counts | Bins with >2000 counts | High rate bins dominated by noise | Noise dominated (total time) | Noise dominated (detector-on time) | Marked lightcurve |
|---|---|---|---|---|---|---|---|
| A | 79 | 79 | 0 | 0 | 0.00% | 0.00% | 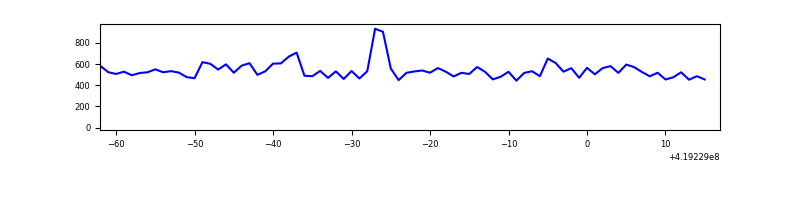 |
| B | 79 | 79 | 0 | 0 | 0.00% | 0.00% | 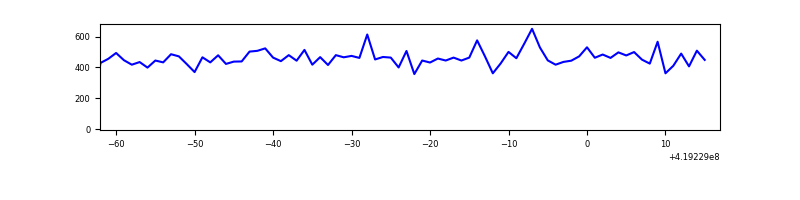 |
| C | 79 | 79 | 0 | 0 | 0.00% | 0.00% | 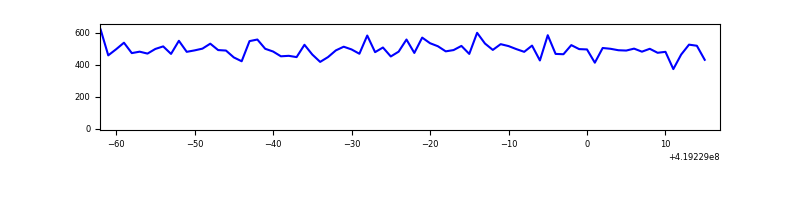 |
| D | 79 | 79 | 0 | 0 | 0.00% | 0.00% | 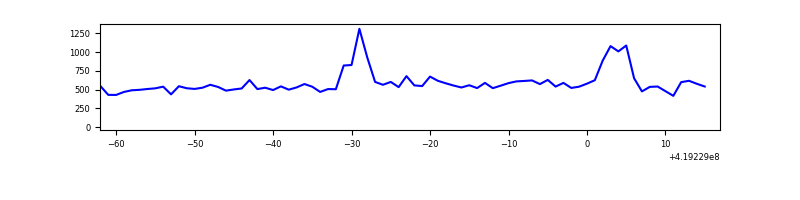 |
Top three noisy pixels from each quadrant. If the there are fewer than three noisy pixels in the level2.evt file, extra rows are filled as -1
| Pixel properties | Quadrant properties | ||||||
|---|---|---|---|---|---|---|---|
| Quadrant | DetID | PixID | Counts | Sigma | Mean | Median | Sigma |
| A | 10 | 83 | 5440 | 1547.34 | 8 | 8 | 3.5 |
| A | 6 | 10 | 1203 | 340.4 | 8 | 8 | 3.5 |
| A | 13 | 248 | 1090 | 308.21 | 8 | 8 | 3.5 |
| B | 0 | 230 | 348 | 96.4 | 8 | 8 | 3.5 |
| B | 15 | 54 | 320 | 88.46 | 8 | 8 | 3.5 |
| B | 0 | 190 | 248 | 68.05 | 8 | 8 | 3.5 |
| C | 15 | 214 | 3228 | 858.48 | 9 | 9 | 3.7 |
| C | 13 | 61 | 74 | 17.33 | 9 | 9 | 3.7 |
| C | 3 | 233 | 42 | 8.8 | 9 | 9 | 3.7 |
| D | 9 | 64 | 6010 | 1623.39 | 8 | 8 | 3.7 |
| D | 2 | 153 | 5913 | 1597.16 | 8 | 8 | 3.7 |
| D | 2 | 234 | 388 | 102.78 | 8 | 8 | 3.7 |
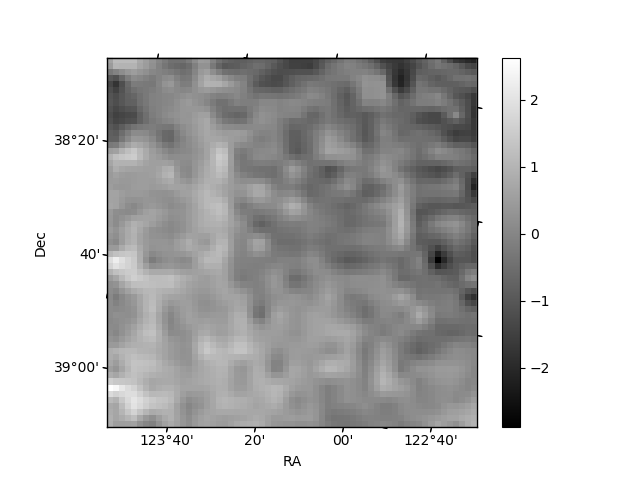
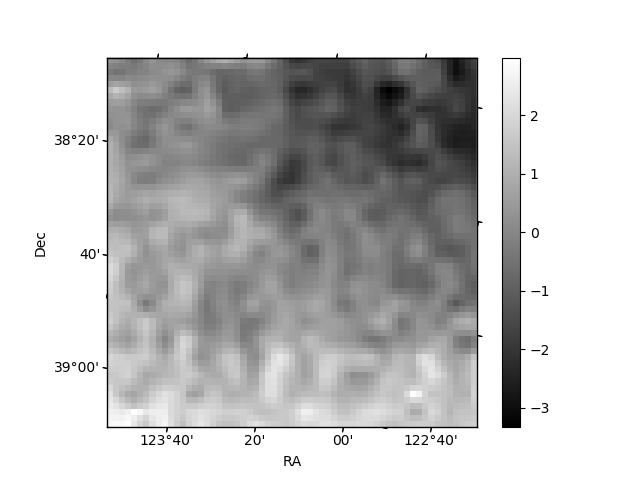
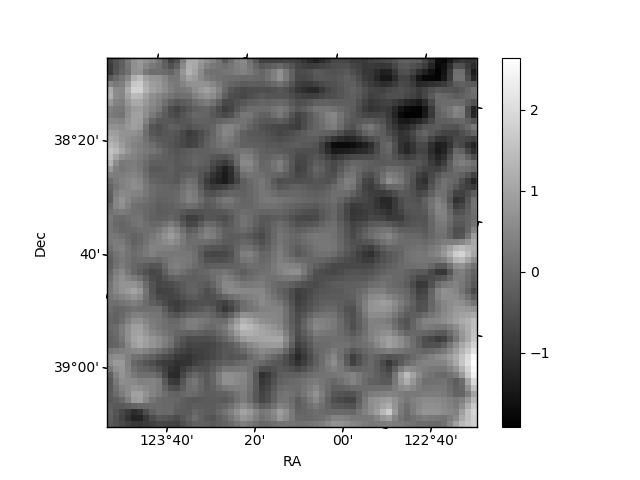
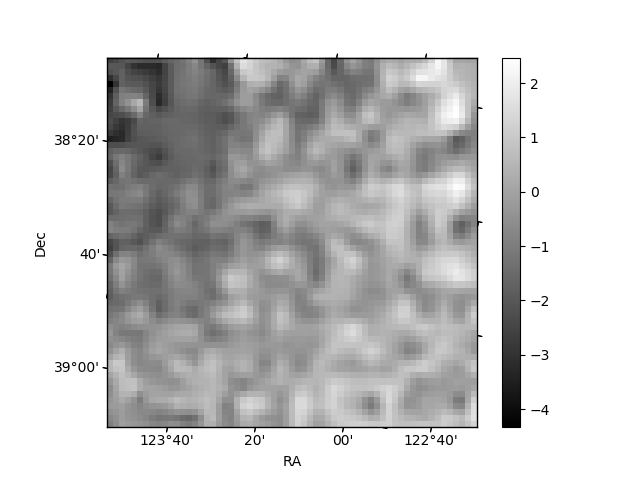
Histogram calculated using DETX and DETY for each event in the final _common_clean file
| Quadrant A | 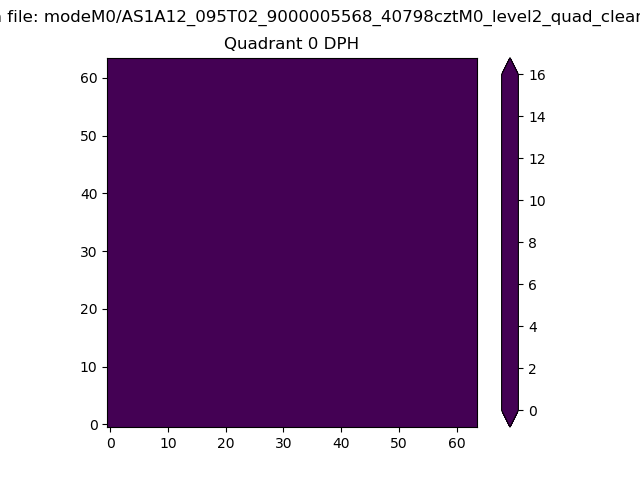 |
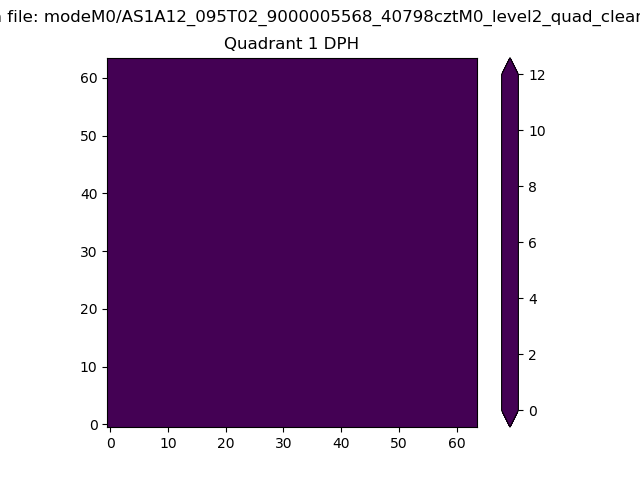 |
Quadrant B |
|---|---|---|---|
| Quadrant D |  |
 |
Quadrant C |
| Plot type | Count rate plots | Images |
|---|---|---|
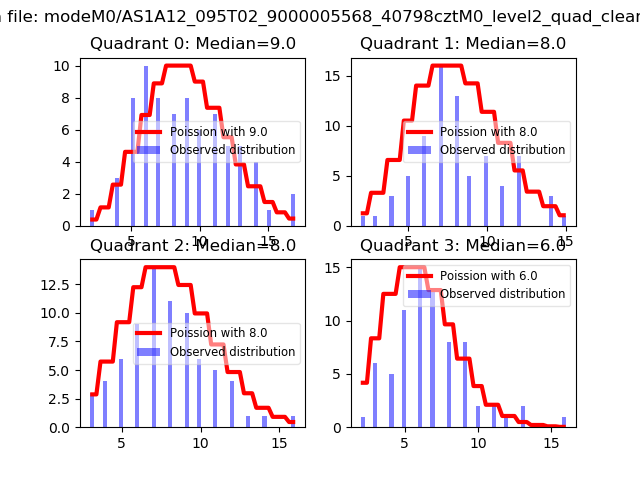
| Comparison with Poisson distribution Blue bars denote a histogram of data divided into 1 sec bins. Red curve is a Poisson curve with rate = median count rate of data. |
 |
 |
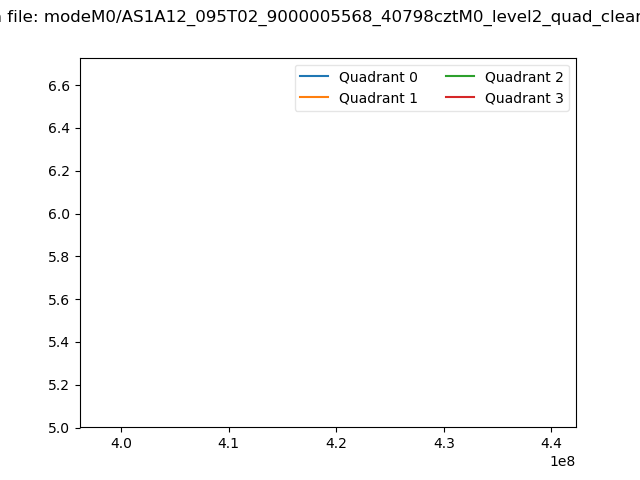
| Quadrant-wise count rates Data is divided into 100 sec bins |
 |
|
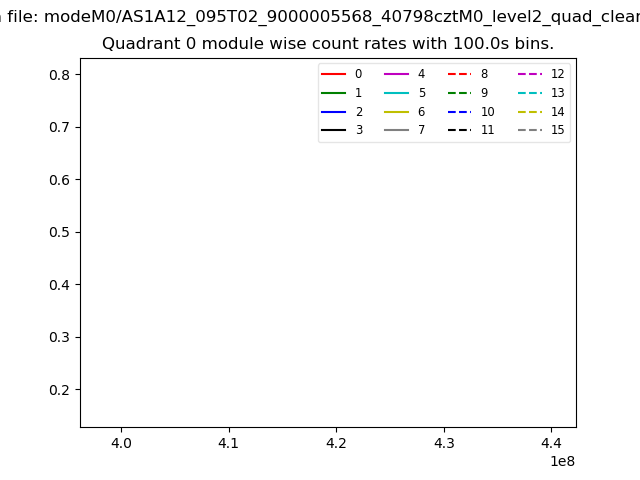
| Module-wise count rates for Quadrant A Data is divided into 100 sec bins |
 |
 |
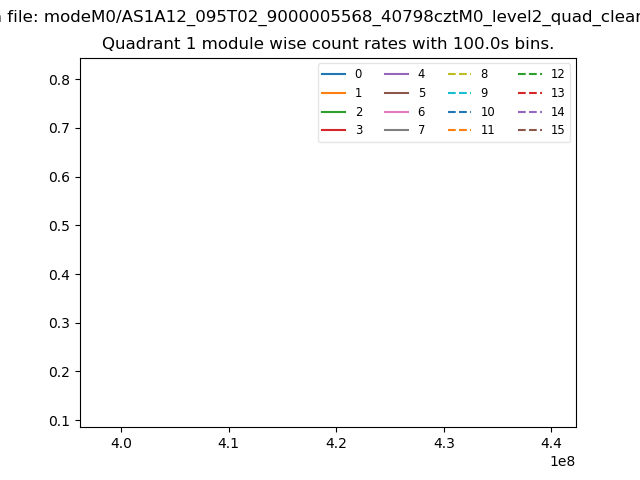
| Module-wise count rates for Quadrant B Data is divided into 100 sec bins |
 |
 |
| Module-wise count rates for Quadrant C Data is divided into 100 sec bins |
 |
 |
| Module-wise count rates for Quadrant D Data is divided into 100 sec bins |
 |
 |
| Parameter | Plot |
|---|---|
| CZT HV Monitor | 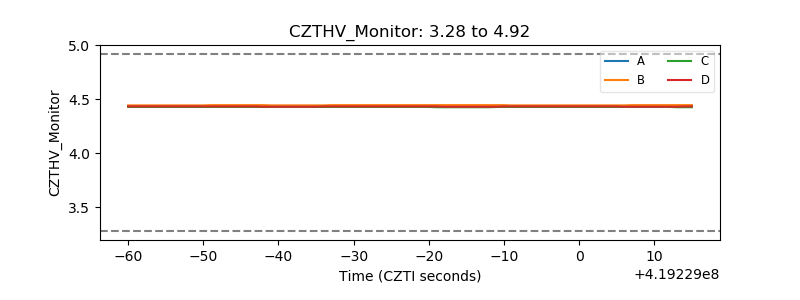 |
| D_VDD | 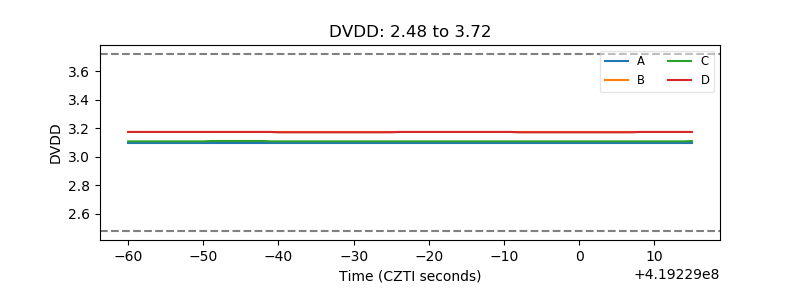 |
| Temperature 1 | 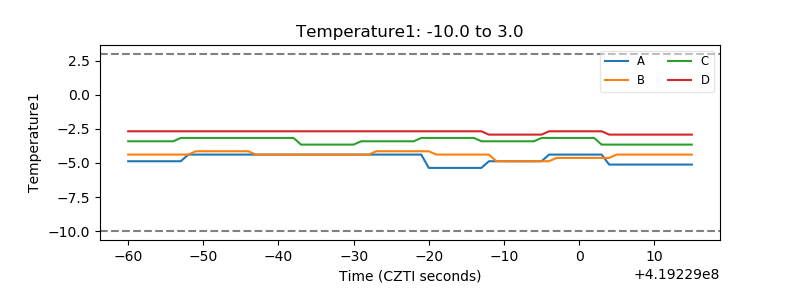 |
| Veto HV Monitor | 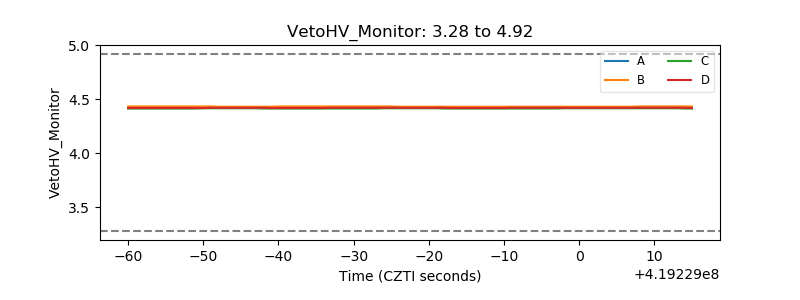 |
| Veto LLD | 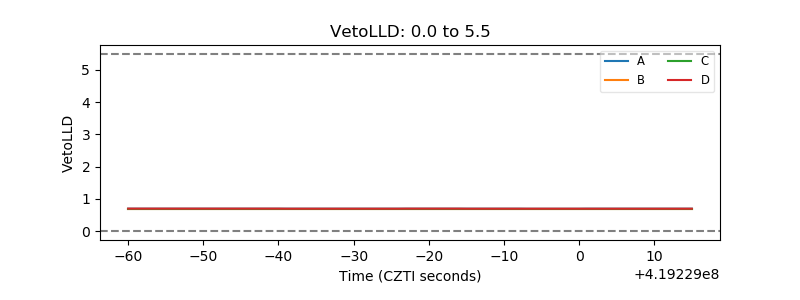 |
| Alpha Counter | 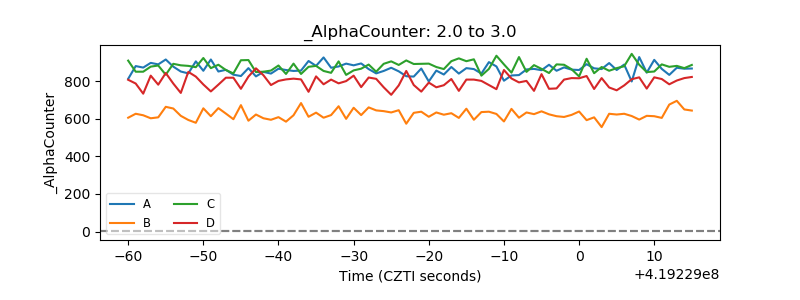 |
| _CPM_Rate | 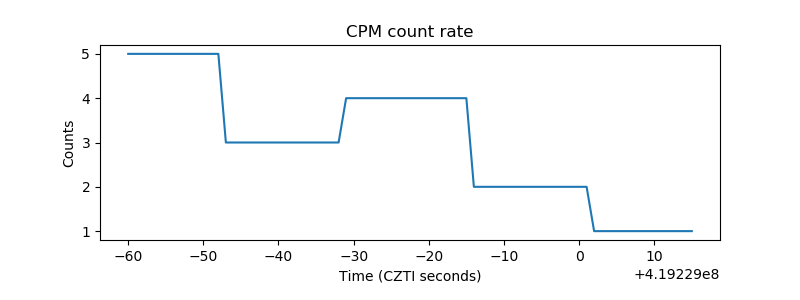 |
| CZT Counter | 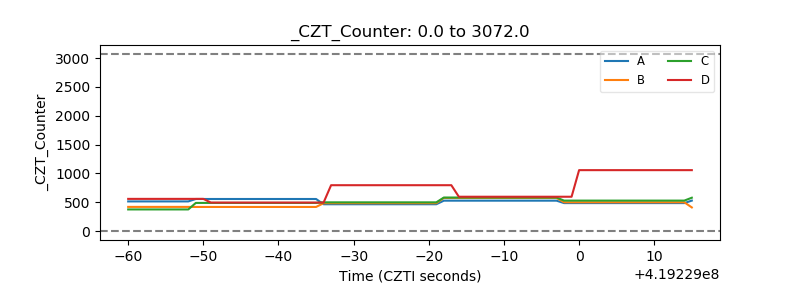 |
| +2.5 Volts monitor | 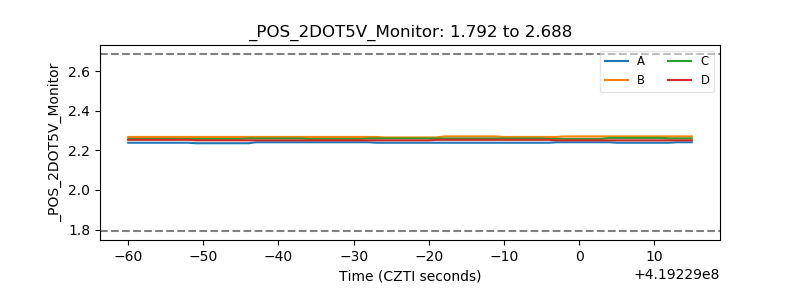 |
| +5 Volts monitor | 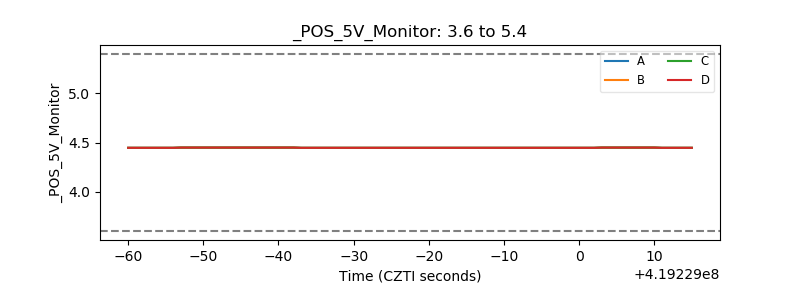 |
| _ROLL_ROT | 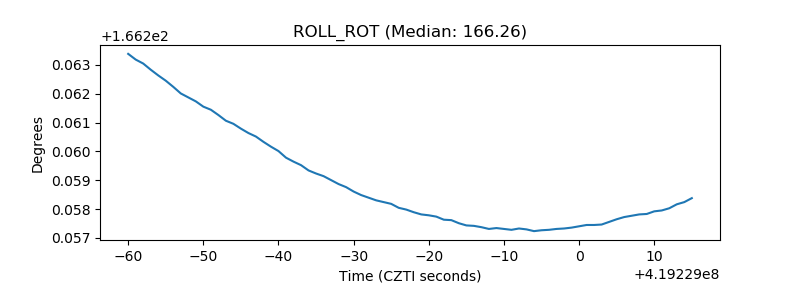 |
| _Roll_DEC | 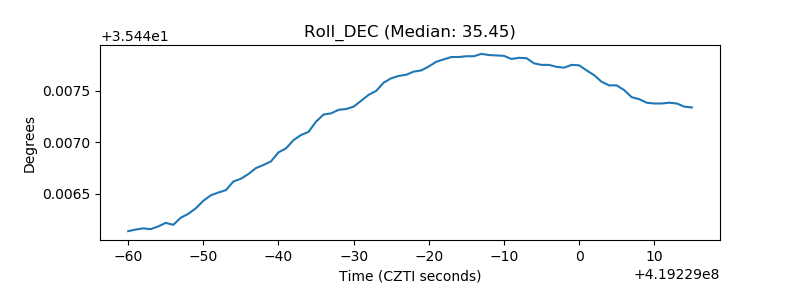 |
| _Roll_RA | 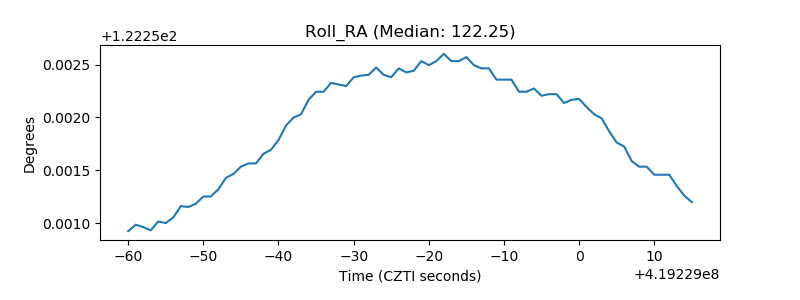 |
| Veto Counter | 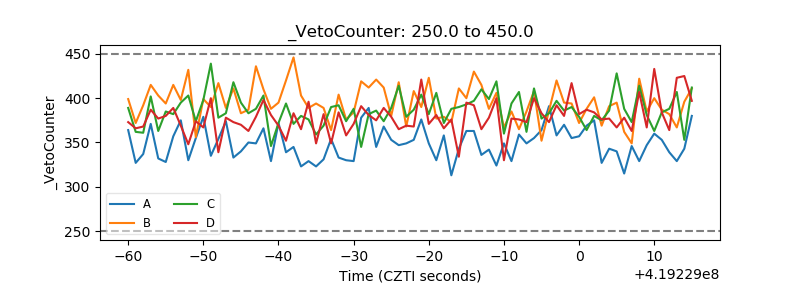 |