| Param | Original file | Final file |
|---|---|---|
| Filename | modeM0/AS1A12_099T03_9000005570_40797cztM0_level2.fits | modeM0/AS1A12_099T03_9000005570_40797cztM0_level2_quad_clean.evt |
| Size (bytes) | 58,703,040 | 15,710,400 |
| Size | 56.0 MB | 15.0 MB |
| Events in quadrant A | 559,784 | 103,097 |
| Events in quadrant B | 604,728 | 108,338 |
| Events in quadrant C | 485,475 | 99,982 |
| Events in quadrant D | 445,586 | 91,134 |
| Mode M0 | |||
|---|---|---|---|
| Quadrant | BADHDUFLAG | Total packets | Discarded packets |
| A | 0 | 2267 | 2 |
| B | 0 | 2418 | 1 |
| C | 0 | 1996 | 1 |
| D | 0 | 2034 | 1 |
| Mode SS | |||
|---|---|---|---|
| Quadrant | BADHDUFLAG | Total packets | Discarded packets |
| A | 0 | 18 | 0 |
| B | 0 | 18 | 0 |
| C | 0 | 18 | 0 |
| D | 0 | 18 | 0 |
| Mode M9 | |||
|---|---|---|---|
| Quadrant | BADHDUFLAG | Total packets | Discarded packets |
| A | 0 | 12 | 0 |
| B | 0 | 12 | 0 |
| C | 0 | 12 | 0 |
| D | 0 | 12 | 0 |
| Quadrant | Total seconds | Saturated seconds | Saturation percentage |
|---|---|---|---|
| A | 952 | 6 | 0.630252% |
| B | 952 | 21 | 2.205882% |
| C | 952 | 5 | 0.525210% |
| D | 952 | 7 | 0.735294% |
Noise dominated data is calculated using 1-second bins in cleaned event files. If a bin has >2000 counts, and if more than 50% of those come from <1% of pixels, then it is considered to be noise-dominated and hence unusable.
| Quadrant | # 1 sec bins | Bins with >0 counts | Bins with >2000 counts | High rate bins dominated by noise | Noise dominated (total time) | Noise dominated (detector-on time) | Marked lightcurve |
|---|---|---|---|---|---|---|---|
| A | 952 | 952 | 2 | 2 | 0.21% | 0.21% | 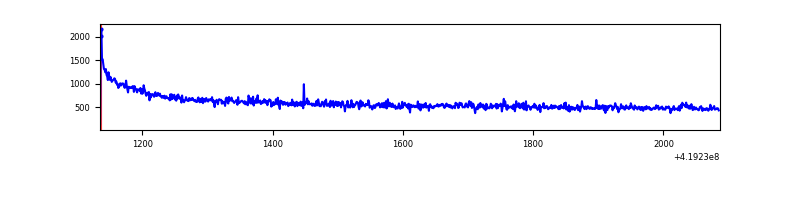 |
| B | 952 | 952 | 9 | 9 | 0.95% | 0.95% | 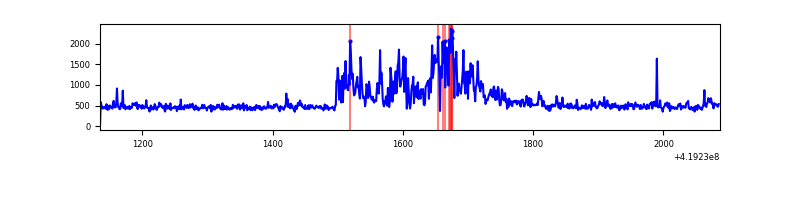 |
| C | 952 | 952 | 4 | 4 | 0.42% | 0.42% | 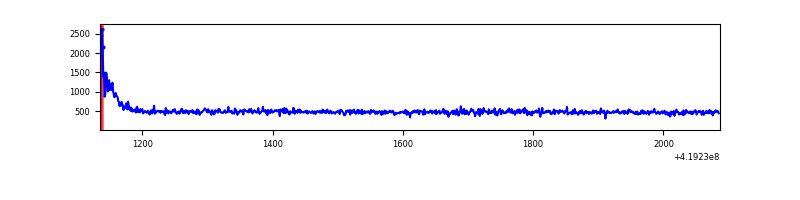 |
| D | 952 | 952 | 3 | 3 | 0.32% | 0.32% | 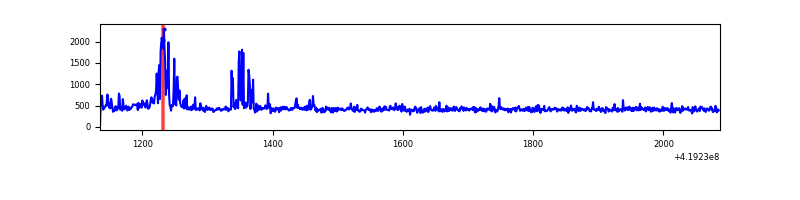 |
Top three noisy pixels from each quadrant. If the there are fewer than three noisy pixels in the level2.evt file, extra rows are filled as -1
| Pixel properties | Quadrant properties | ||||||
|---|---|---|---|---|---|---|---|
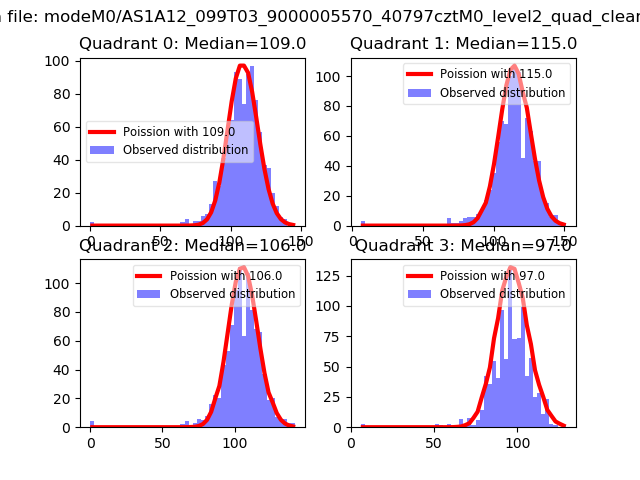
| Quadrant | DetID | PixID | Counts | Sigma | Mean | Median | Sigma |
| A | 10 | 83 | 146183 | 6078.42 | 106 | 103 | 24.0 |
| A | 12 | 189 | 1507 | 58.42 | 106 | 103 | 24.0 |
| A | 13 | 254 | 1335 | 51.26 | 106 | 103 | 24.0 |
| B | 5 | 255 | 179228 | 7912.69 | 106 | 103 | 22.6 |
| B | 0 | 190 | 5348 | 231.69 | 106 | 103 | 22.6 |
| B | 12 | 111 | 2684 | 114.01 | 106 | 103 | 22.6 |
| C | 15 | 214 | 46817 | 1759.02 | 105 | 105 | 26.6 |
| C | 0 | 10 | 26628 | 998.77 | 105 | 105 | 26.6 |
| C | 13 | 61 | 667 | 21.16 | 105 | 105 | 26.6 |
| D | 1 | 47 | 48456 | 1806.23 | 102 | 99 | 26.8 |
| D | 3 | 238 | 3272 | 118.52 | 102 | 99 | 26.8 |
| D | 2 | 234 | 3022 | 109.18 | 102 | 99 | 26.8 |
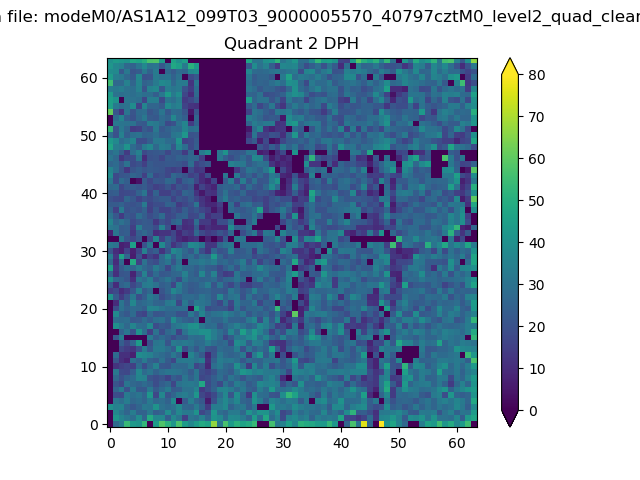
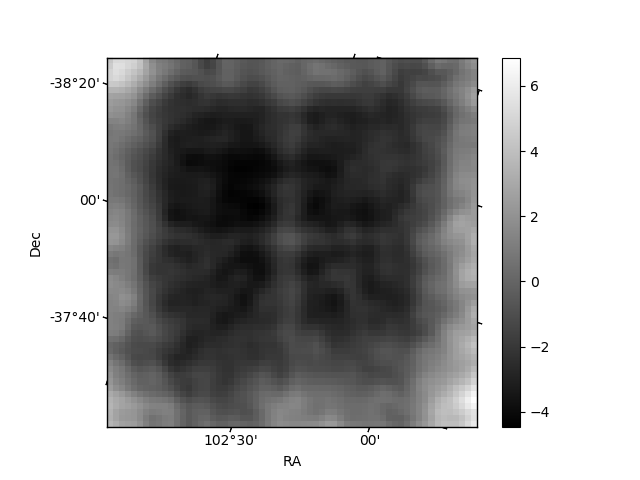
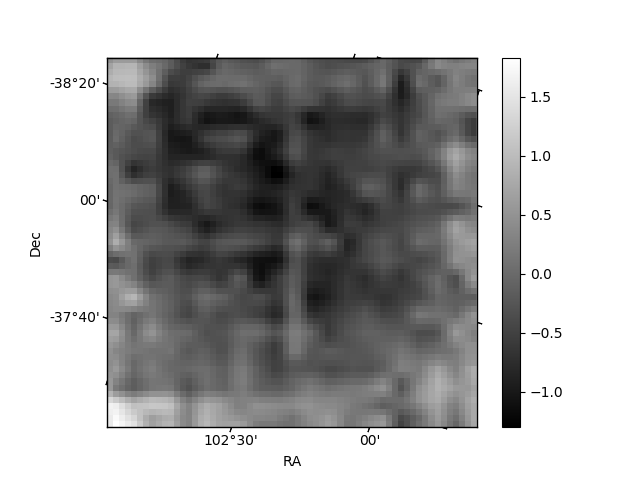
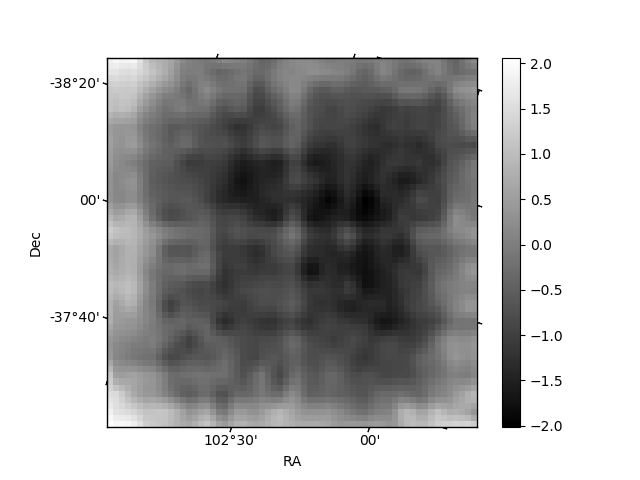
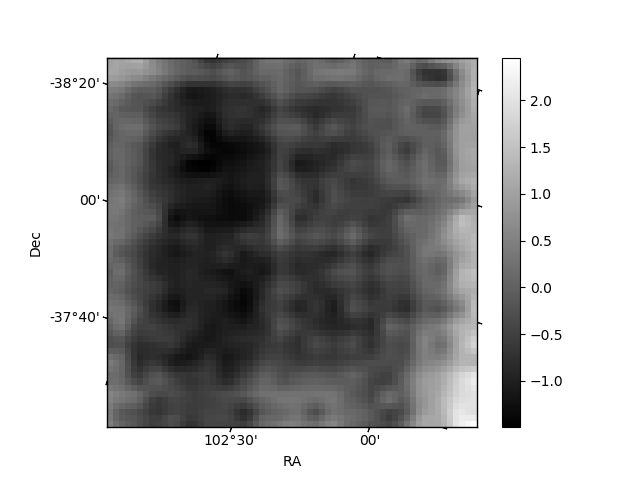
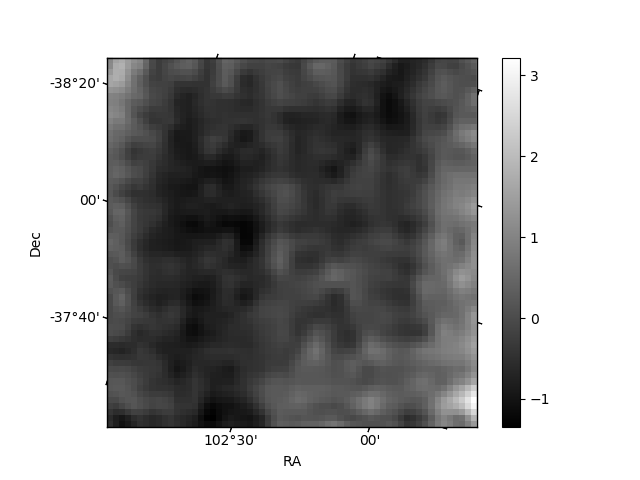
Histogram calculated using DETX and DETY for each event in the final _common_clean file
| Quadrant A | 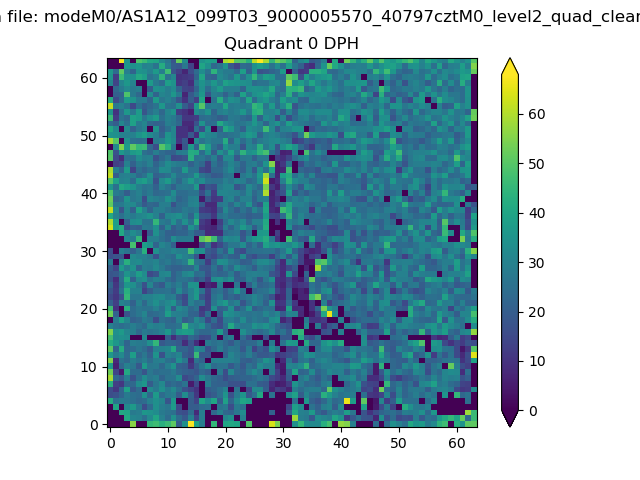 |
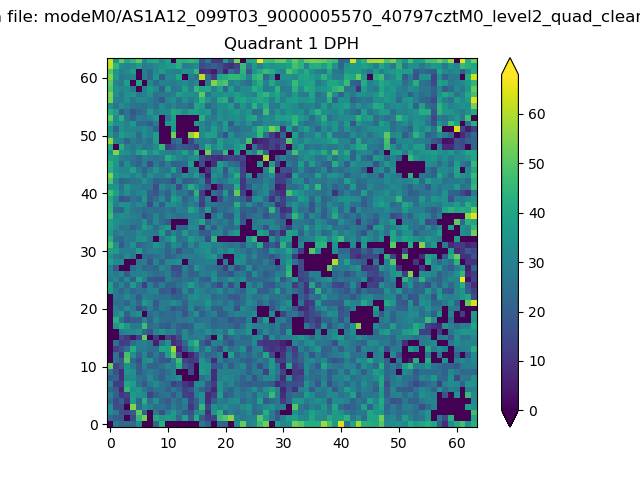 |
Quadrant B |
|---|---|---|---|
| Quadrant D | 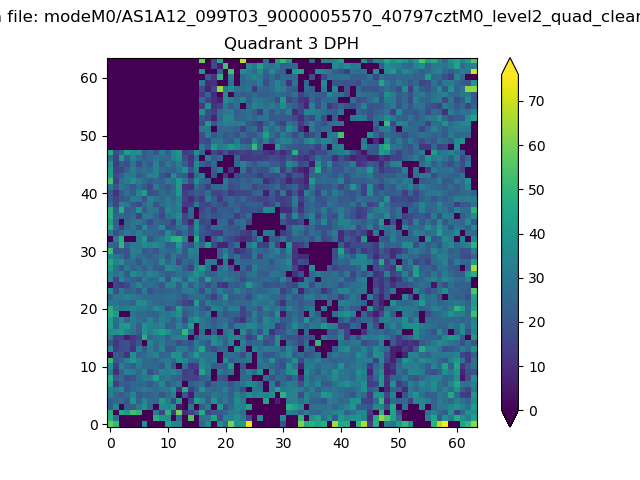 |
 |
Quadrant C |
| Plot type | Count rate plots | Images |
|---|---|---|
| Comparison with Poisson distribution Blue bars denote a histogram of data divided into 1 sec bins. Red curve is a Poisson curve with rate = median count rate of data. |
 |
 |
| Quadrant-wise count rates Data is divided into 100 sec bins |
 |
|
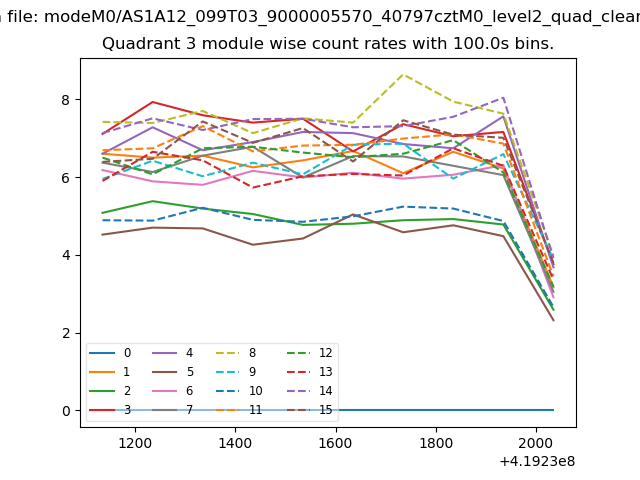
| Module-wise count rates for Quadrant A Data is divided into 100 sec bins |
 |
 |
| Module-wise count rates for Quadrant B Data is divided into 100 sec bins |
 |
 |
| Module-wise count rates for Quadrant C Data is divided into 100 sec bins |
 |
 |
| Module-wise count rates for Quadrant D Data is divided into 100 sec bins |
 |
 |
| Parameter | Plot |
|---|---|
| CZT HV Monitor |  |
| D_VDD | 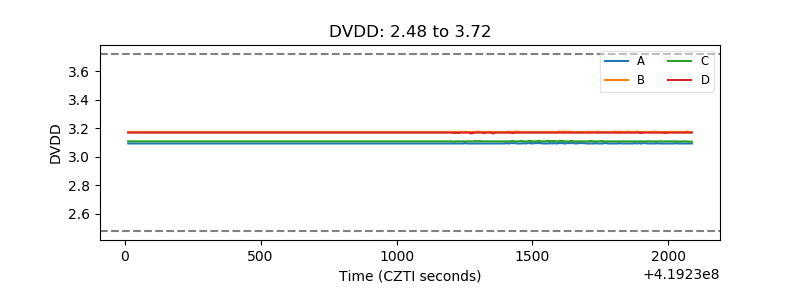 |
| Temperature 1 | 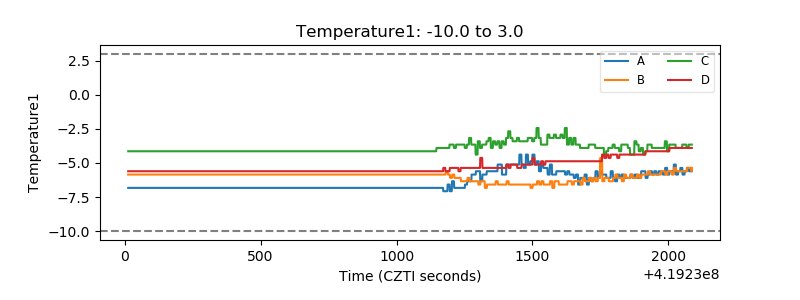 |
| Veto HV Monitor |  |
| Veto LLD | 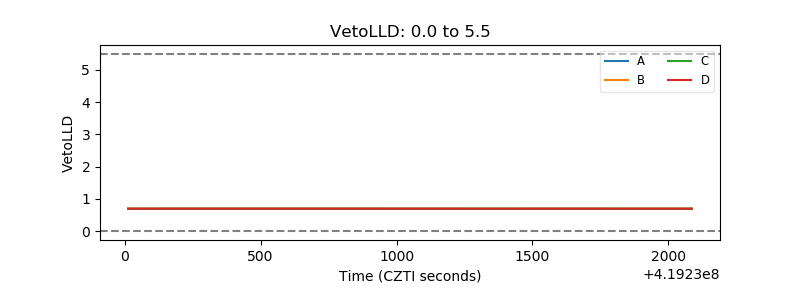 |
| Alpha Counter | 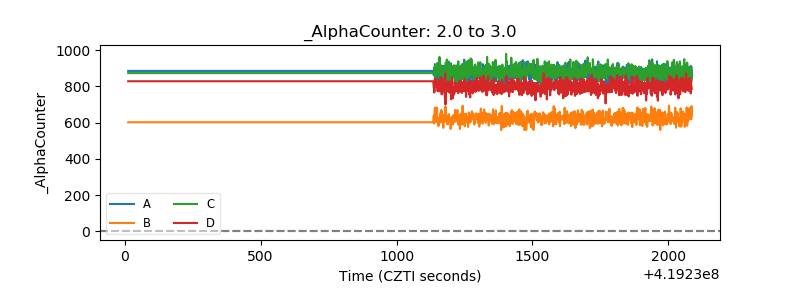 |
| _CPM_Rate | 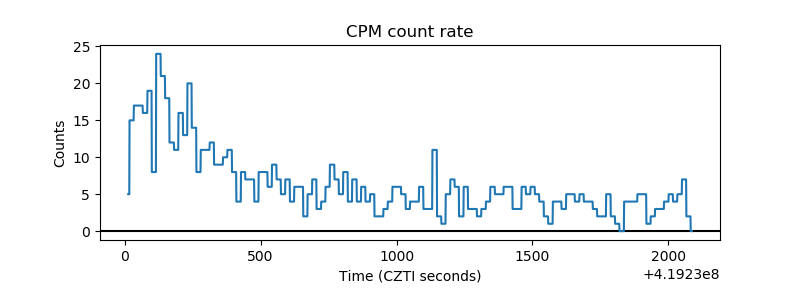 |
| CZT Counter | 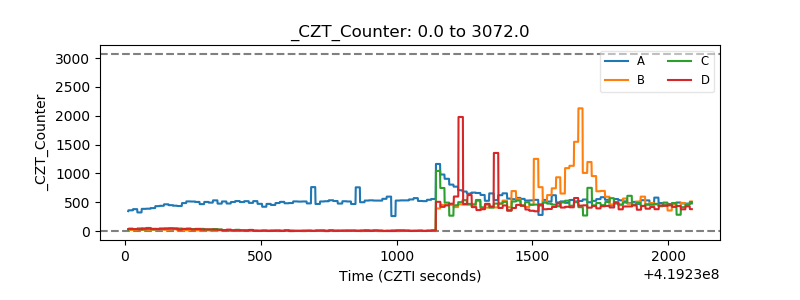 |
| +2.5 Volts monitor | 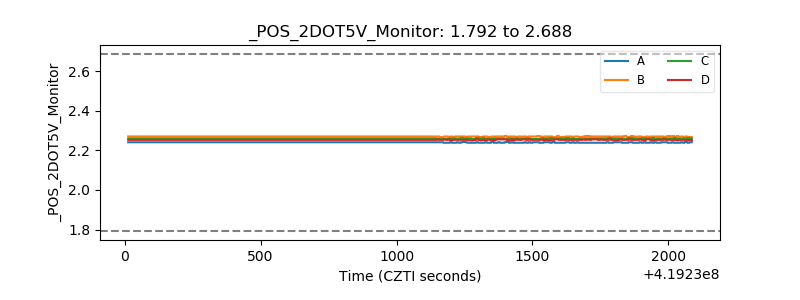 |
| +5 Volts monitor |  |
| _ROLL_ROT | 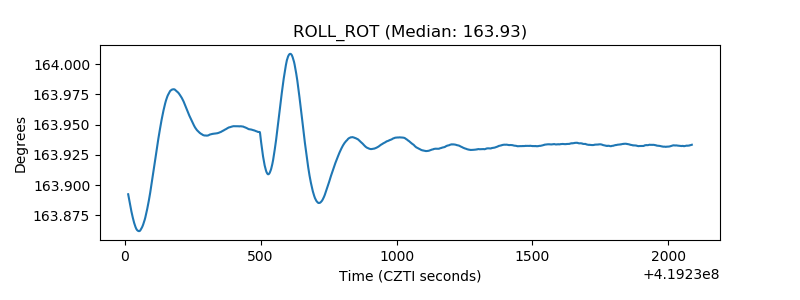 |
| _Roll_DEC | 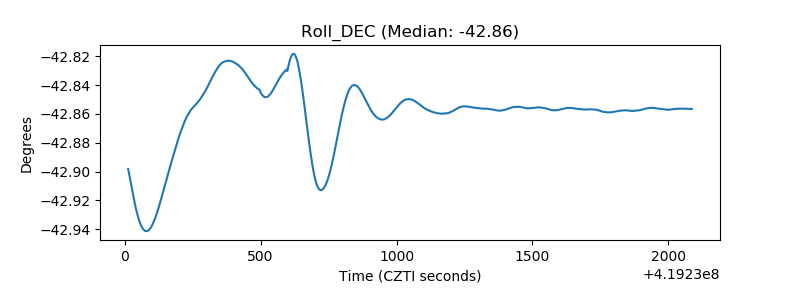 |
| _Roll_RA | 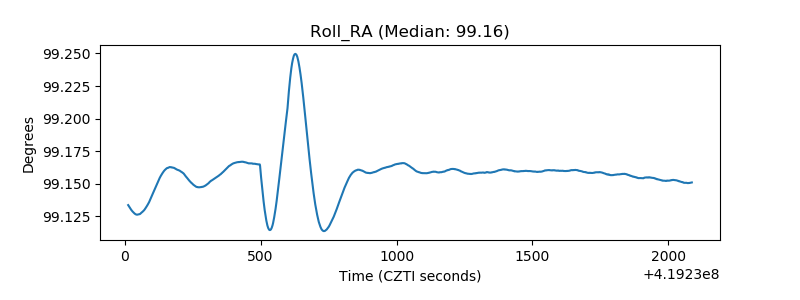 |
| Veto Counter |  |