| Param | Original file | Final file |
|---|---|---|
| Filename | modeM0/AS1A12_099T03_9000005570_40799cztM0_level2.fits | modeM0/AS1A12_099T03_9000005570_40799cztM0_level2_quad_clean.evt |
| Size (bytes) | 348,776,640 | 96,459,840 |
| Size | 332.6 MB | 92.0 MB |
| Events in quadrant A | 3,396,392 | 639,515 |
| Events in quadrant B | 2,938,187 | 659,666 |
| Events in quadrant C | 2,895,830 | 633,535 |
| Events in quadrant D | 3,219,045 | 574,073 |
| Mode M0 | |||
|---|---|---|---|
| Quadrant | BADHDUFLAG | Total packets | Discarded packets |
| A | 0 | 13544 | 3 |
| B | 0 | 12768 | 2 |
| C | 0 | 12312 | 2 |
| D | 0 | 13789 | 2 |
| Mode SS | |||
|---|---|---|---|
| Quadrant | BADHDUFLAG | Total packets | Discarded packets |
| A | 0 | 122 | 0 |
| B | 0 | 122 | 0 |
| C | 0 | 122 | 0 |
| D | 0 | 122 | 0 |
| Mode M9 | |||
|---|---|---|---|
| Quadrant | BADHDUFLAG | Total packets | Discarded packets |
| A | 0 | 24 | 0 |
| B | 0 | 24 | 0 |
| C | 0 | 24 | 0 |
| D | 0 | 25 | 0 |
| Quadrant | Total seconds | Saturated seconds | Saturation percentage |
|---|---|---|---|
| A | 5920 | 95 | 1.604730% |
| B | 5920 | 67 | 1.131757% |
| C | 5920 | 46 | 0.777027% |
| D | 5920 | 114 | 1.925676% |
Noise dominated data is calculated using 1-second bins in cleaned event files. If a bin has >2000 counts, and if more than 50% of those come from <1% of pixels, then it is considered to be noise-dominated and hence unusable.
| Quadrant | # 1 sec bins | Bins with >0 counts | Bins with >2000 counts | High rate bins dominated by noise | Noise dominated (total time) | Noise dominated (detector-on time) | Marked lightcurve |
|---|---|---|---|---|---|---|---|
| A | 7232 | 5921 | 69 | 69 | 0.95% | 1.17% | 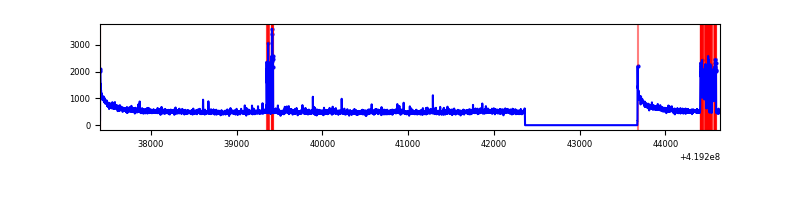 |
| B | 7232 | 5921 | 52 | 52 | 0.72% | 0.88% | 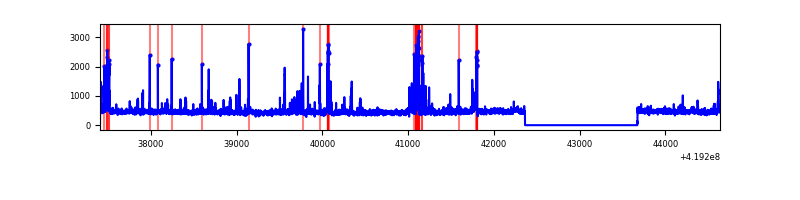 |
| C | 7232 | 5921 | 42 | 42 | 0.58% | 0.71% | 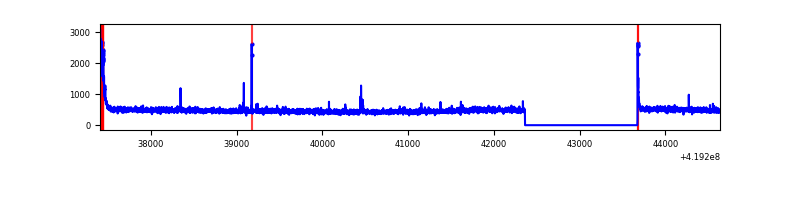 |
| D | 7232 | 5921 | 124 | 124 | 1.71% | 2.09% | 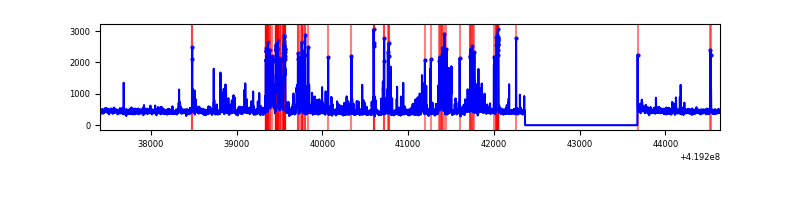 |
Top three noisy pixels from each quadrant. If the there are fewer than three noisy pixels in the level2.evt file, extra rows are filled as -1
| Pixel properties | Quadrant properties | ||||||
|---|---|---|---|---|---|---|---|
| Quadrant | DetID | PixID | Counts | Sigma | Mean | Median | Sigma |
| A | 10 | 83 | 549583 | 4070.4 | 651 | 637 | 134.9 |
| A | 6 | 10 | 274386 | 2029.83 | 651 | 637 | 134.9 |
| A | 12 | 189 | 31689 | 230.25 | 651 | 637 | 134.9 |
| B | 5 | 255 | 303111 | 2401.98 | 646 | 631 | 125.9 |
| B | 15 | 85 | 29815 | 231.75 | 646 | 631 | 125.9 |
| B | 0 | 230 | 26023 | 201.64 | 646 | 631 | 125.9 |
| C | 15 | 214 | 258000 | 1736.63 | 634 | 637 | 148.2 |
| C | 0 | 10 | 127065 | 853.11 | 634 | 637 | 148.2 |
| C | 14 | 254 | 28893 | 190.67 | 634 | 637 | 148.2 |
| D | 12 | 233 | 319231 | 2062.66 | 631 | 613 | 154.5 |
| D | 2 | 153 | 233470 | 1507.46 | 631 | 613 | 154.5 |
| D | 2 | 249 | 119366 | 768.78 | 631 | 613 | 154.5 |
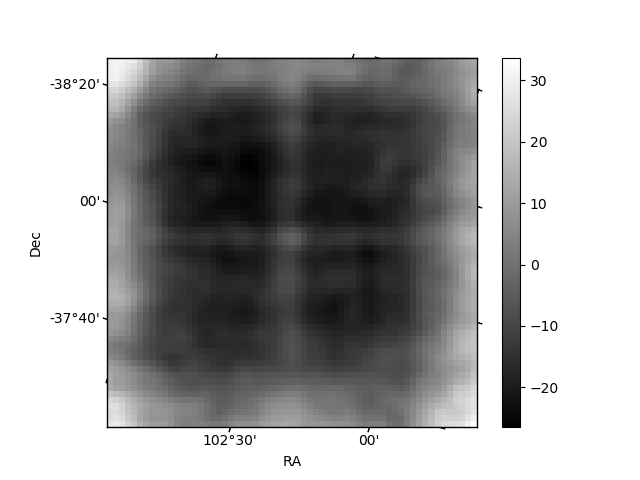
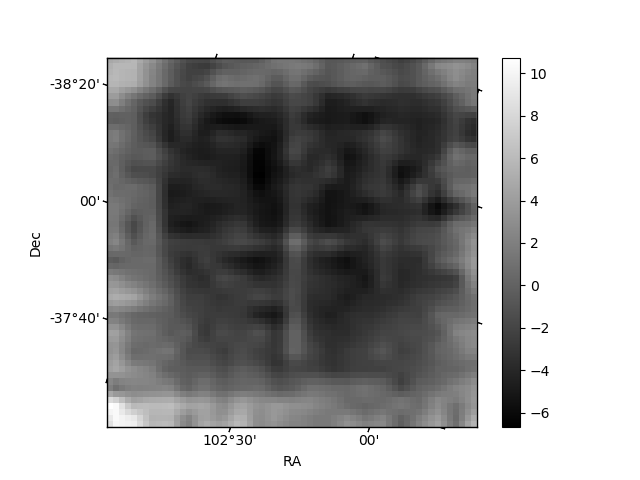
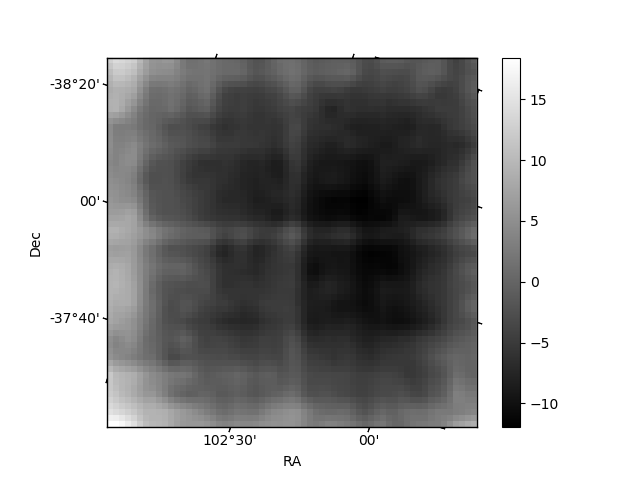
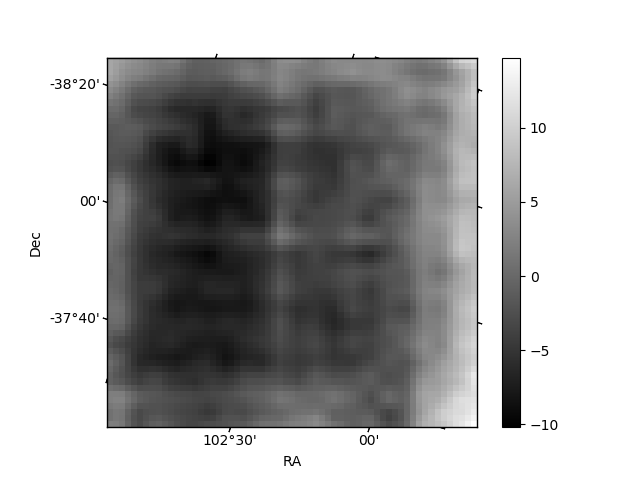
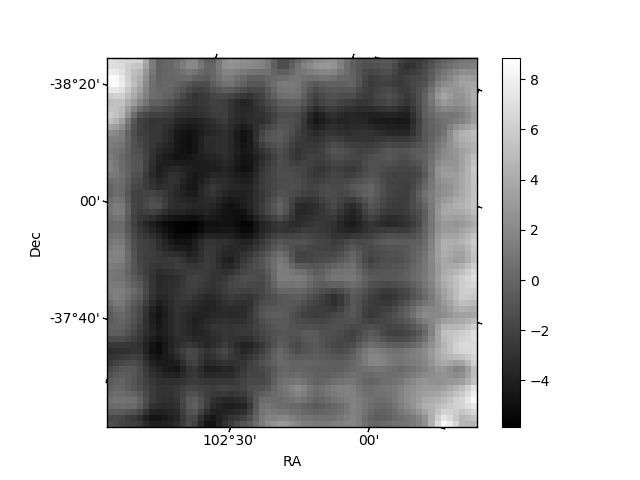
Histogram calculated using DETX and DETY for each event in the final _common_clean file
| Quadrant A |  |
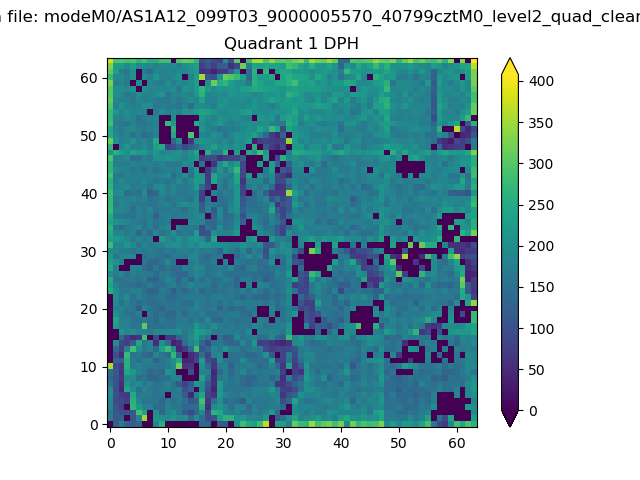 |
Quadrant B |
|---|---|---|---|
| Quadrant D | 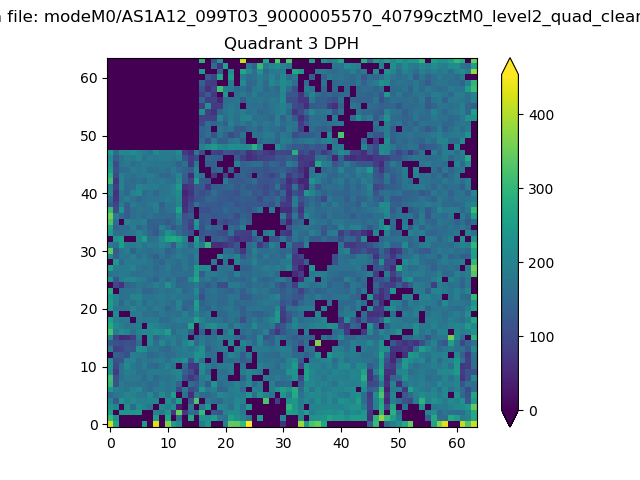 |
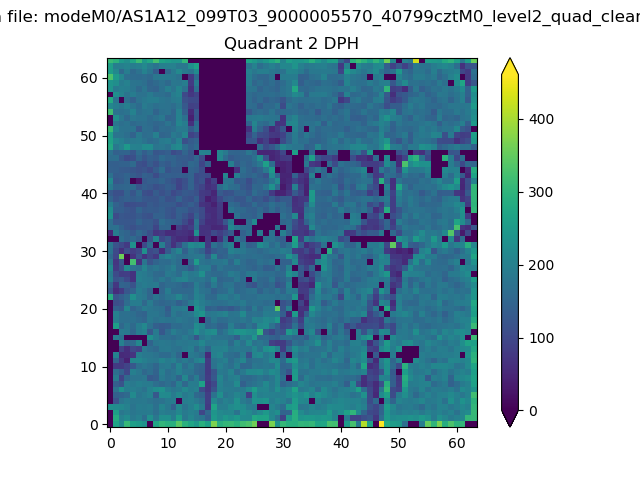 |
Quadrant C |
| Plot type | Count rate plots | Images |
|---|---|---|
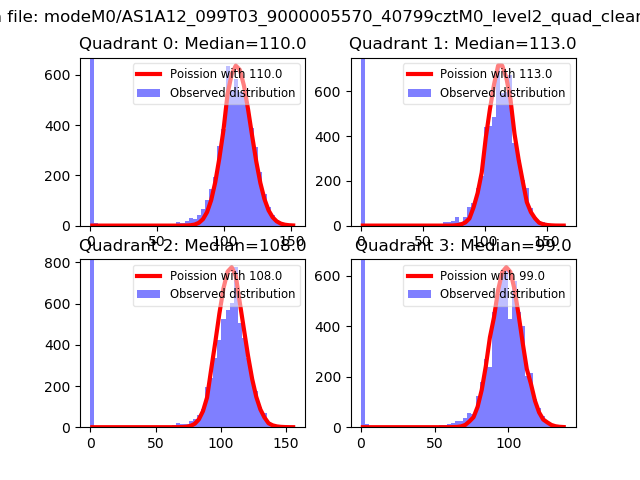
| Comparison with Poisson distribution Blue bars denote a histogram of data divided into 1 sec bins. Red curve is a Poisson curve with rate = median count rate of data. |
 |
 |
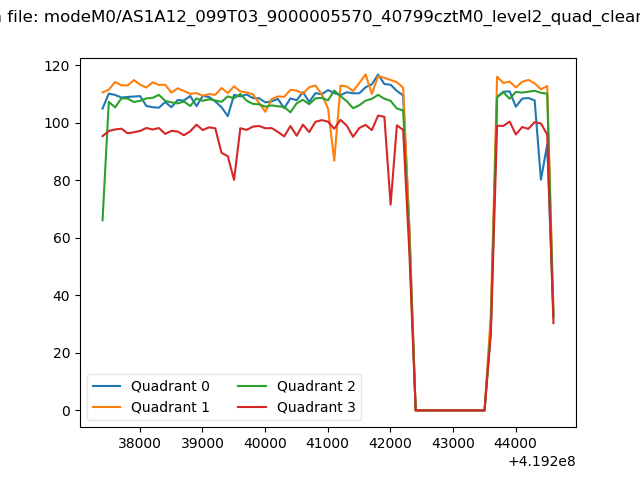
| Quadrant-wise count rates Data is divided into 100 sec bins |
 |
|
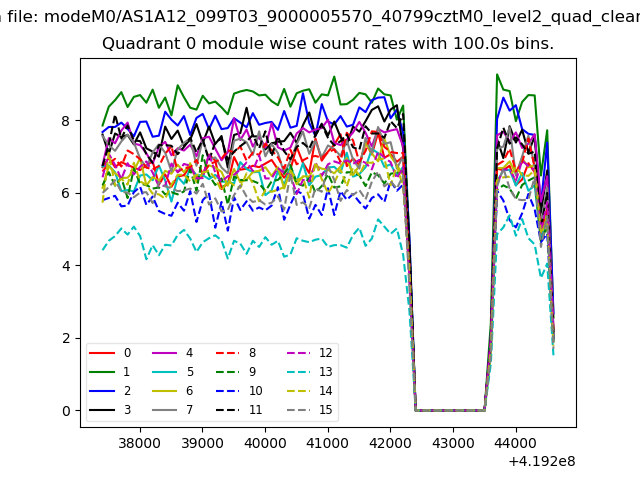
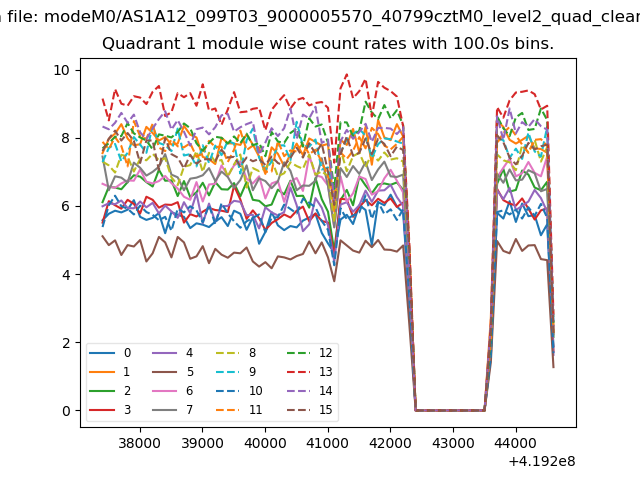
| Module-wise count rates for Quadrant A Data is divided into 100 sec bins |
 |
 |
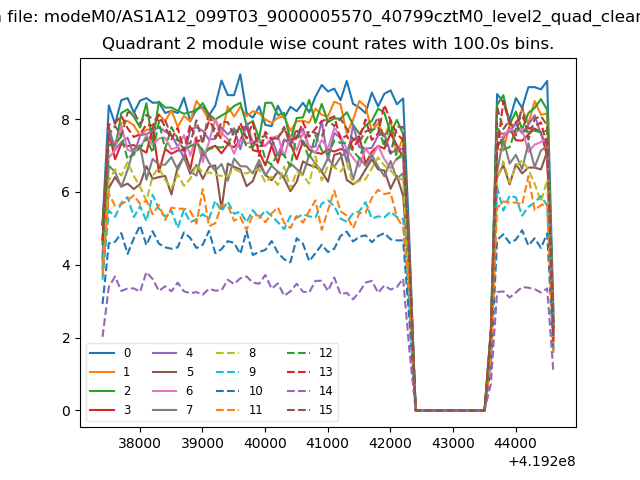
| Module-wise count rates for Quadrant B Data is divided into 100 sec bins |
 |
 |
| Module-wise count rates for Quadrant C Data is divided into 100 sec bins |
 |
 |
| Module-wise count rates for Quadrant D Data is divided into 100 sec bins |
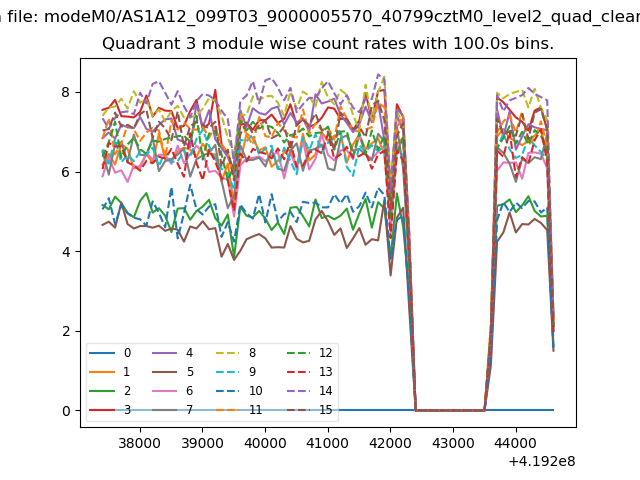 |
 |
| Parameter | Plot |
|---|---|
| CZT HV Monitor | 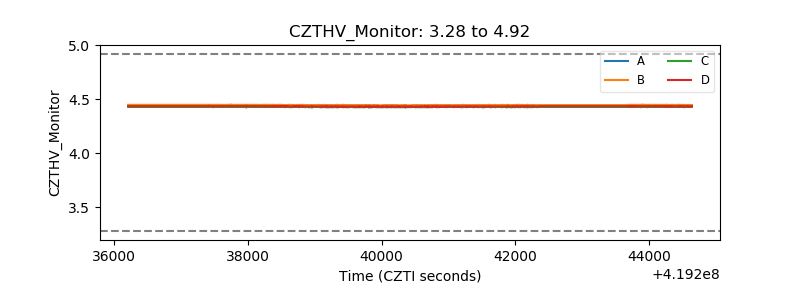 |
| D_VDD | 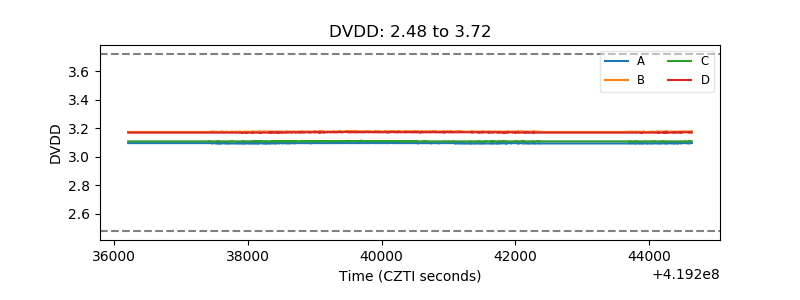 |
| Temperature 1 | 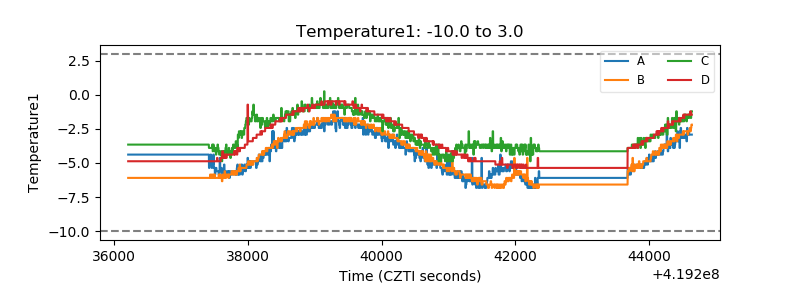 |
| Veto HV Monitor | 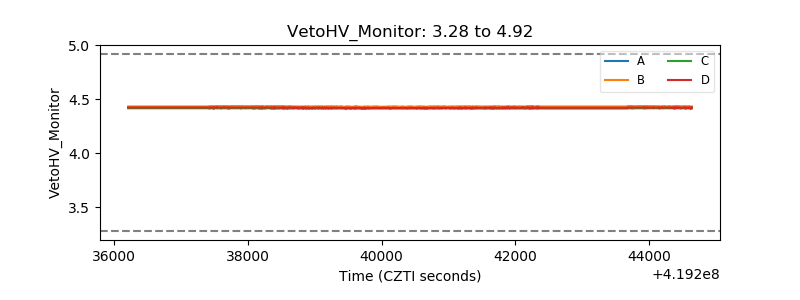 |
| Veto LLD | 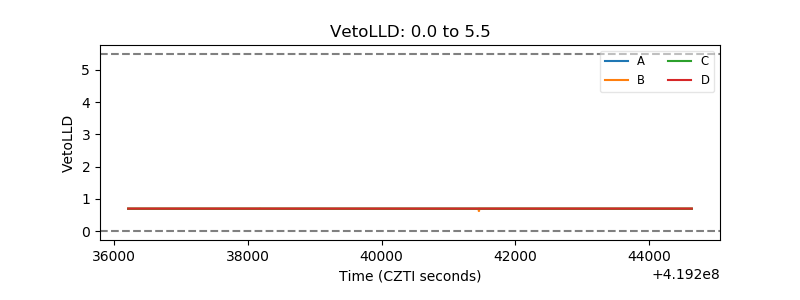 |
| Alpha Counter | 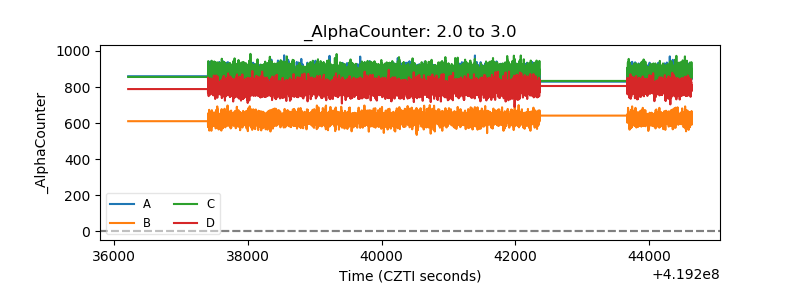 |
| _CPM_Rate | 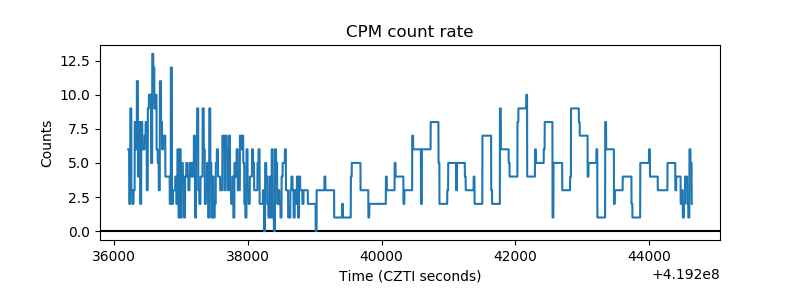 |
| CZT Counter | 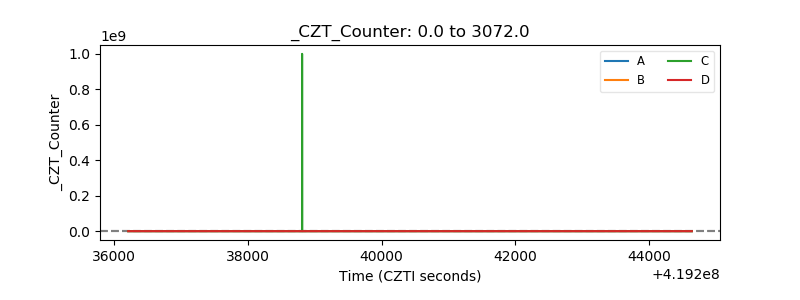 |
| +2.5 Volts monitor | 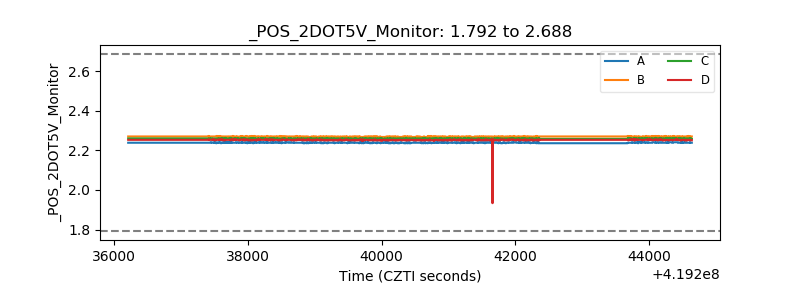 |
| +5 Volts monitor |  |
| _ROLL_ROT | 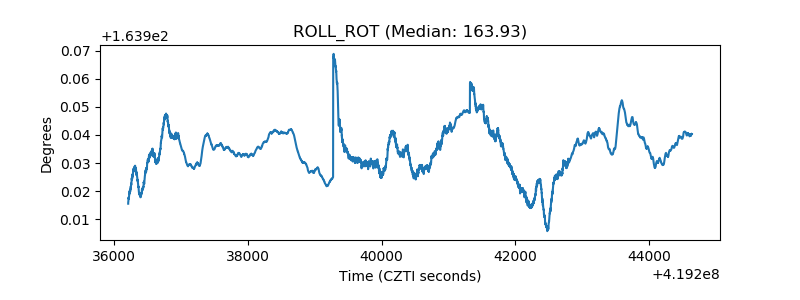 |
| _Roll_DEC | 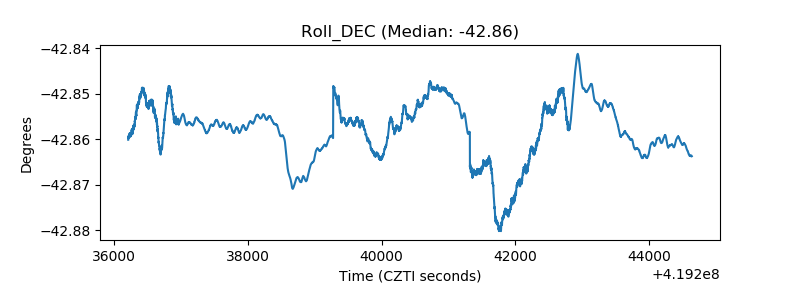 |
| _Roll_RA | 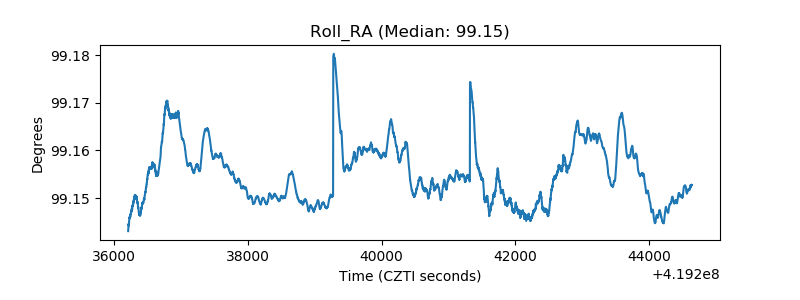 |
| Veto Counter | 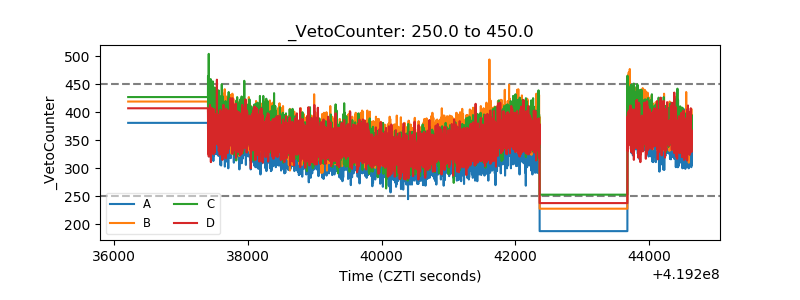 |