| Param | Original file | Final file |
|---|---|---|
| Filename | modeM0/AS1A12_099T03_9000005570_40802cztM0_level2.fits | modeM0/AS1A12_099T03_9000005570_40802cztM0_level2_quad_clean.evt |
| Size (bytes) | 868,466,880 | 251,467,200 |
| Size | 828.2 MB | 239.8 MB |
| Events in quadrant A | 8,532,134 | 1,670,818 |
| Events in quadrant B | 7,406,141 | 1,721,653 |
| Events in quadrant C | 7,427,440 | 1,641,126 |
| Events in quadrant D | 7,569,586 | 1,500,830 |
| Mode M0 | |||
|---|---|---|---|
| Quadrant | BADHDUFLAG | Total packets | Discarded packets |
| A | 0 | 34761 | 5 |
| B | 0 | 32784 | 4 |
| C | 0 | 32153 | 4 |
| D | 0 | 34035 | 4 |
| Mode SS | |||
|---|---|---|---|
| Quadrant | BADHDUFLAG | Total packets | Discarded packets |
| A | 0 | 318 | 0 |
| B | 0 | 318 | 0 |
| C | 0 | 318 | 0 |
| D | 0 | 318 | 0 |
| Mode M9 | |||
|---|---|---|---|
| Quadrant | BADHDUFLAG | Total packets | Discarded packets |
| A | 0 | 47 | 0 |
| B | 0 | 47 | 0 |
| C | 0 | 47 | 0 |
| D | 0 | 48 | 0 |
| Quadrant | Total seconds | Saturated seconds | Saturation percentage |
|---|---|---|---|
| A | 15637 | 153 | 0.978449% |
| B | 15637 | 113 | 0.722645% |
| C | 15637 | 38 | 0.243013% |
| D | 15637 | 161 | 1.029609% |
Noise dominated data is calculated using 1-second bins in cleaned event files. If a bin has >2000 counts, and if more than 50% of those come from <1% of pixels, then it is considered to be noise-dominated and hence unusable.
| Quadrant | # 1 sec bins | Bins with >0 counts | Bins with >2000 counts | High rate bins dominated by noise | Noise dominated (total time) | Noise dominated (detector-on time) | Marked lightcurve |
|---|---|---|---|---|---|---|---|
| A | 19814 | 15640 | 112 | 112 | 0.57% | 0.72% | 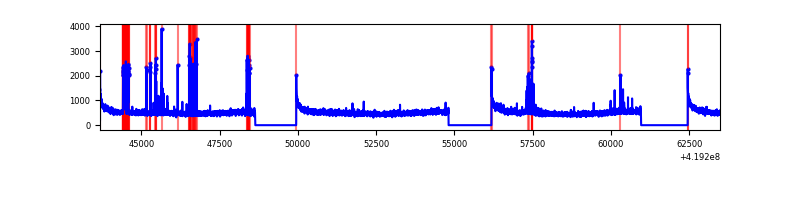 |
| B | 19814 | 15640 | 67 | 67 | 0.34% | 0.43% | 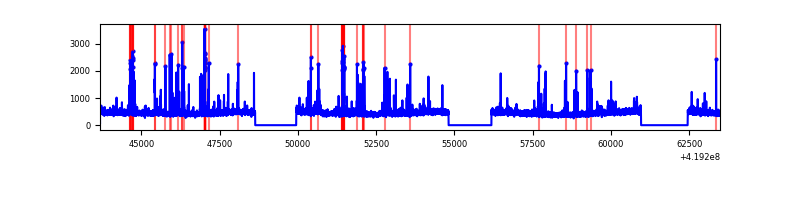 |
| C | 19814 | 15640 | 22 | 22 | 0.11% | 0.14% | 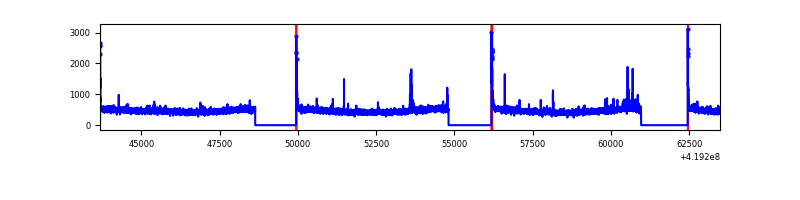 |
| D | 19814 | 15640 | 155 | 155 | 0.78% | 0.99% | 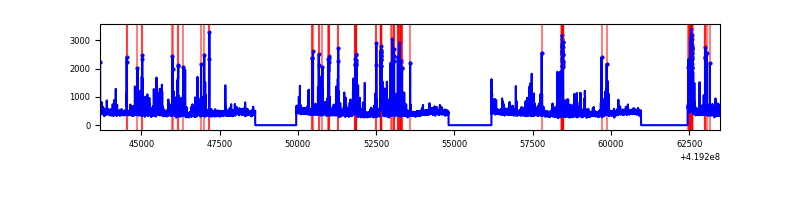 |
Top three noisy pixels from each quadrant. If the there are fewer than three noisy pixels in the level2.evt file, extra rows are filled as -1
| Pixel properties | Quadrant properties | ||||||
|---|---|---|---|---|---|---|---|
| Quadrant | DetID | PixID | Counts | Sigma | Mean | Median | Sigma |
| A | 10 | 83 | 1360822 | 3851.95 | 1713 | 1678 | 352.8 |
| A | 6 | 10 | 459416 | 1297.28 | 1713 | 1678 | 352.8 |
| A | 13 | 248 | 38042 | 103.06 | 1713 | 1678 | 352.8 |
| B | 5 | 255 | 357875 | 1076.23 | 1703 | 1653 | 331.0 |
| B | 15 | 85 | 154311 | 461.22 | 1703 | 1653 | 331.0 |
| B | 0 | 190 | 116634 | 347.38 | 1703 | 1653 | 331.0 |
| C | 15 | 214 | 663915 | 1710.77 | 1662 | 1672 | 387.1 |
| C | 0 | 10 | 132640 | 338.33 | 1662 | 1672 | 387.1 |
| C | 14 | 254 | 49891 | 124.56 | 1662 | 1672 | 387.1 |
| D | 12 | 233 | 287147 | 711.14 | 1656 | 1611 | 401.5 |
| D | 2 | 153 | 277232 | 686.45 | 1656 | 1611 | 401.5 |
| D | 2 | 249 | 197880 | 488.82 | 1656 | 1611 | 401.5 |
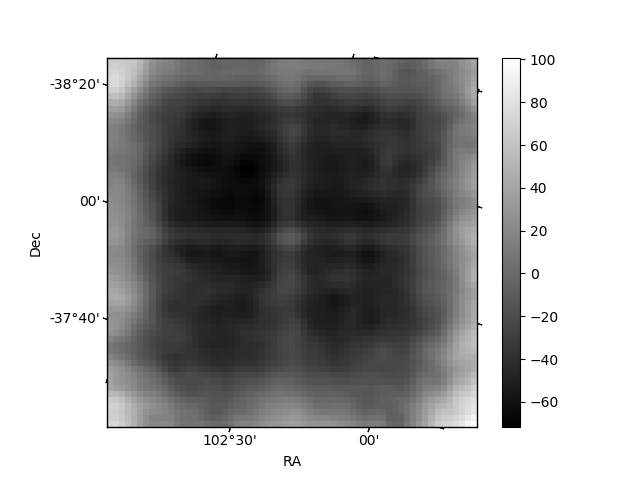
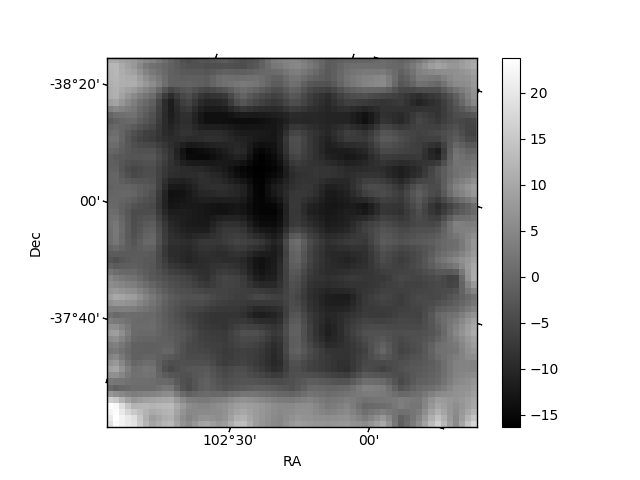
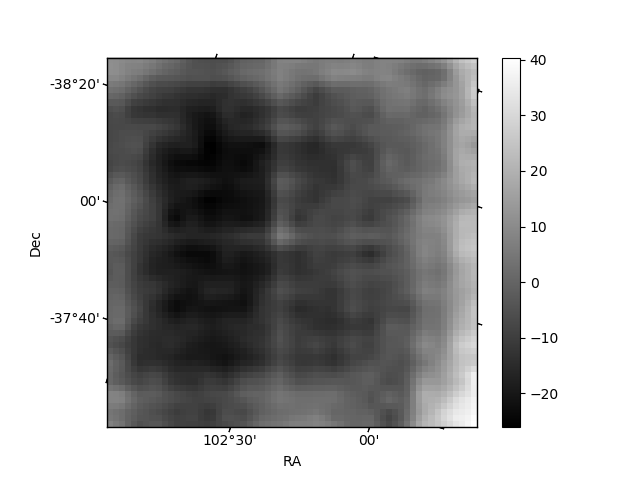
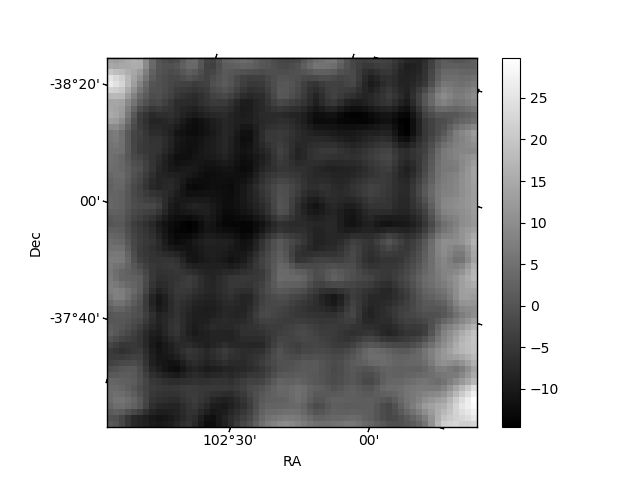
Histogram calculated using DETX and DETY for each event in the final _common_clean file
| Quadrant A | 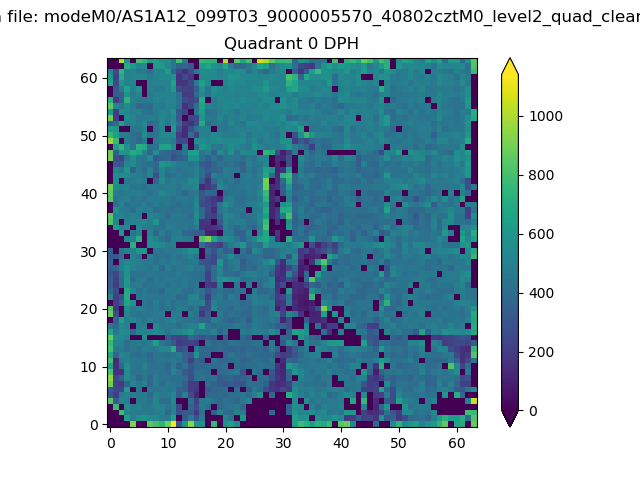 |
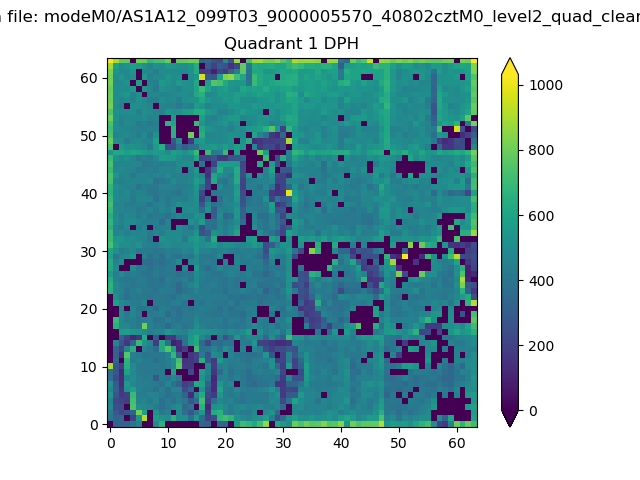 |
Quadrant B |
|---|---|---|---|
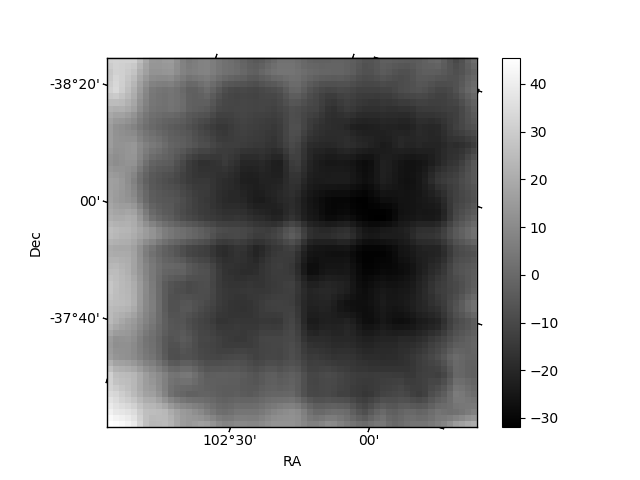
| Quadrant D | 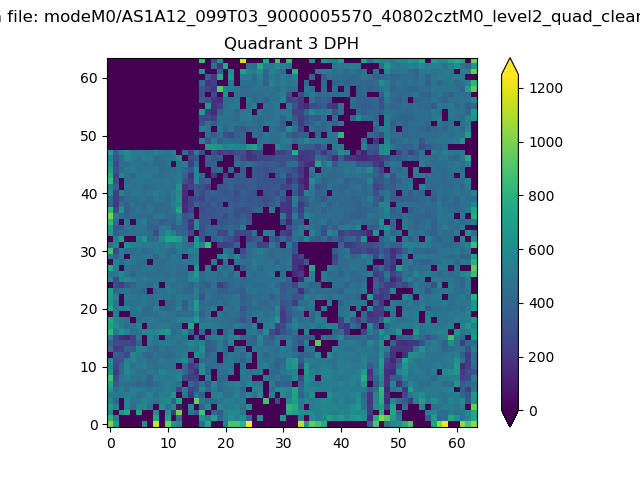 |
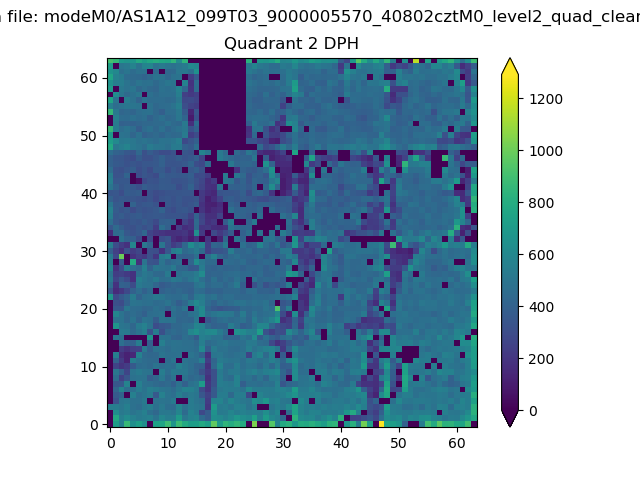 |
Quadrant C |
| Plot type | Count rate plots | Images |
|---|---|---|
| Comparison with Poisson distribution Blue bars denote a histogram of data divided into 1 sec bins. Red curve is a Poisson curve with rate = median count rate of data. |
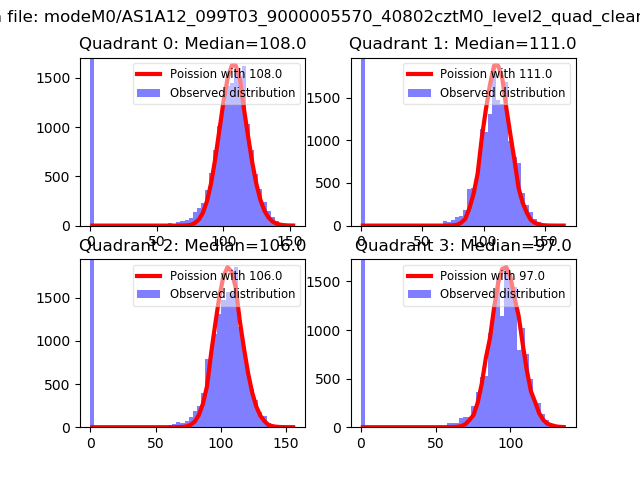 |
 |
| Quadrant-wise count rates Data is divided into 100 sec bins |
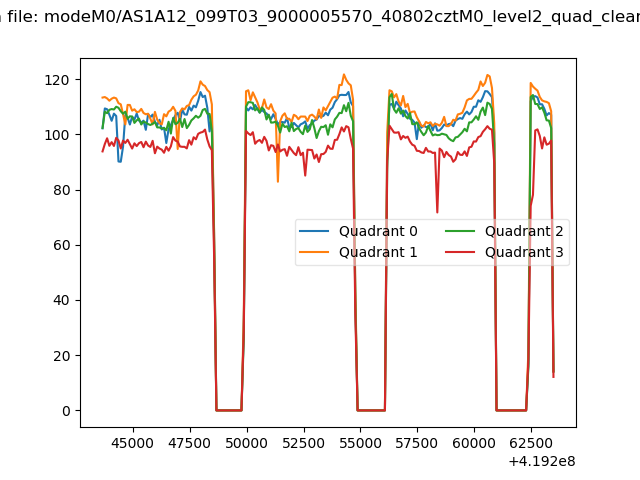 |
|
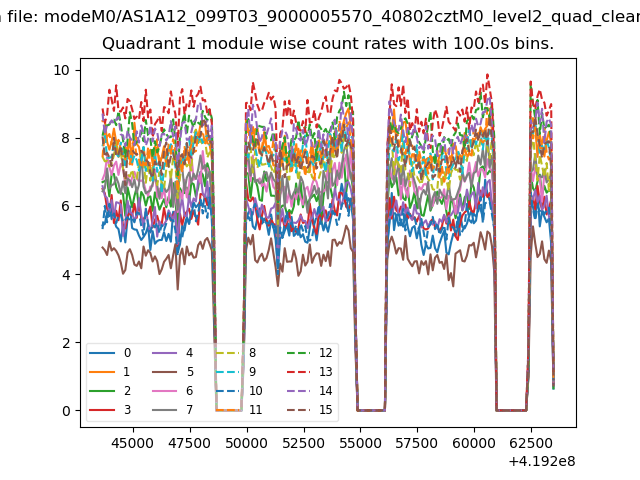
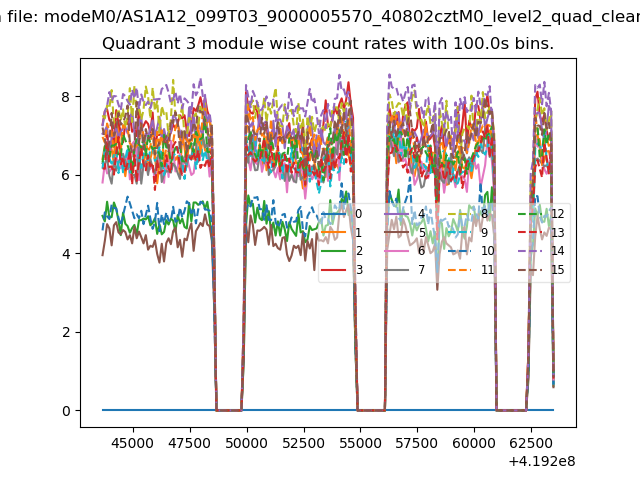
| Module-wise count rates for Quadrant A Data is divided into 100 sec bins |
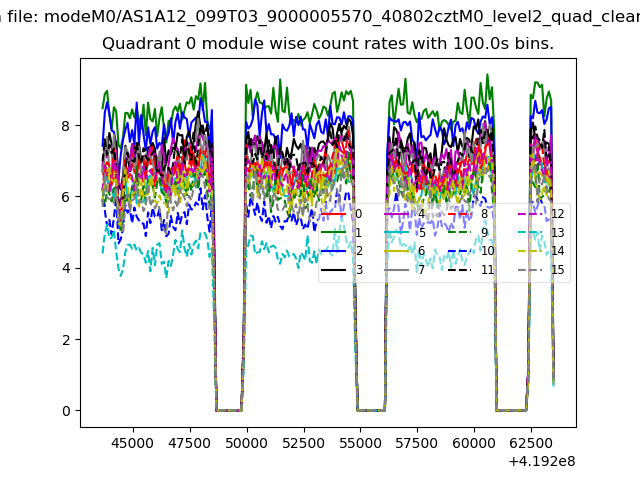 |
 |
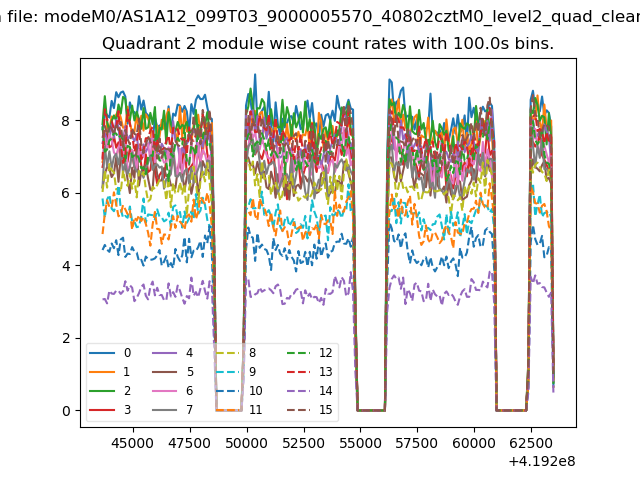
| Module-wise count rates for Quadrant B Data is divided into 100 sec bins |
 |
 |
| Module-wise count rates for Quadrant C Data is divided into 100 sec bins |
 |
 |
| Module-wise count rates for Quadrant D Data is divided into 100 sec bins |
 |
 |
| Parameter | Plot |
|---|---|
| CZT HV Monitor | 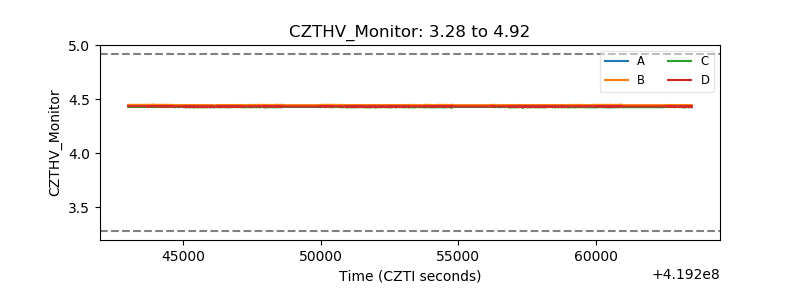 |
| D_VDD | 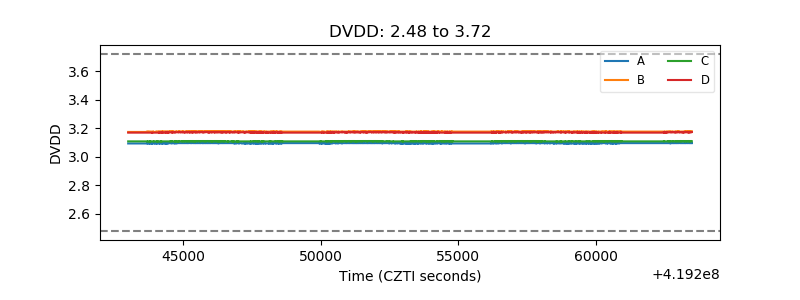 |
| Temperature 1 | 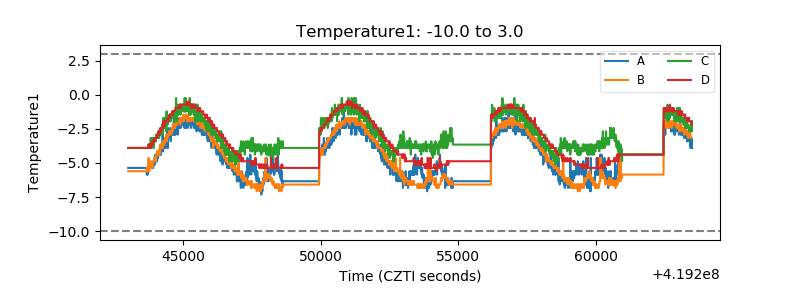 |
| Veto HV Monitor | 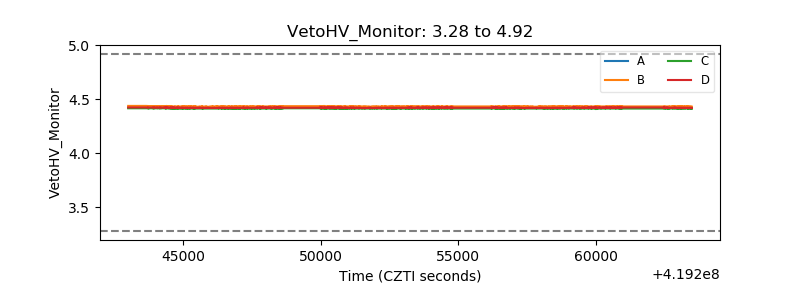 |
| Veto LLD | 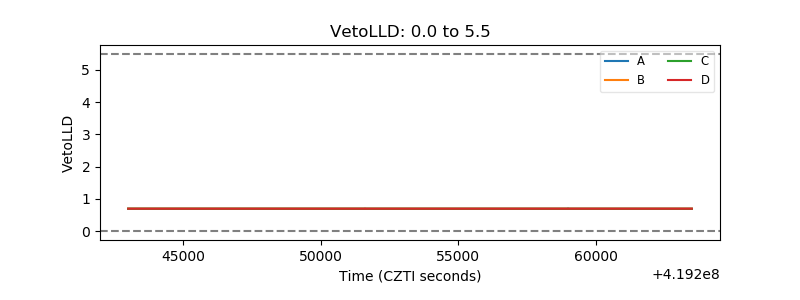 |
| Alpha Counter | 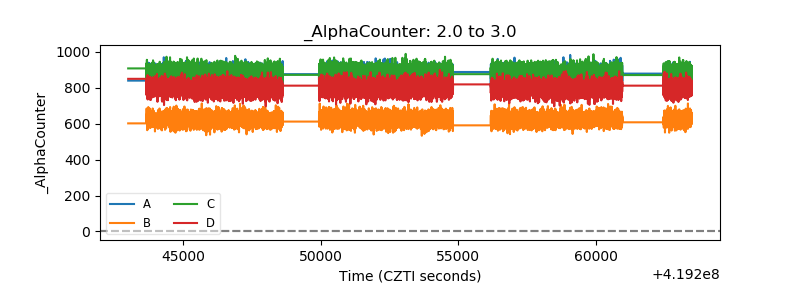 |
| _CPM_Rate | 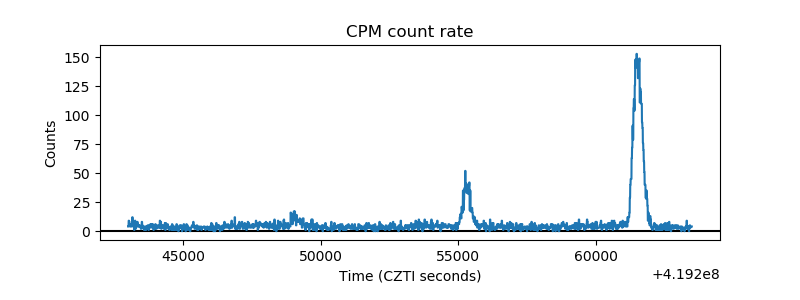 |
| CZT Counter | 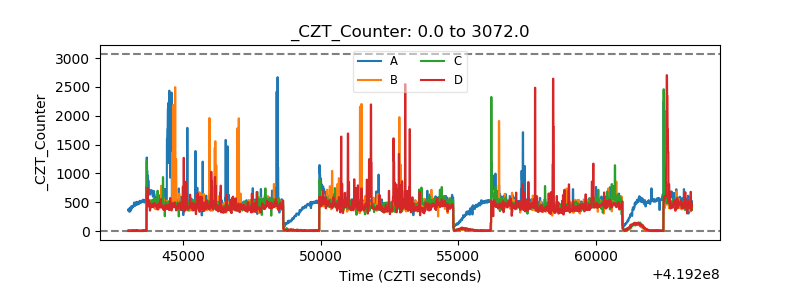 |
| +2.5 Volts monitor | 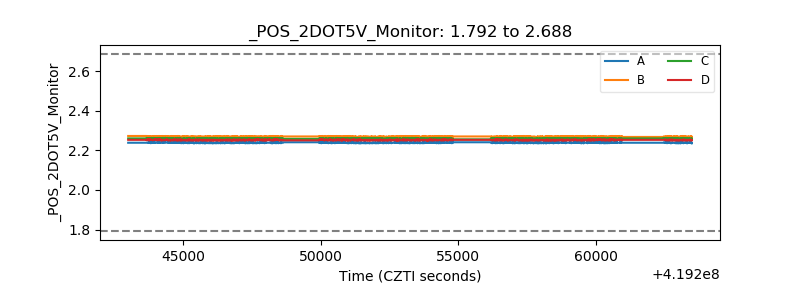 |
| +5 Volts monitor | 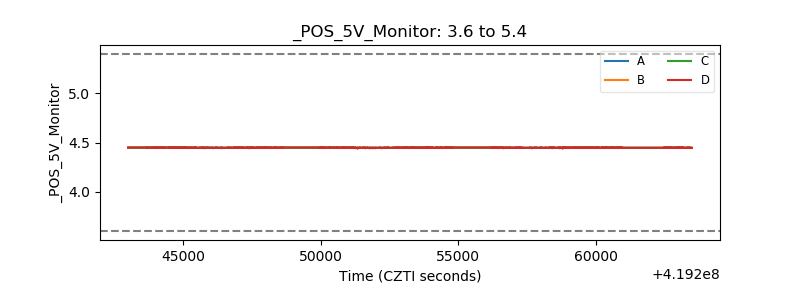 |
| _ROLL_ROT | 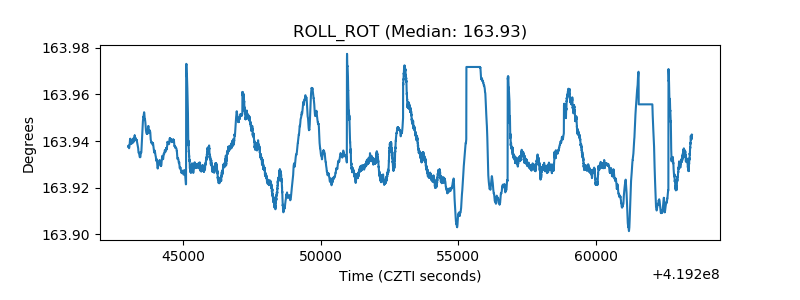 |
| _Roll_DEC | 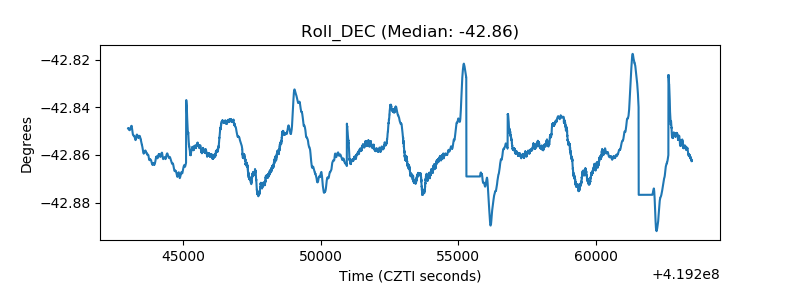 |
| _Roll_RA | 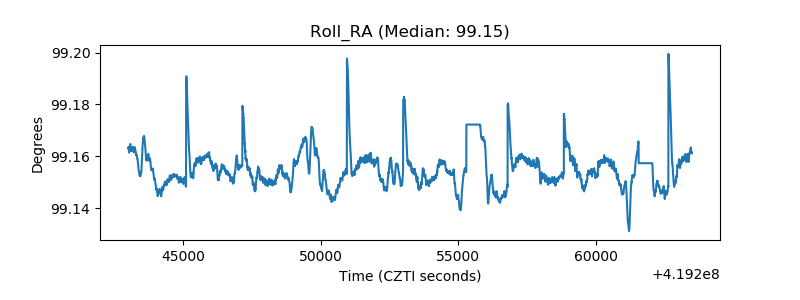 |
| Veto Counter | 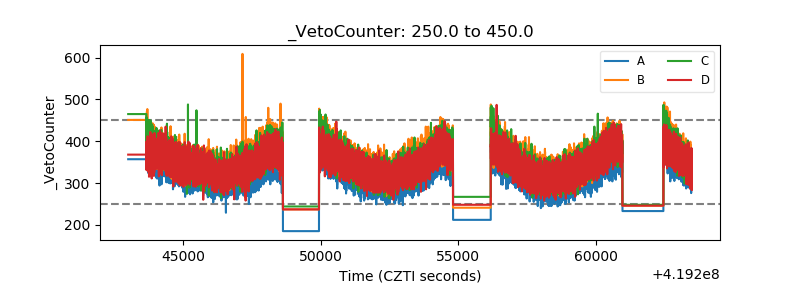 |