| Param | Original file | Final file |
|---|---|---|
| Filename | modeM0/AS1A12_099T03_9000005570_40803cztM0_level2.fits | modeM0/AS1A12_099T03_9000005570_40803cztM0_level2_quad_clean.evt |
| Size (bytes) | 318,663,360 | 91,851,840 |
| Size | 303.9 MB | 87.6 MB |
| Events in quadrant A | 2,964,305 | 615,802 |
| Events in quadrant B | 2,499,131 | 631,899 |
| Events in quadrant C | 2,757,612 | 594,602 |
| Events in quadrant D | 3,136,961 | 545,963 |
| Mode M0 | |||
|---|---|---|---|
| Quadrant | BADHDUFLAG | Total packets | Discarded packets |
| A | 0 | 12264 | 3 |
| B | 0 | 11408 | 2 |
| C | 0 | 11931 | 2 |
| D | 0 | 13480 | 2 |
| Mode SS | |||
|---|---|---|---|
| Quadrant | BADHDUFLAG | Total packets | Discarded packets |
| A | 0 | 112 | 0 |
| B | 0 | 112 | 0 |
| C | 0 | 112 | 0 |
| D | 0 | 112 | 0 |
| Mode M9 | |||
|---|---|---|---|
| Quadrant | BADHDUFLAG | Total packets | Discarded packets |
| A | 0 | 19 | 0 |
| B | 0 | 19 | 0 |
| C | 0 | 19 | 0 |
| D | 0 | 20 | 0 |
| Quadrant | Total seconds | Saturated seconds | Saturation percentage |
|---|---|---|---|
| A | 5616 | 14 | 0.249288% |
| B | 5616 | 17 | 0.302707% |
| C | 5616 | 54 | 0.961538% |
| D | 5616 | 113 | 2.012108% |
Noise dominated data is calculated using 1-second bins in cleaned event files. If a bin has >2000 counts, and if more than 50% of those come from <1% of pixels, then it is considered to be noise-dominated and hence unusable.
| Quadrant | # 1 sec bins | Bins with >0 counts | Bins with >2000 counts | High rate bins dominated by noise | Noise dominated (total time) | Noise dominated (detector-on time) | Marked lightcurve |
|---|---|---|---|---|---|---|---|
| A | 7228 | 5617 | 5 | 5 | 0.07% | 0.09% | 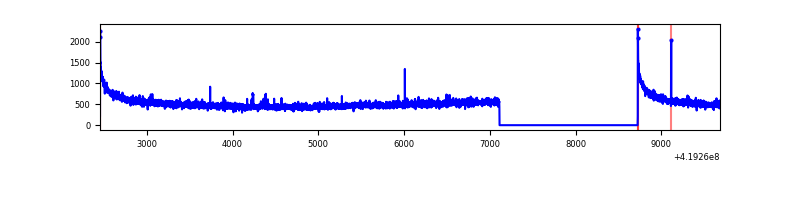 |
| B | 7228 | 5617 | 4 | 4 | 0.06% | 0.07% | 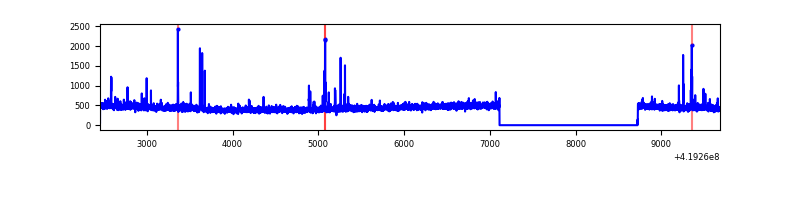 |
| C | 7228 | 5617 | 42 | 42 | 0.58% | 0.75% | 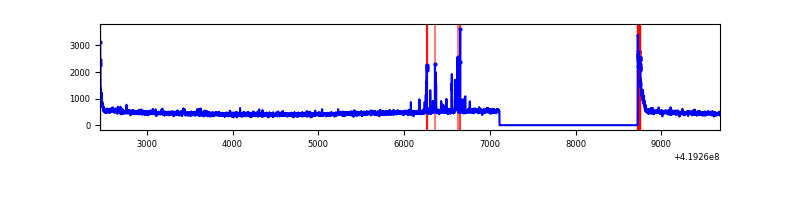 |
| D | 7228 | 5617 | 112 | 112 | 1.55% | 1.99% | 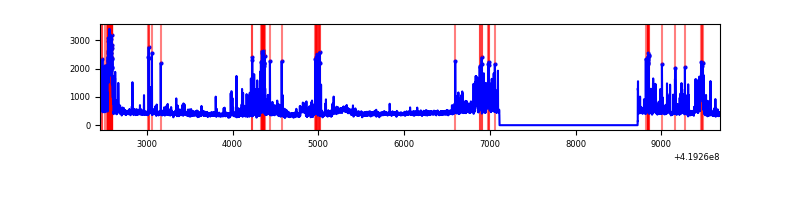 |
Top three noisy pixels from each quadrant. If the there are fewer than three noisy pixels in the level2.evt file, extra rows are filled as -1
| Pixel properties | Quadrant properties | ||||||
|---|---|---|---|---|---|---|---|
| Quadrant | DetID | PixID | Counts | Sigma | Mean | Median | Sigma |
| A | 10 | 83 | 548027 | 4299.8 | 615 | 602 | 127.3 |
| A | 2 | 79 | 14862 | 112.01 | 615 | 602 | 127.3 |
| A | 13 | 6 | 13146 | 98.53 | 615 | 602 | 127.3 |
| B | 0 | 190 | 40827 | 334.78 | 612 | 595 | 120.2 |
| B | 0 | 230 | 25708 | 208.97 | 612 | 595 | 120.2 |
| B | 5 | 255 | 22557 | 182.75 | 612 | 595 | 120.2 |
| C | 15 | 214 | 237248 | 1701.38 | 592 | 594 | 139.1 |
| C | 0 | 10 | 126139 | 902.58 | 592 | 594 | 139.1 |
| C | 14 | 254 | 76724 | 547.32 | 592 | 594 | 139.1 |
| D | 6 | 239 | 270202 | 1860.55 | 587 | 569 | 144.9 |
| D | 12 | 233 | 164375 | 1130.31 | 587 | 569 | 144.9 |
| D | 2 | 153 | 136753 | 939.71 | 587 | 569 | 144.9 |
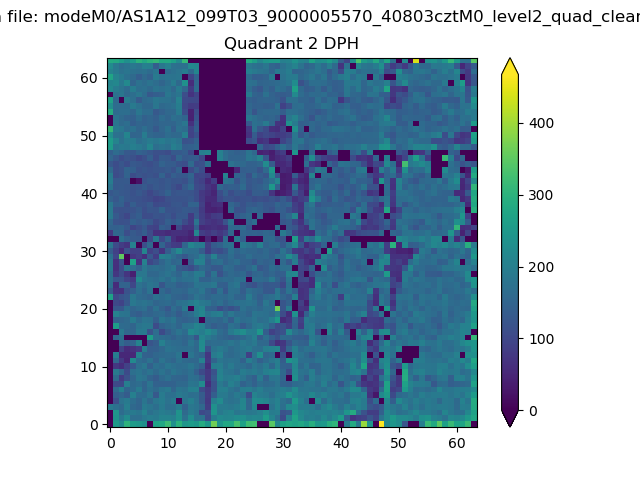
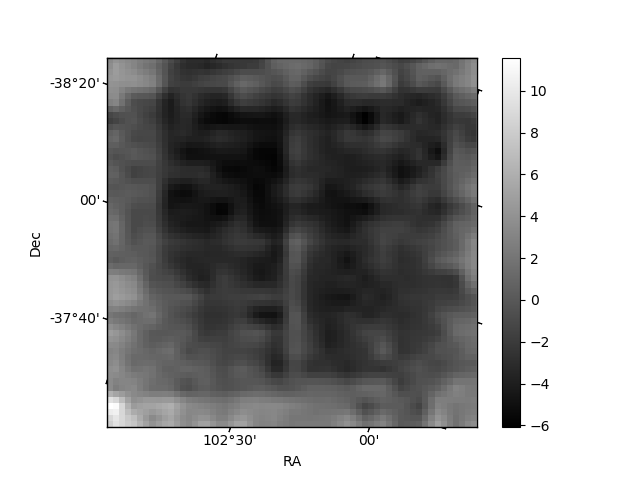
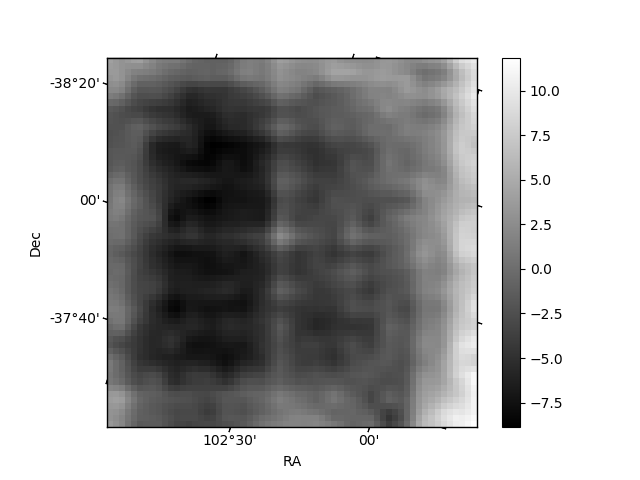
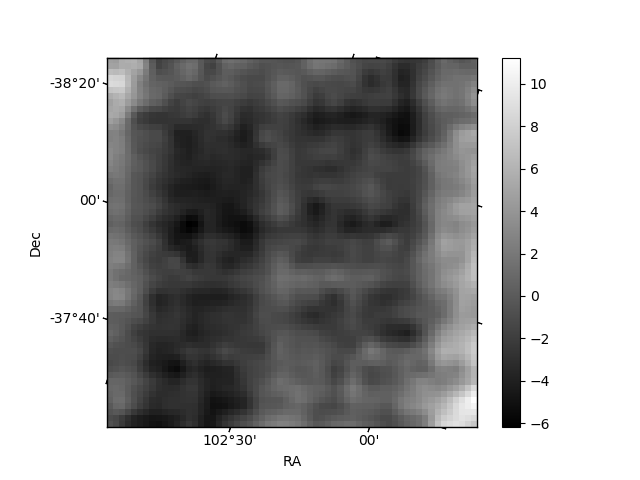
Histogram calculated using DETX and DETY for each event in the final _common_clean file
| Quadrant A |  |
 |
Quadrant B |
|---|---|---|---|
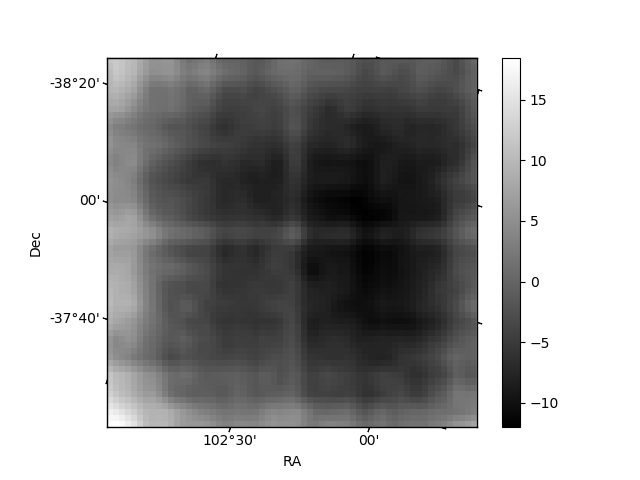
| Quadrant D |  |
 |
Quadrant C |
| Plot type | Count rate plots | Images |
|---|---|---|
| Comparison with Poisson distribution Blue bars denote a histogram of data divided into 1 sec bins. Red curve is a Poisson curve with rate = median count rate of data. |
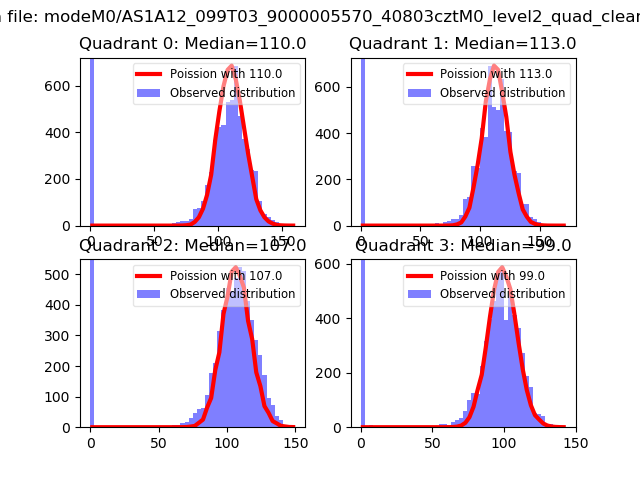 |
 |
| Quadrant-wise count rates Data is divided into 100 sec bins |
 |
|
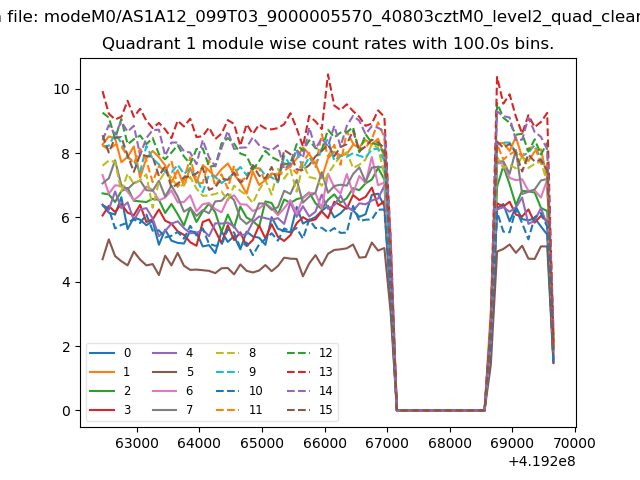
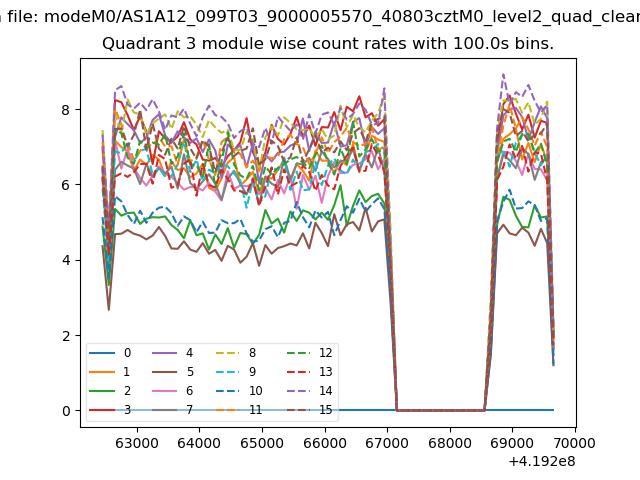
| Module-wise count rates for Quadrant A Data is divided into 100 sec bins |
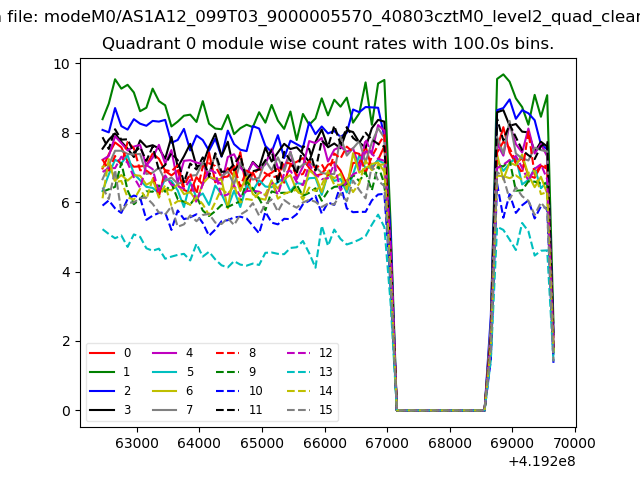 |
 |
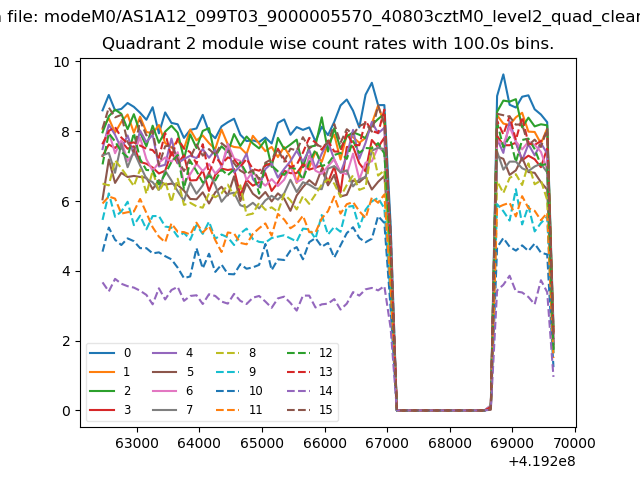
| Module-wise count rates for Quadrant B Data is divided into 100 sec bins |
 |
 |
| Module-wise count rates for Quadrant C Data is divided into 100 sec bins |
 |
 |
| Module-wise count rates for Quadrant D Data is divided into 100 sec bins |
 |
 |
| Parameter | Plot |
|---|---|
| CZT HV Monitor |  |
| D_VDD | 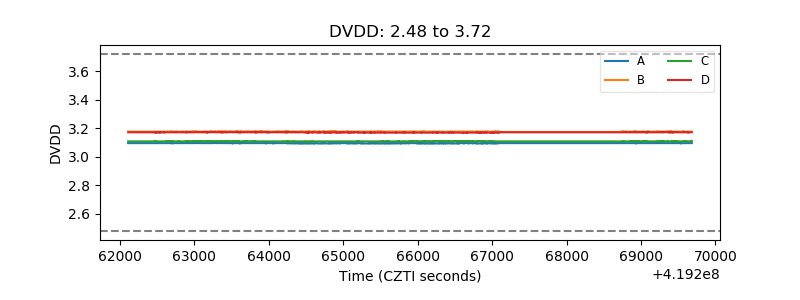 |
| Temperature 1 | 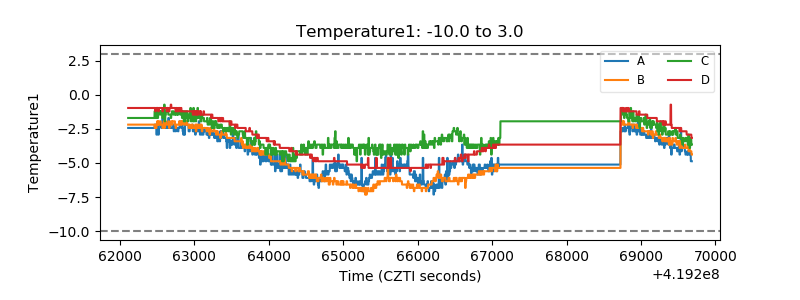 |
| Veto HV Monitor | 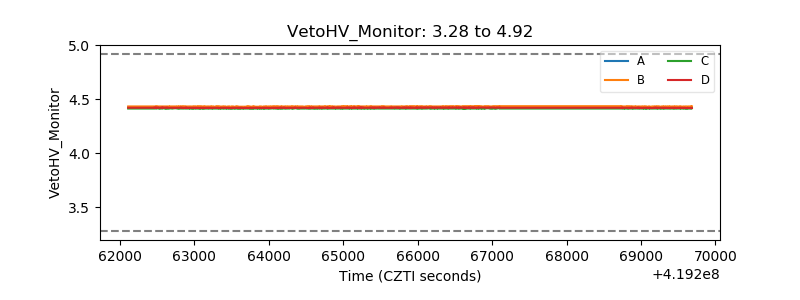 |
| Veto LLD | 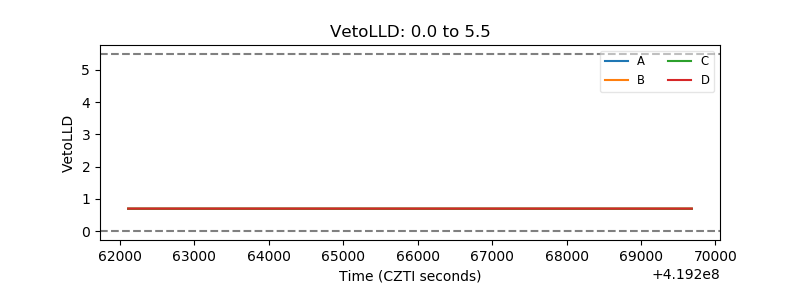 |
| Alpha Counter | 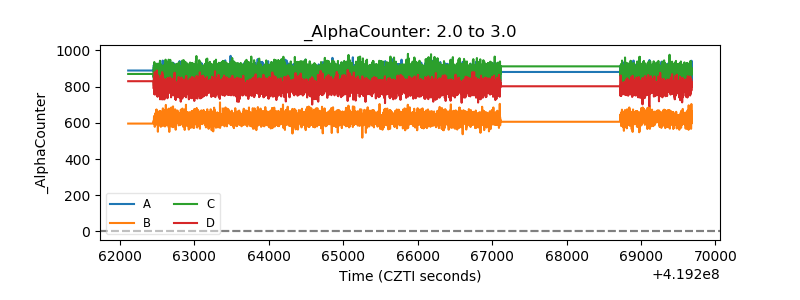 |
| _CPM_Rate | 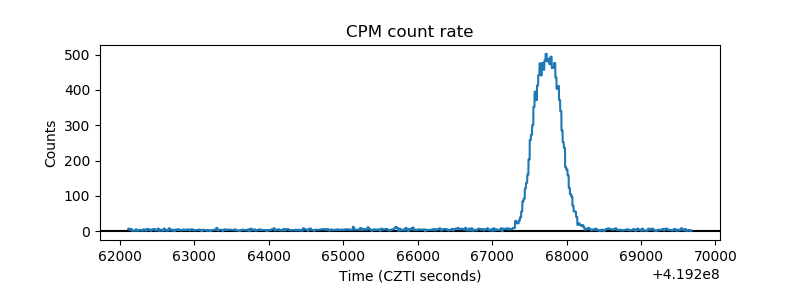 |
| CZT Counter | 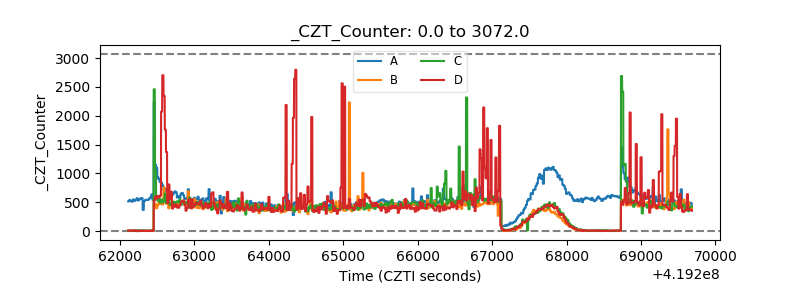 |
| +2.5 Volts monitor | 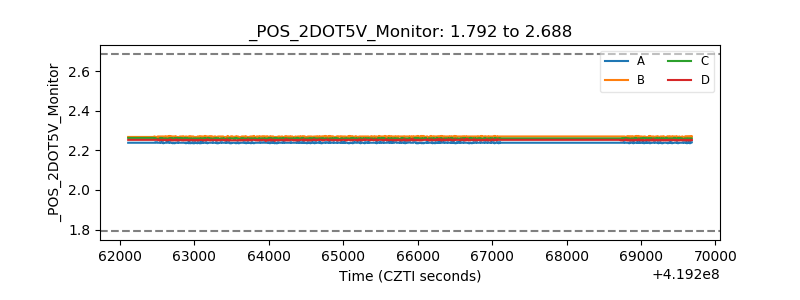 |
| +5 Volts monitor |  |
| _ROLL_ROT | 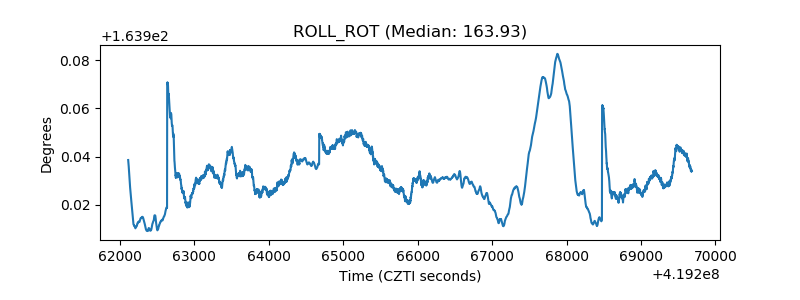 |
| _Roll_DEC | 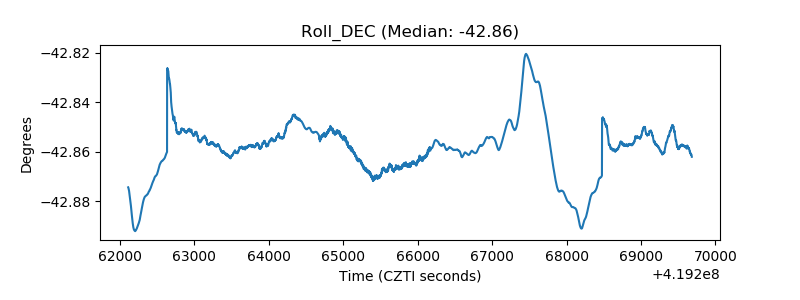 |
| _Roll_RA | 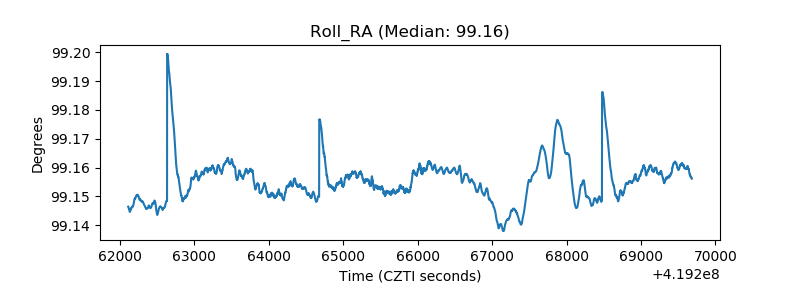 |
| Veto Counter | 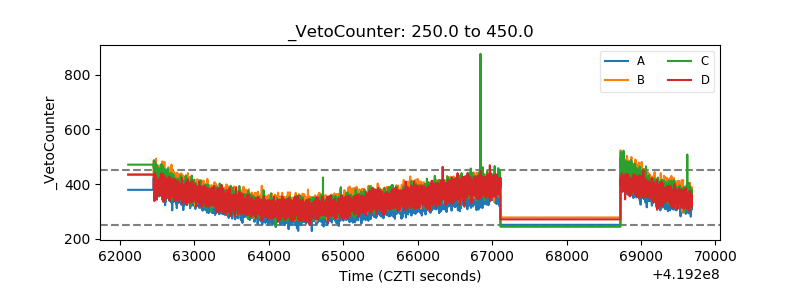 |