| Param | Original file | Final file |
|---|---|---|
| Filename | modeM0/AS1A12_099T03_9000005570_40806cztM0_level2.fits | modeM0/AS1A12_099T03_9000005570_40806cztM0_level2_quad_clean.evt |
| Size (bytes) | 295,859,520 | 88,162,560 |
| Size | 282.2 MB | 84.1 MB |
| Events in quadrant A | 2,773,362 | 596,032 |
| Events in quadrant B | 2,364,436 | 618,302 |
| Events in quadrant C | 2,635,530 | 568,376 |
| Events in quadrant D | 2,776,738 | 525,984 |
| Mode M0 | |||
|---|---|---|---|
| Quadrant | BADHDUFLAG | Total packets | Discarded packets |
| A | 0 | 11372 | 3 |
| B | 0 | 10460 | 2 |
| C | 0 | 11061 | 2 |
| D | 0 | 12007 | 2 |
| Mode SS | |||
|---|---|---|---|
| Quadrant | BADHDUFLAG | Total packets | Discarded packets |
| A | 0 | 106 | 0 |
| B | 0 | 106 | 0 |
| C | 0 | 106 | 0 |
| D | 0 | 106 | 0 |
| Mode M9 | |||
|---|---|---|---|
| Quadrant | BADHDUFLAG | Total packets | Discarded packets |
| A | 0 | 27 | 0 |
| B | 0 | 27 | 0 |
| C | 0 | 27 | 0 |
| D | 0 | 28 | 0 |
| Quadrant | Total seconds | Saturated seconds | Saturation percentage |
|---|---|---|---|
| A | 5149 | 18 | 0.349582% |
| B | 5149 | 9 | 0.174791% |
| C | 5149 | 64 | 1.242960% |
| D | 5149 | 64 | 1.242960% |
Noise dominated data is calculated using 1-second bins in cleaned event files. If a bin has >2000 counts, and if more than 50% of those come from <1% of pixels, then it is considered to be noise-dominated and hence unusable.
| Quadrant | # 1 sec bins | Bins with >0 counts | Bins with >2000 counts | High rate bins dominated by noise | Noise dominated (total time) | Noise dominated (detector-on time) | Marked lightcurve |
|---|---|---|---|---|---|---|---|
| A | 7032 | 5150 | 6 | 6 | 0.09% | 0.12% | 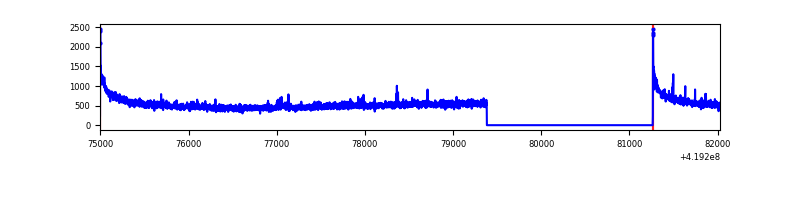 |
| B | 7032 | 5150 | 5 | 5 | 0.07% | 0.10% | 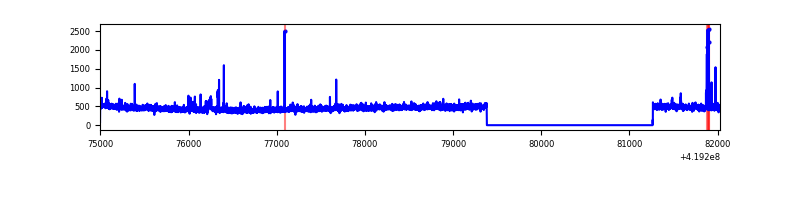 |
| C | 7032 | 5150 | 69 | 69 | 0.98% | 1.34% | 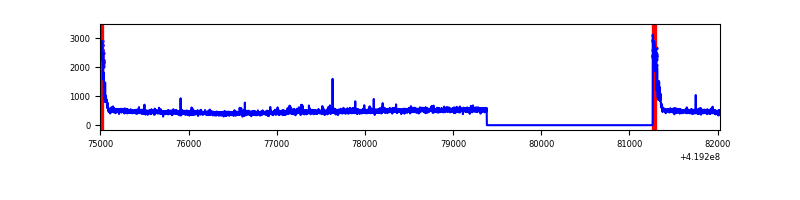 |
| D | 7032 | 5150 | 72 | 72 | 1.02% | 1.40% | 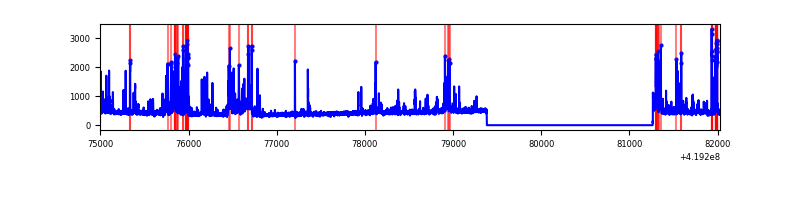 |
Top three noisy pixels from each quadrant. If the there are fewer than three noisy pixels in the level2.evt file, extra rows are filled as -1
| Pixel properties | Quadrant properties | ||||||
|---|---|---|---|---|---|---|---|
| Quadrant | DetID | PixID | Counts | Sigma | Mean | Median | Sigma |
| A | 10 | 83 | 503645 | 4251.37 | 576 | 564 | 118.3 |
| A | 2 | 79 | 24790 | 204.73 | 576 | 564 | 118.3 |
| A | 15 | 191 | 12939 | 104.58 | 576 | 564 | 118.3 |
| B | 5 | 255 | 45666 | 406.87 | 577 | 563 | 110.9 |
| B | 0 | 190 | 14262 | 123.58 | 577 | 563 | 110.9 |
| B | 12 | 111 | 13934 | 120.62 | 577 | 563 | 110.9 |
| C | 0 | 10 | 226661 | 1745.59 | 552 | 556 | 129.5 |
| C | 15 | 214 | 218471 | 1682.36 | 552 | 556 | 129.5 |
| C | 14 | 254 | 26419 | 199.67 | 552 | 556 | 129.5 |
| D | 2 | 153 | 249488 | 1841.61 | 549 | 533 | 135.2 |
| D | 2 | 249 | 116851 | 860.45 | 549 | 533 | 135.2 |
| D | 12 | 238 | 97619 | 718.18 | 549 | 533 | 135.2 |
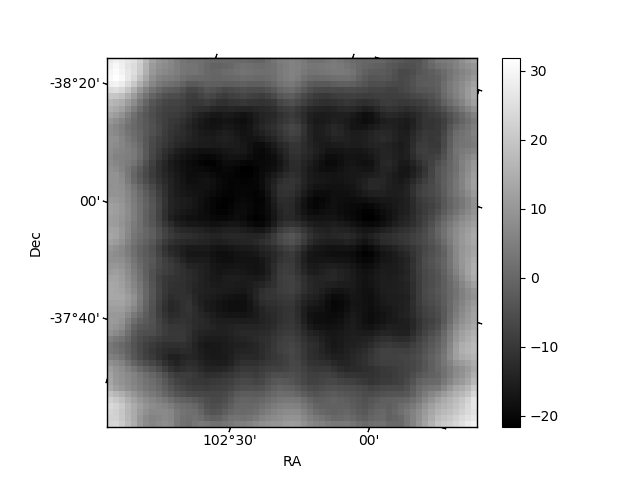
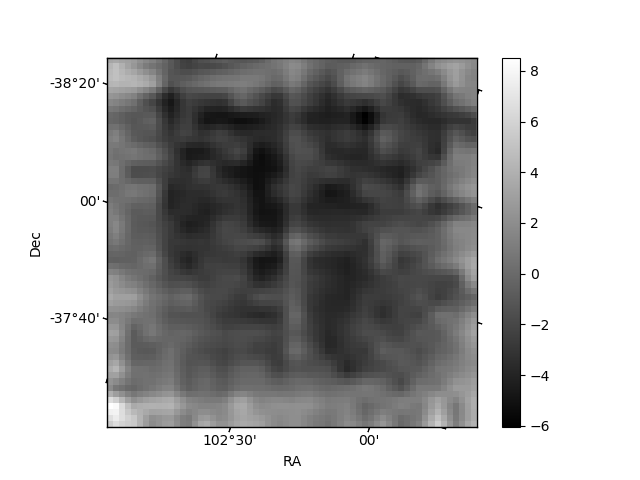
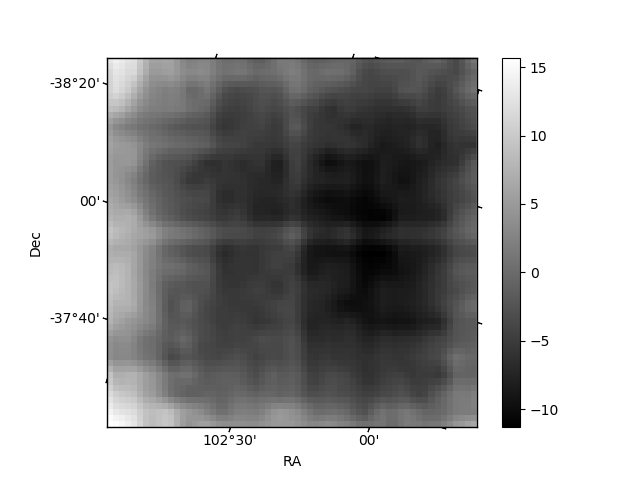
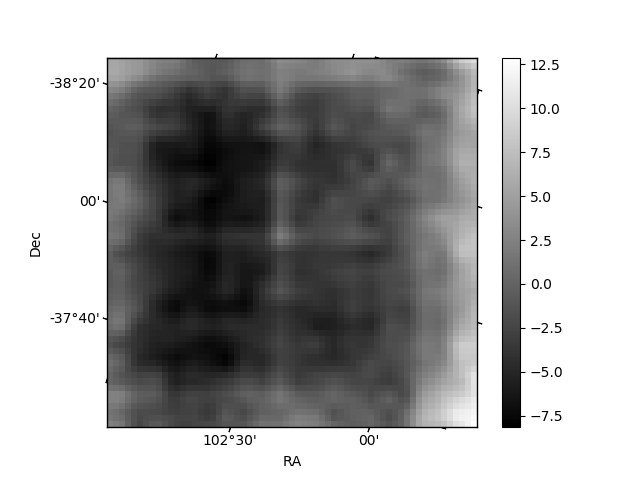
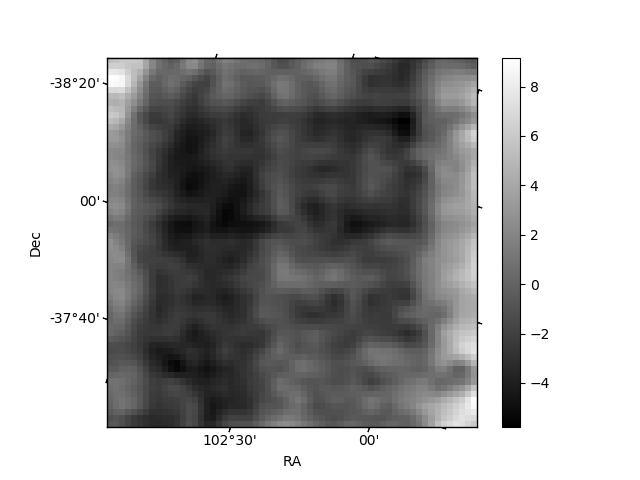
Histogram calculated using DETX and DETY for each event in the final _common_clean file
| Quadrant A | 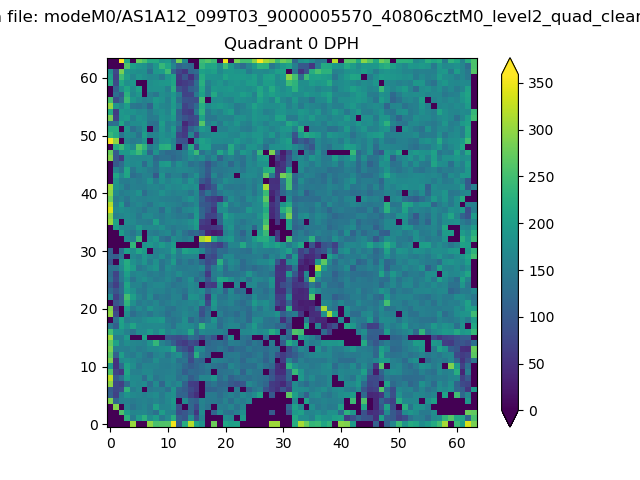 |
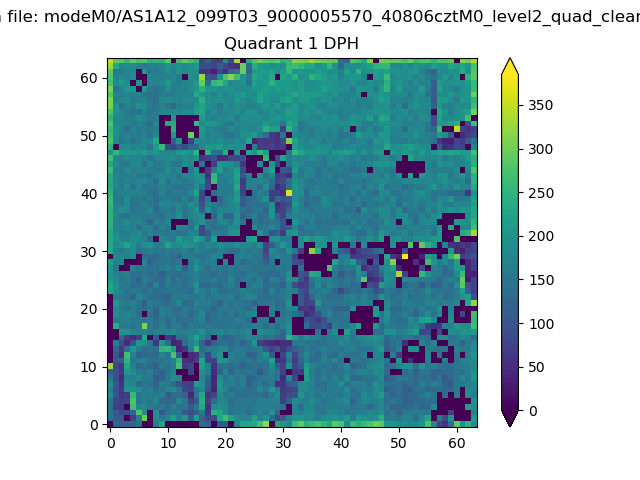 |
Quadrant B |
|---|---|---|---|
| Quadrant D | 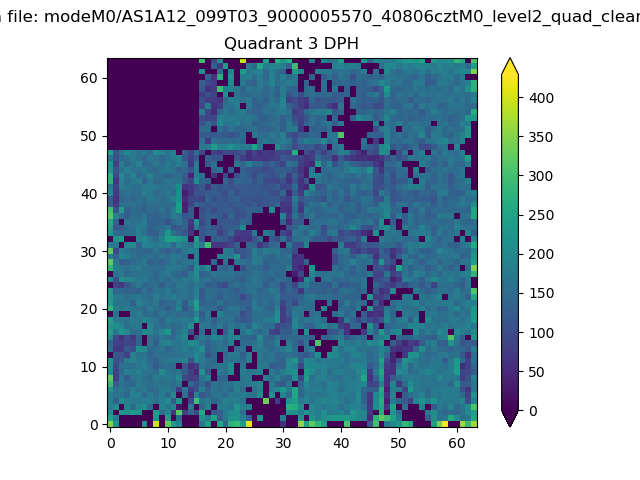 |
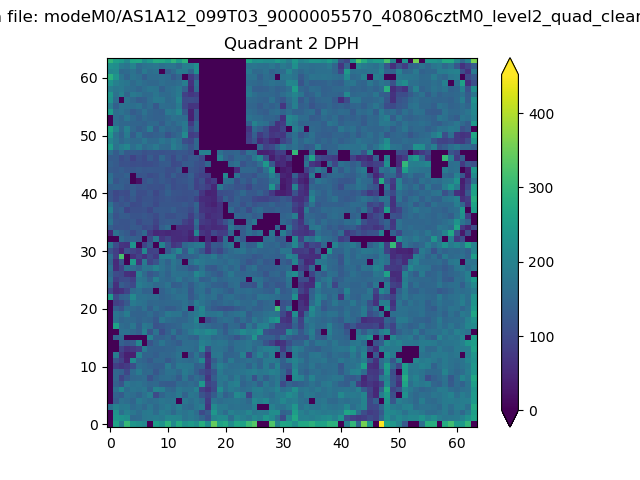 |
Quadrant C |
| Plot type | Count rate plots | Images |
|---|---|---|
| Comparison with Poisson distribution Blue bars denote a histogram of data divided into 1 sec bins. Red curve is a Poisson curve with rate = median count rate of data. |
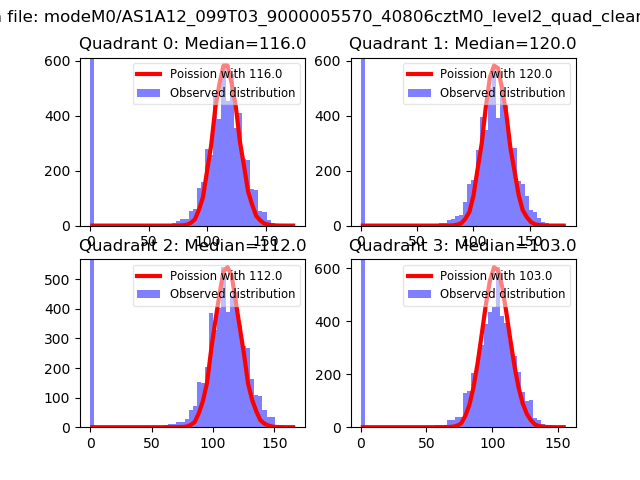 |
 |
| Quadrant-wise count rates Data is divided into 100 sec bins |
 |
|
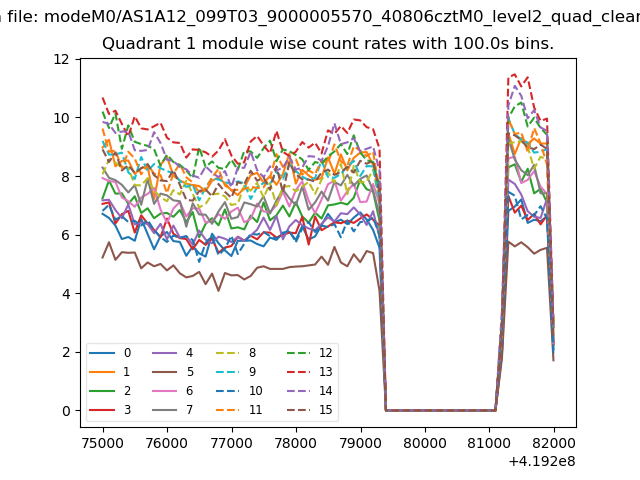
| Module-wise count rates for Quadrant A Data is divided into 100 sec bins |
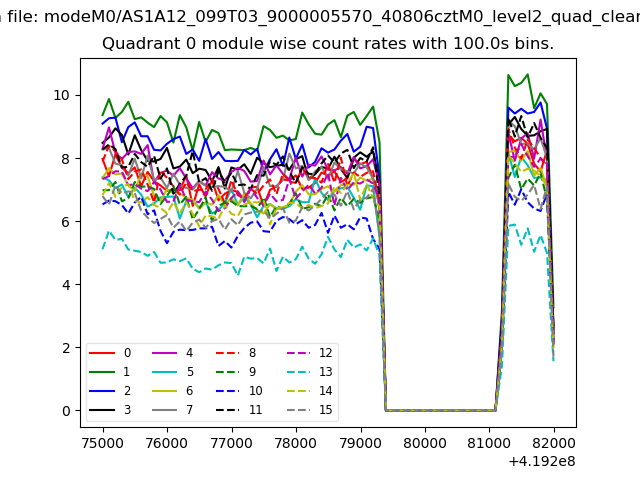 |
 |
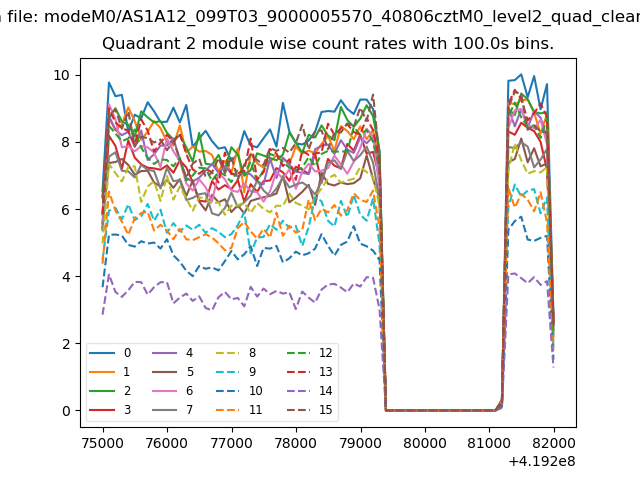
| Module-wise count rates for Quadrant B Data is divided into 100 sec bins |
 |
 |
| Module-wise count rates for Quadrant C Data is divided into 100 sec bins |
 |
 |
| Module-wise count rates for Quadrant D Data is divided into 100 sec bins |
 |
 |
| Parameter | Plot |
|---|---|
| CZT HV Monitor | 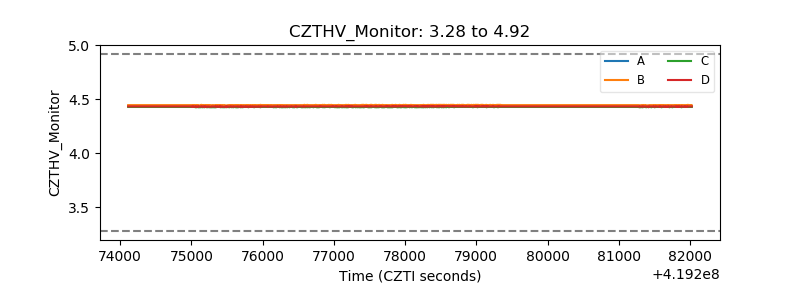 |
| D_VDD | 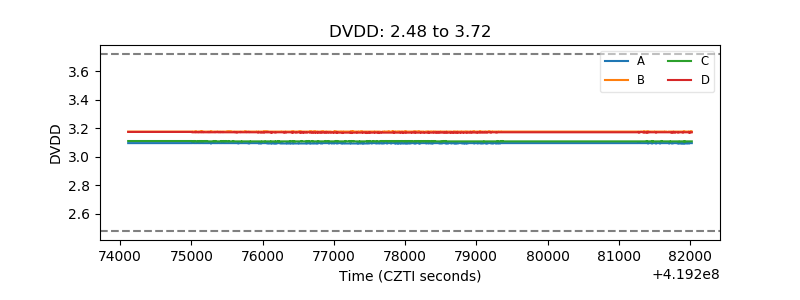 |
| Temperature 1 | 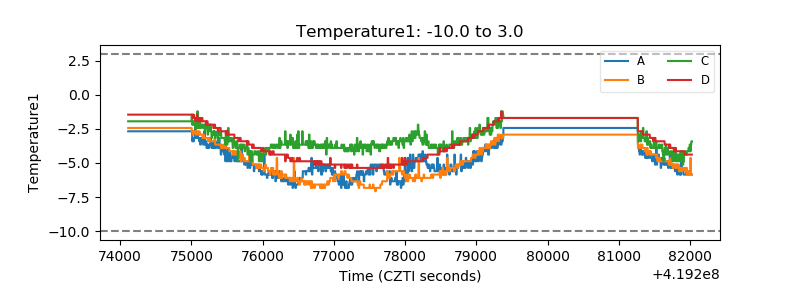 |
| Veto HV Monitor | 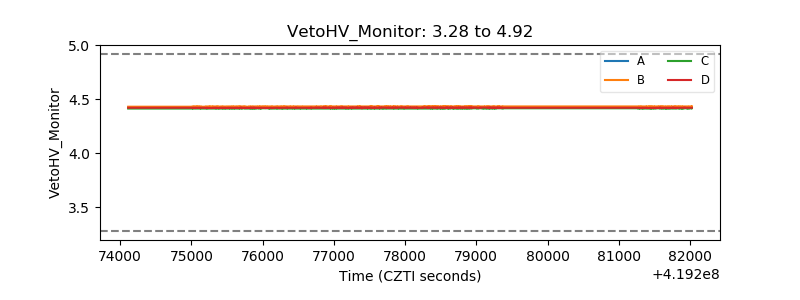 |
| Veto LLD | 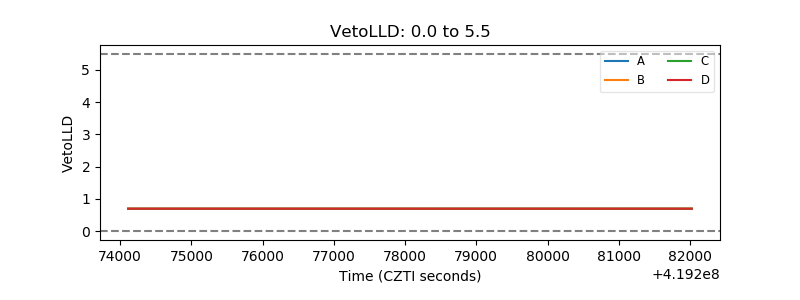 |
| Alpha Counter |  |
| _CPM_Rate |  |
| CZT Counter |  |
| +2.5 Volts monitor | 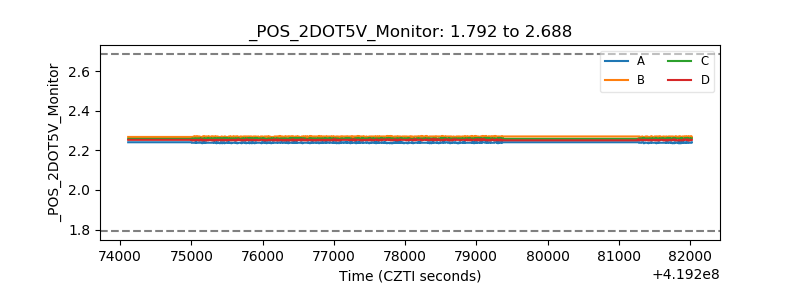 |
| +5 Volts monitor |  |
| _ROLL_ROT | 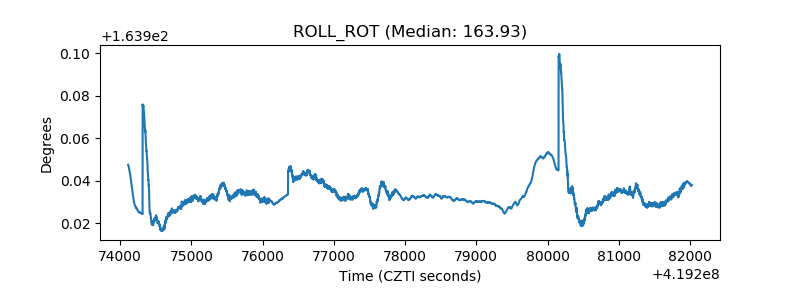 |
| _Roll_DEC | 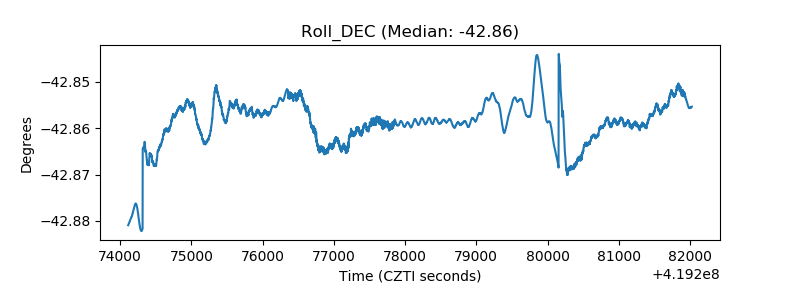 |
| _Roll_RA | 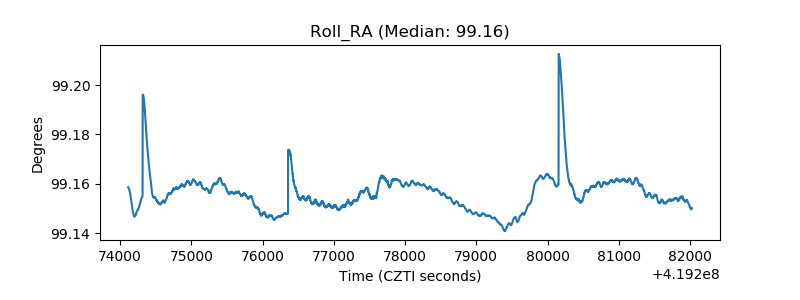 |
| Veto Counter | 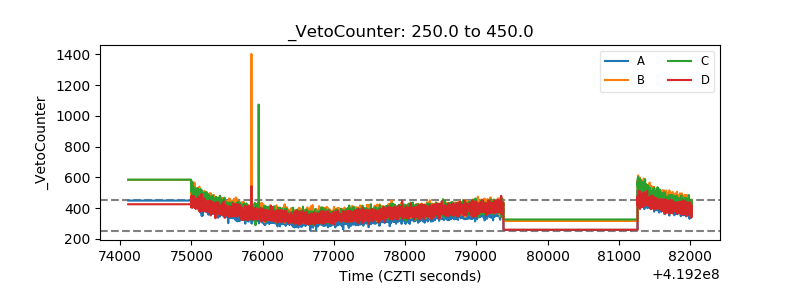 |