| Param | Original file | Final file |
|---|---|---|
| Filename | modeM0/AS1A12_099T03_9000005570_40809cztM0_level2.fits | modeM0/AS1A12_099T03_9000005570_40809cztM0_level2_quad_clean.evt |
| Size (bytes) | 291,559,680 | 88,004,160 |
| Size | 278.1 MB | 83.9 MB |
| Events in quadrant A | 2,831,042 | 598,793 |
| Events in quadrant B | 2,455,060 | 622,647 |
| Events in quadrant C | 2,589,240 | 574,397 |
| Events in quadrant D | 2,531,665 | 522,321 |
| Mode M0 | |||
|---|---|---|---|
| Quadrant | BADHDUFLAG | Total packets | Discarded packets |
| A | 0 | 11286 | 3 |
| B | 0 | 10388 | 2 |
| C | 0 | 10552 | 2 |
| D | 0 | 11083 | 2 |
| Mode SS | |||
|---|---|---|---|
| Quadrant | BADHDUFLAG | Total packets | Discarded packets |
| A | 0 | 102 | 0 |
| B | 0 | 102 | 0 |
| C | 0 | 102 | 0 |
| D | 0 | 102 | 0 |
| Mode M9 | |||
|---|---|---|---|
| Quadrant | BADHDUFLAG | Total packets | Discarded packets |
| A | 0 | 39 | 0 |
| B | 0 | 39 | 0 |
| C | 0 | 39 | 0 |
| D | 0 | 40 | 0 |
| Quadrant | Total seconds | Saturated seconds | Saturation percentage |
|---|---|---|---|
| A | 4941 | 33 | 0.667881% |
| B | 4941 | 27 | 0.546448% |
| C | 4941 | 41 | 0.829792% |
| D | 4941 | 82 | 1.659583% |
Noise dominated data is calculated using 1-second bins in cleaned event files. If a bin has >2000 counts, and if more than 50% of those come from <1% of pixels, then it is considered to be noise-dominated and hence unusable.
| Quadrant | # 1 sec bins | Bins with >0 counts | Bins with >2000 counts | High rate bins dominated by noise | Noise dominated (total time) | Noise dominated (detector-on time) | Marked lightcurve |
|---|---|---|---|---|---|---|---|
| A | 7065 | 4942 | 22 | 22 | 0.31% | 0.45% | 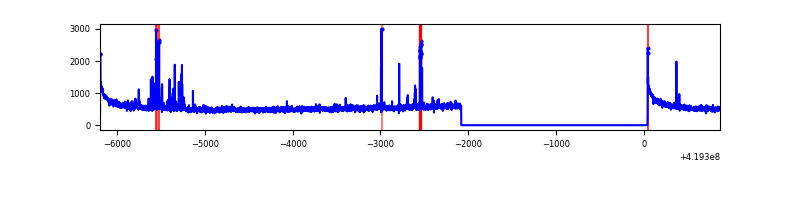 |
| B | 7065 | 4942 | 10 | 10 | 0.14% | 0.20% | 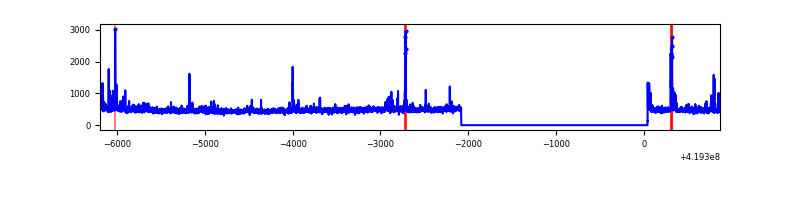 |
| C | 7065 | 4942 | 43 | 43 | 0.61% | 0.87% | 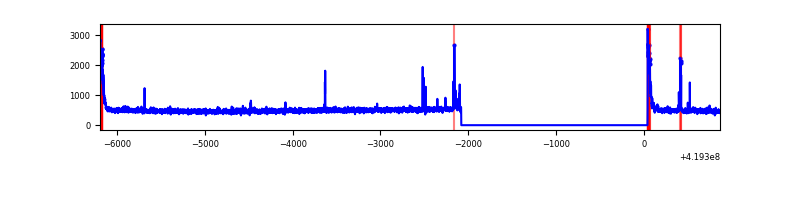 |
| D | 7065 | 4942 | 58 | 58 | 0.82% | 1.17% | 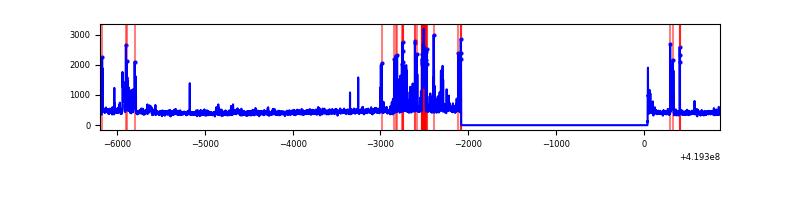 |
Top three noisy pixels from each quadrant. If the there are fewer than three noisy pixels in the level2.evt file, extra rows are filled as -1
| Pixel properties | Quadrant properties | ||||||
|---|---|---|---|---|---|---|---|
| Quadrant | DetID | PixID | Counts | Sigma | Mean | Median | Sigma |
| A | 10 | 83 | 474401 | 4047.53 | 572 | 562 | 117.1 |
| A | 13 | 248 | 90602 | 769.12 | 572 | 562 | 117.1 |
| A | 2 | 79 | 48214 | 407.04 | 572 | 562 | 117.1 |
| B | 5 | 255 | 116612 | 1069.69 | 573 | 561 | 108.5 |
| B | 4 | 171 | 60262 | 550.29 | 573 | 561 | 108.5 |
| B | 0 | 190 | 15209 | 135.02 | 573 | 561 | 108.5 |
| C | 15 | 214 | 213083 | 1646.06 | 557 | 559 | 129.1 |
| C | 0 | 10 | 143715 | 1108.79 | 557 | 559 | 129.1 |
| C | 14 | 254 | 56105 | 430.22 | 557 | 559 | 129.1 |
| D | 2 | 249 | 149101 | 1102.41 | 550 | 535 | 134.8 |
| D | 2 | 153 | 121516 | 897.72 | 550 | 535 | 134.8 |
| D | 13 | 249 | 65793 | 484.24 | 550 | 535 | 134.8 |
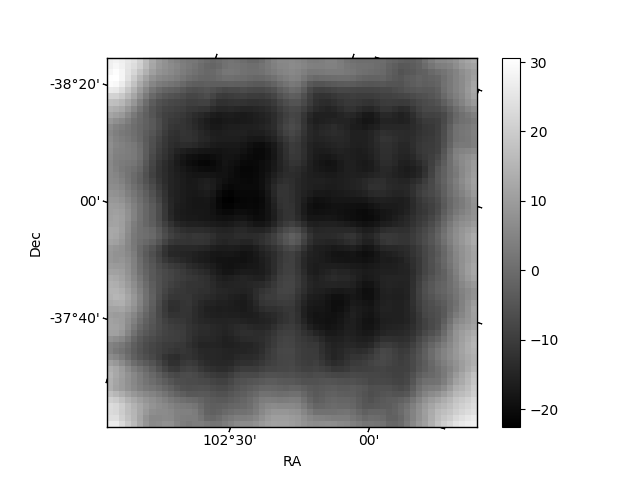
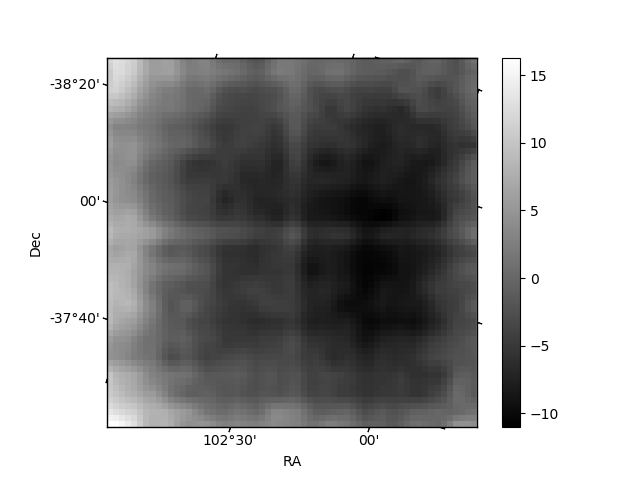
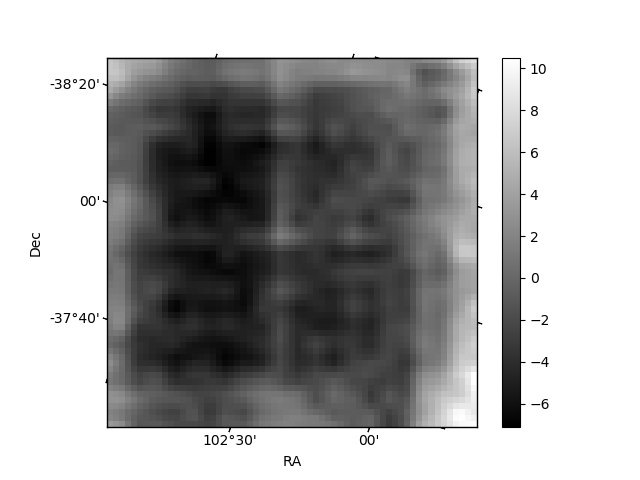
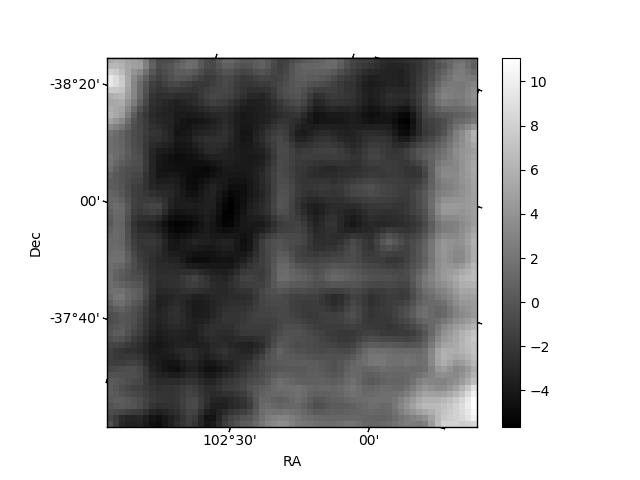
Histogram calculated using DETX and DETY for each event in the final _common_clean file
| Quadrant A | 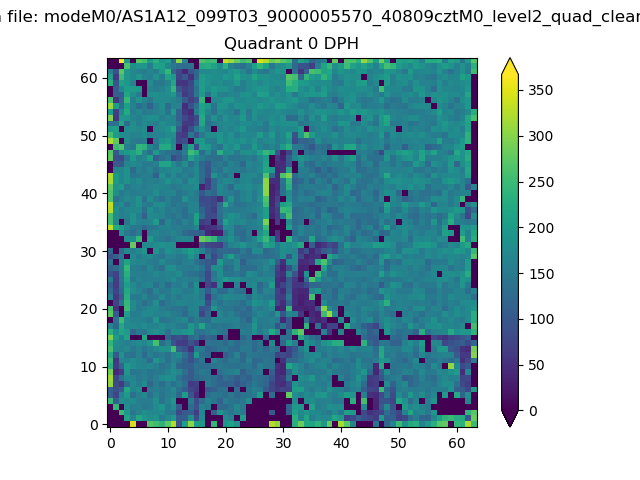 |
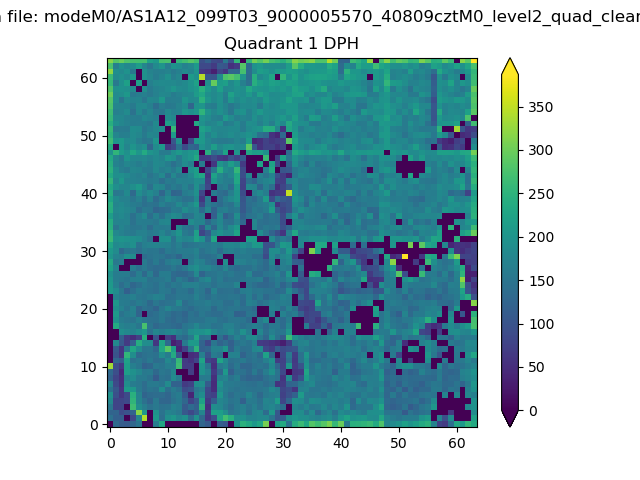 |
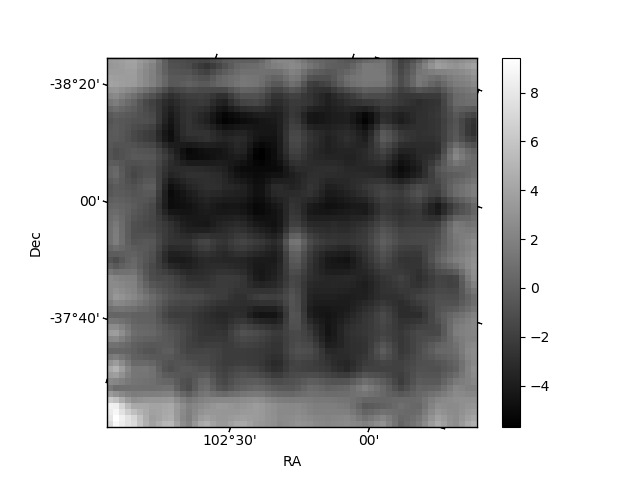
Quadrant B |
|---|---|---|---|
| Quadrant D | 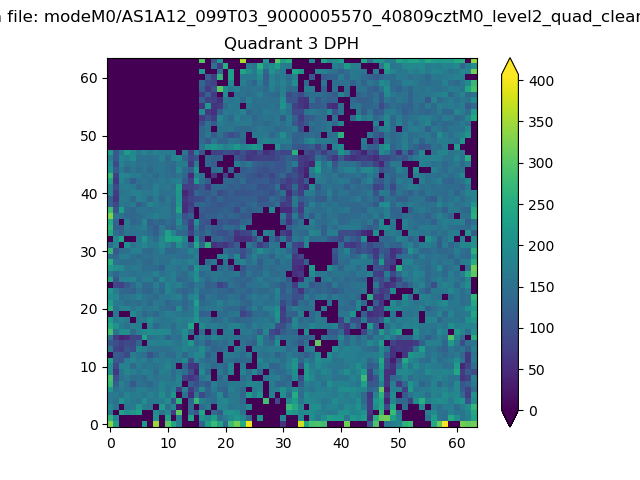 |
 |
Quadrant C |
| Plot type | Count rate plots | Images |
|---|---|---|
| Comparison with Poisson distribution Blue bars denote a histogram of data divided into 1 sec bins. Red curve is a Poisson curve with rate = median count rate of data. |
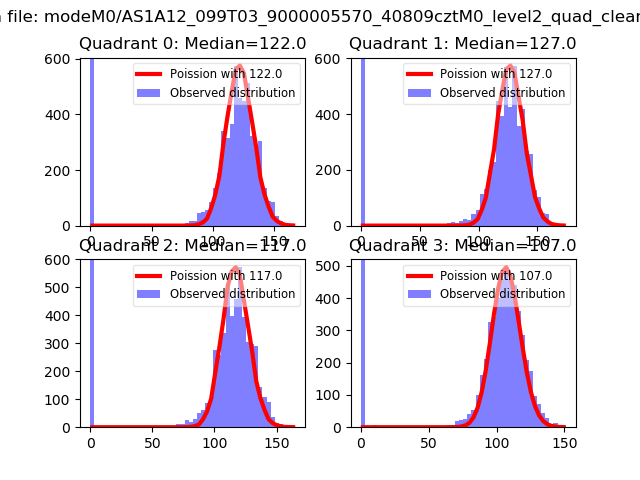 |
 |
| Quadrant-wise count rates Data is divided into 100 sec bins |
 |
|
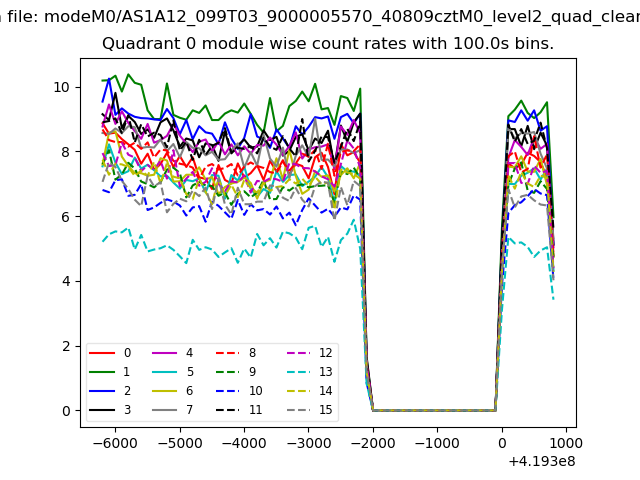
| Module-wise count rates for Quadrant A Data is divided into 100 sec bins |
 |
 |
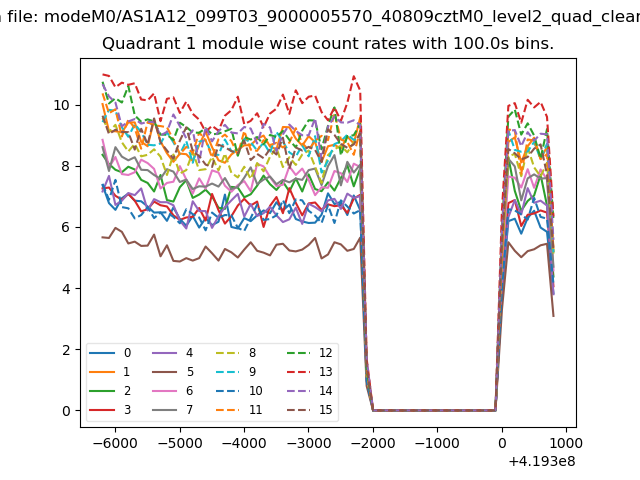
| Module-wise count rates for Quadrant B Data is divided into 100 sec bins |
 |
 |
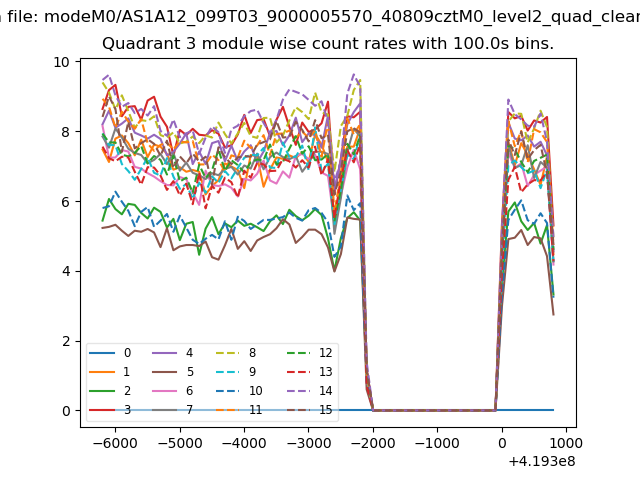
| Module-wise count rates for Quadrant C Data is divided into 100 sec bins |
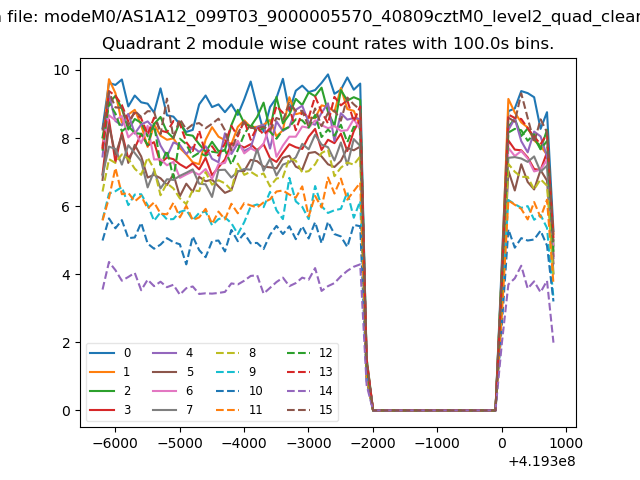 |
 |
| Module-wise count rates for Quadrant D Data is divided into 100 sec bins |
 |
 |
| Parameter | Plot |
|---|---|
| CZT HV Monitor | 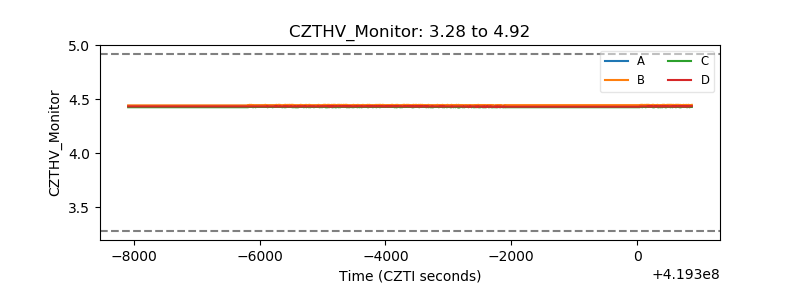 |
| D_VDD | 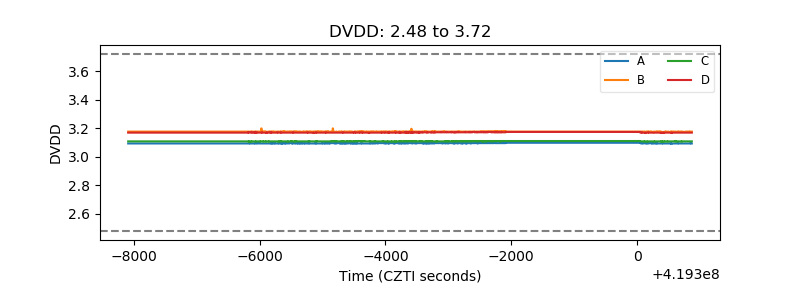 |
| Temperature 1 | 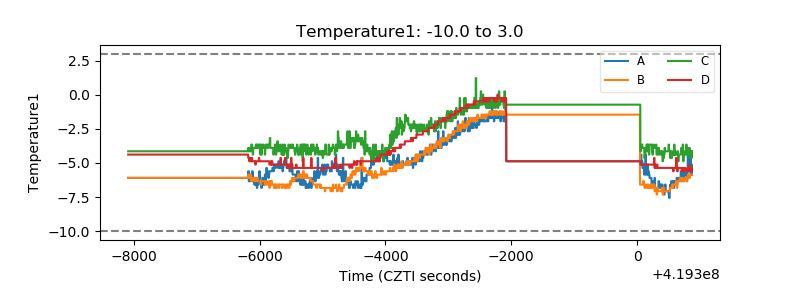 |
| Veto HV Monitor | 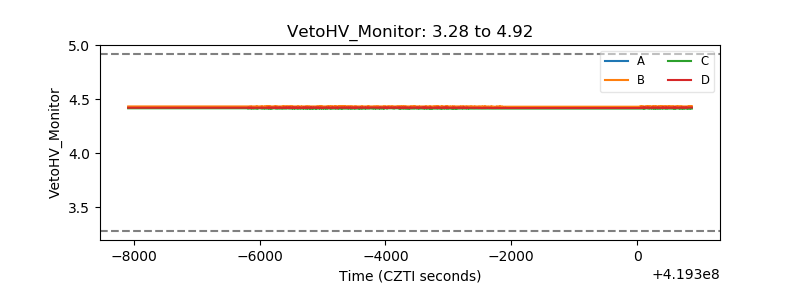 |
| Veto LLD | 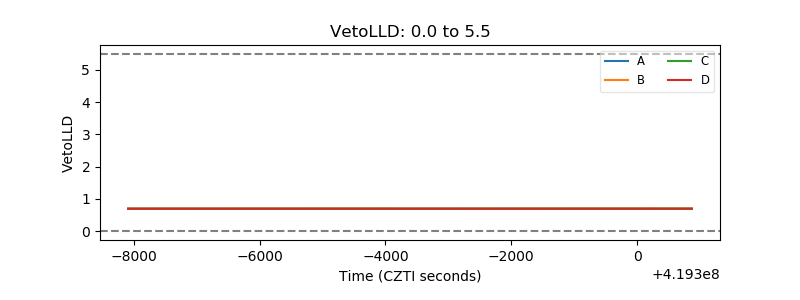 |
| Alpha Counter |  |
| _CPM_Rate | 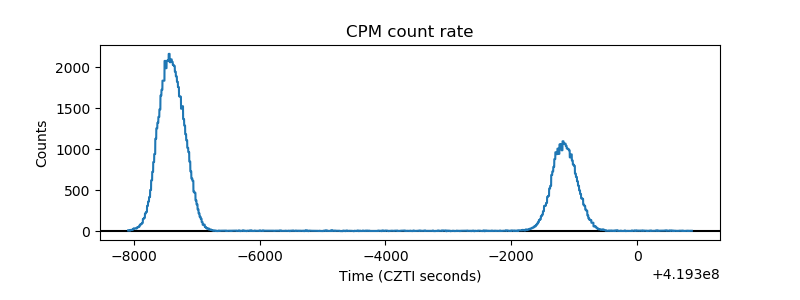 |
| CZT Counter | 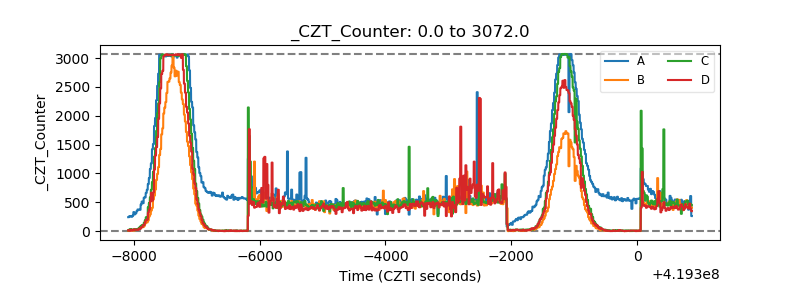 |
| +2.5 Volts monitor | 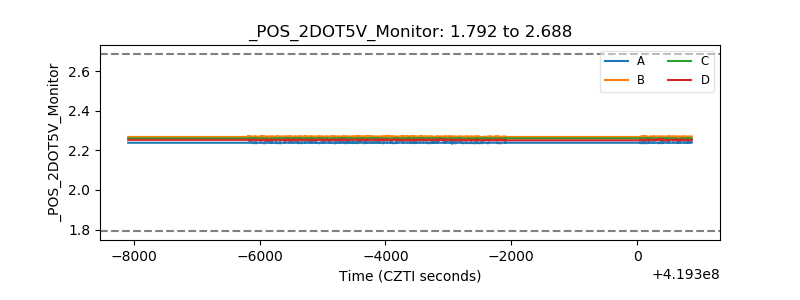 |
| +5 Volts monitor |  |
| _ROLL_ROT | 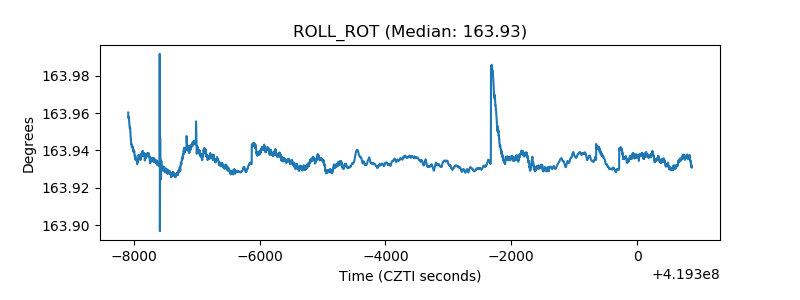 |
| _Roll_DEC | 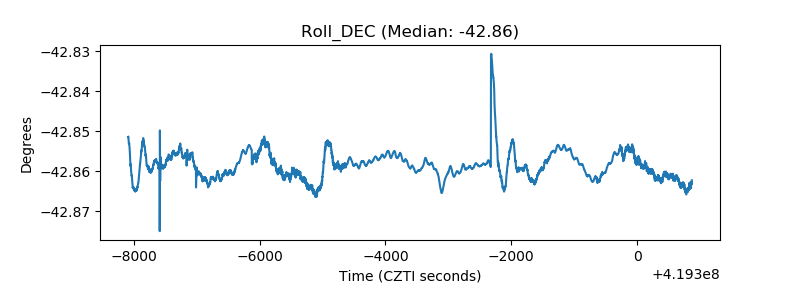 |
| _Roll_RA | 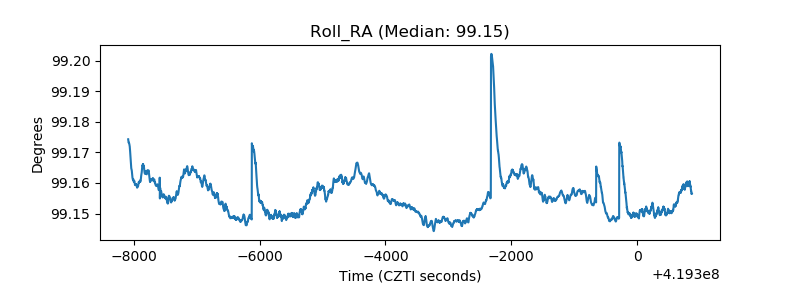 |
| Veto Counter | 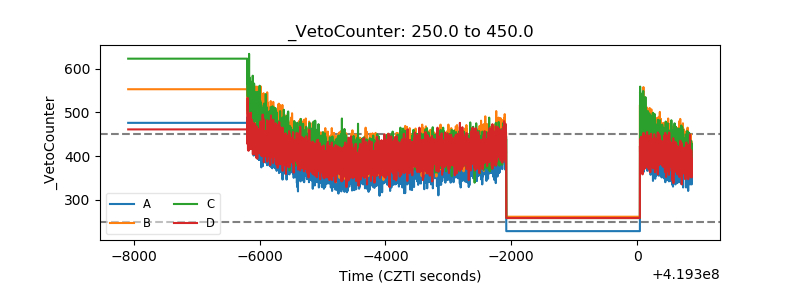 |