| Param | Original file | Final file |
|---|---|---|
| Filename | modeM0/AS1A12_099T03_9000005570_40810cztM0_level2.fits | modeM0/AS1A12_099T03_9000005570_40810cztM0_level2_quad_clean.evt |
| Size (bytes) | 304,007,040 | 90,126,720 |
| Size | 289.9 MB | 86.0 MB |
| Events in quadrant A | 2,891,094 | 607,802 |
| Events in quadrant B | 2,600,125 | 632,148 |
| Events in quadrant C | 2,650,196 | 585,240 |
| Events in quadrant D | 2,703,608 | 537,278 |
| Mode M0 | |||
|---|---|---|---|
| Quadrant | BADHDUFLAG | Total packets | Discarded packets |
| A | 0 | 11578 | 3 |
| B | 0 | 11121 | 2 |
| C | 0 | 10989 | 2 |
| D | 0 | 11819 | 2 |
| Mode SS | |||
|---|---|---|---|
| Quadrant | BADHDUFLAG | Total packets | Discarded packets |
| A | 0 | 106 | 0 |
| B | 0 | 106 | 0 |
| C | 0 | 106 | 0 |
| D | 0 | 106 | 0 |
| Mode M9 | |||
|---|---|---|---|
| Quadrant | BADHDUFLAG | Total packets | Discarded packets |
| A | 0 | 36 | 0 |
| B | 0 | 36 | 0 |
| C | 0 | 36 | 0 |
| D | 0 | 37 | 0 |
| Quadrant | Total seconds | Saturated seconds | Saturation percentage |
|---|---|---|---|
| A | 5237 | 16 | 0.305518% |
| B | 5237 | 20 | 0.381898% |
| C | 5237 | 30 | 0.572847% |
| D | 5237 | 51 | 0.973840% |
Noise dominated data is calculated using 1-second bins in cleaned event files. If a bin has >2000 counts, and if more than 50% of those come from <1% of pixels, then it is considered to be noise-dominated and hence unusable.
| Quadrant | # 1 sec bins | Bins with >0 counts | Bins with >2000 counts | High rate bins dominated by noise | Noise dominated (total time) | Noise dominated (detector-on time) | Marked lightcurve |
|---|---|---|---|---|---|---|---|
| A | 7330 | 5238 | 5 | 5 | 0.07% | 0.10% | 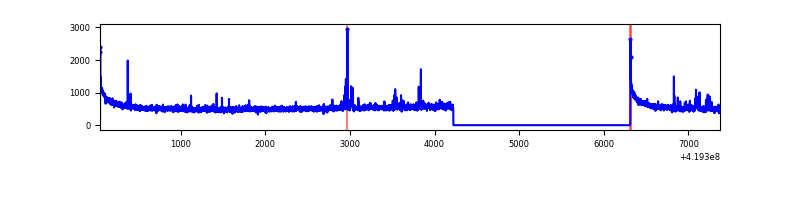 |
| B | 7330 | 5238 | 9 | 9 | 0.12% | 0.17% | 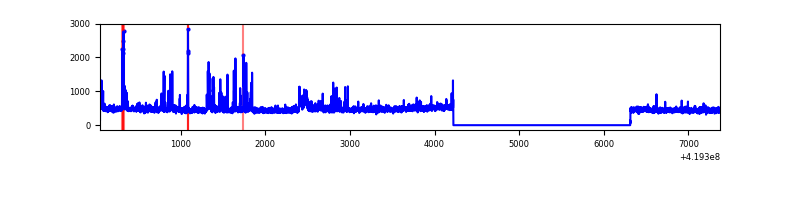 |
| C | 7330 | 5238 | 28 | 28 | 0.38% | 0.53% | 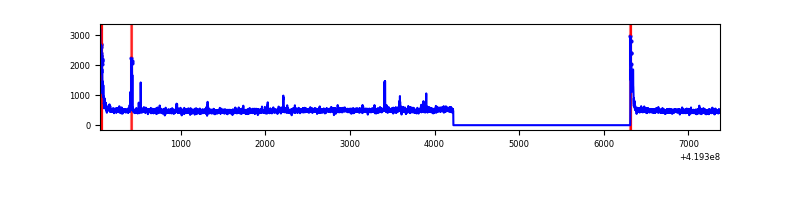 |
| D | 7330 | 5238 | 44 | 44 | 0.60% | 0.84% | 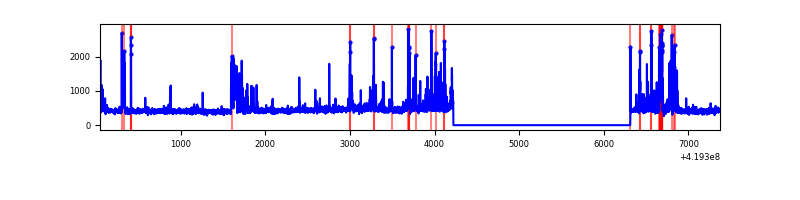 |
Top three noisy pixels from each quadrant. If the there are fewer than three noisy pixels in the level2.evt file, extra rows are filled as -1
| Pixel properties | Quadrant properties | ||||||
|---|---|---|---|---|---|---|---|
| Quadrant | DetID | PixID | Counts | Sigma | Mean | Median | Sigma |
| A | 10 | 83 | 502192 | 4095.46 | 595 | 584 | 122.5 |
| A | 13 | 248 | 47260 | 381.09 | 595 | 584 | 122.5 |
| A | 2 | 79 | 24401 | 194.46 | 595 | 584 | 122.5 |
| B | 5 | 255 | 175220 | 1521.92 | 594 | 579 | 114.8 |
| B | 15 | 35 | 36375 | 311.95 | 594 | 579 | 114.8 |
| B | 0 | 190 | 18390 | 155.21 | 594 | 579 | 114.8 |
| C | 15 | 214 | 226364 | 1674.25 | 579 | 582 | 134.9 |
| C | 0 | 10 | 118700 | 875.88 | 579 | 582 | 134.9 |
| C | 14 | 254 | 41257 | 301.62 | 579 | 582 | 134.9 |
| D | 5 | 222 | 165811 | 1165.94 | 575 | 558 | 141.7 |
| D | 1 | 47 | 122663 | 861.51 | 575 | 558 | 141.7 |
| D | 2 | 249 | 58574 | 409.33 | 575 | 558 | 141.7 |
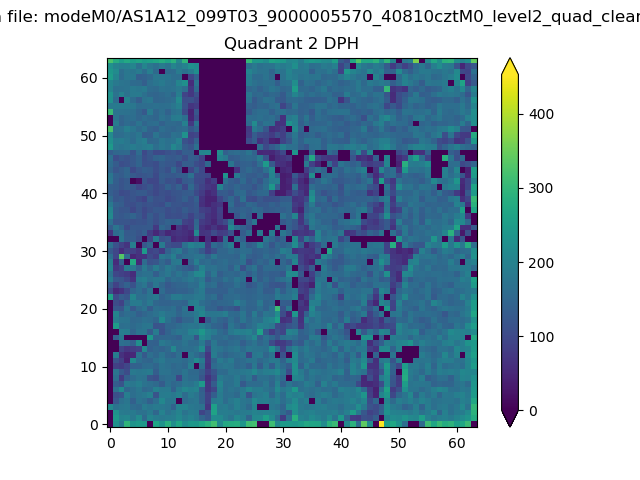
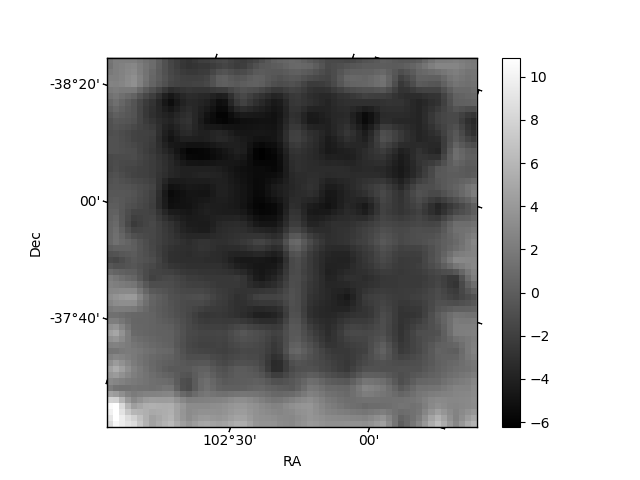
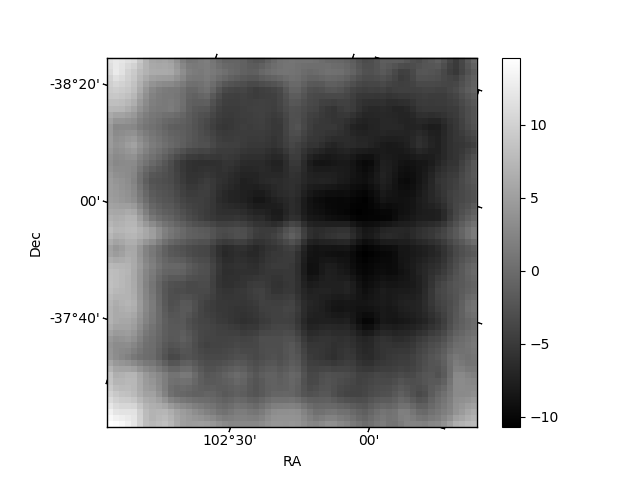
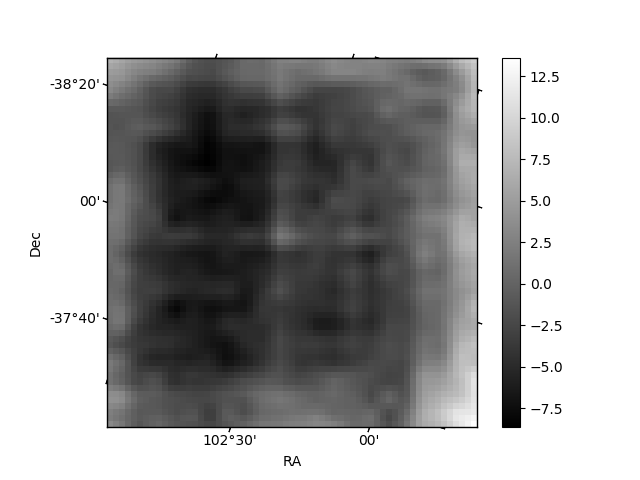
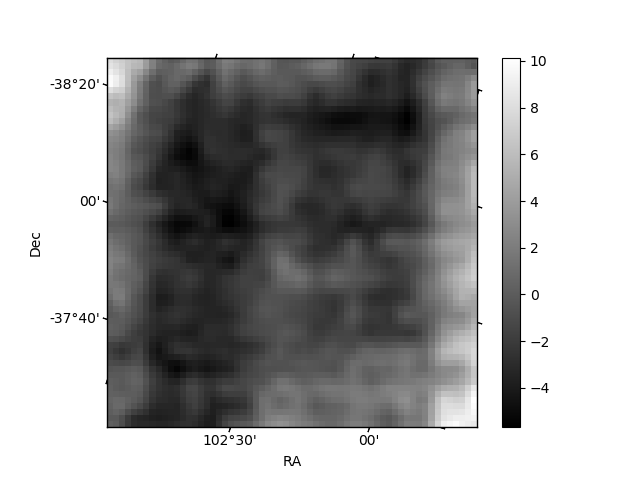
Histogram calculated using DETX and DETY for each event in the final _common_clean file
| Quadrant A | 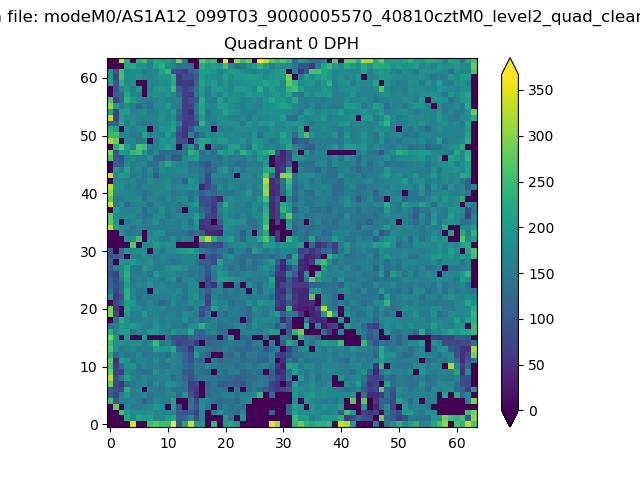 |
 |
Quadrant B |
|---|---|---|---|
| Quadrant D |  |
 |
Quadrant C |
| Plot type | Count rate plots | Images |
|---|---|---|
| Comparison with Poisson distribution Blue bars denote a histogram of data divided into 1 sec bins. Red curve is a Poisson curve with rate = median count rate of data. |
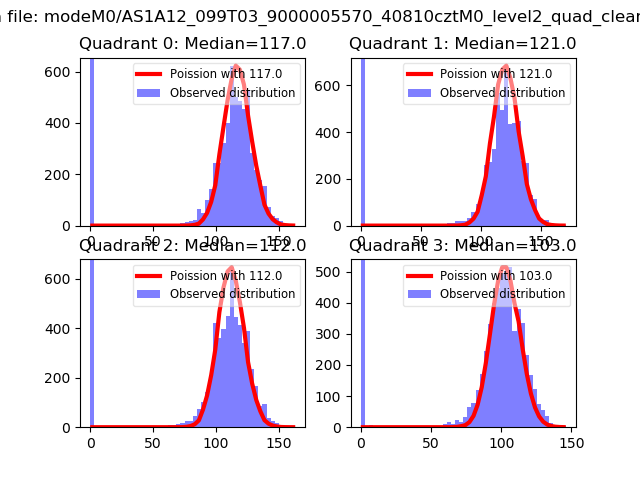 |
 |
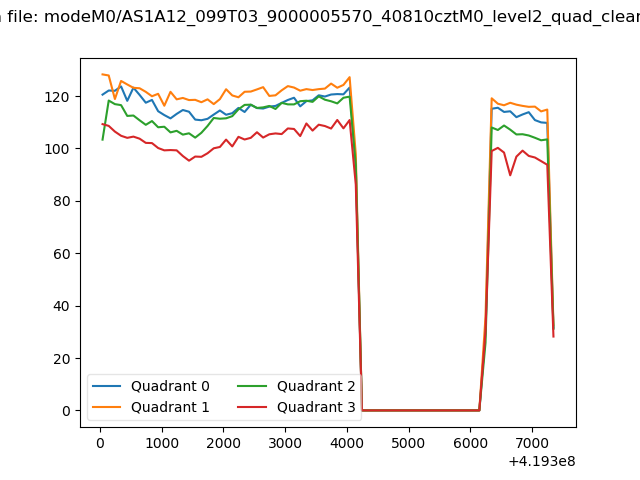
| Quadrant-wise count rates Data is divided into 100 sec bins |
 |
|
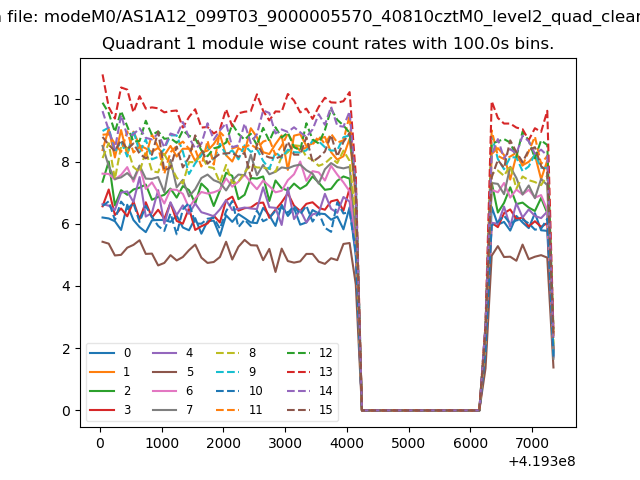
| Module-wise count rates for Quadrant A Data is divided into 100 sec bins |
 |
 |
| Module-wise count rates for Quadrant B Data is divided into 100 sec bins |
 |
 |
| Module-wise count rates for Quadrant C Data is divided into 100 sec bins |
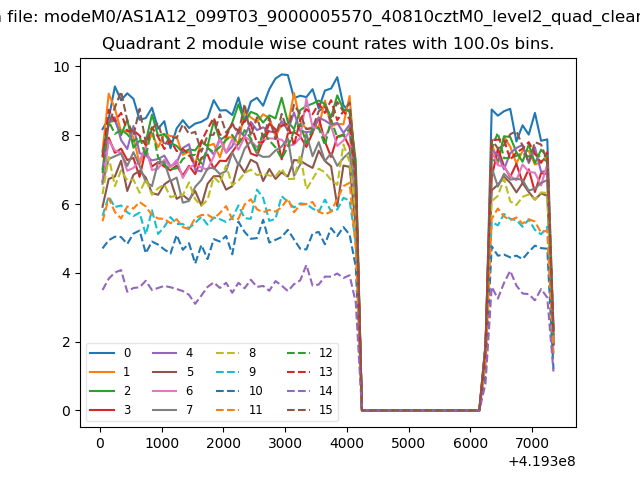 |
 |
| Module-wise count rates for Quadrant D Data is divided into 100 sec bins |
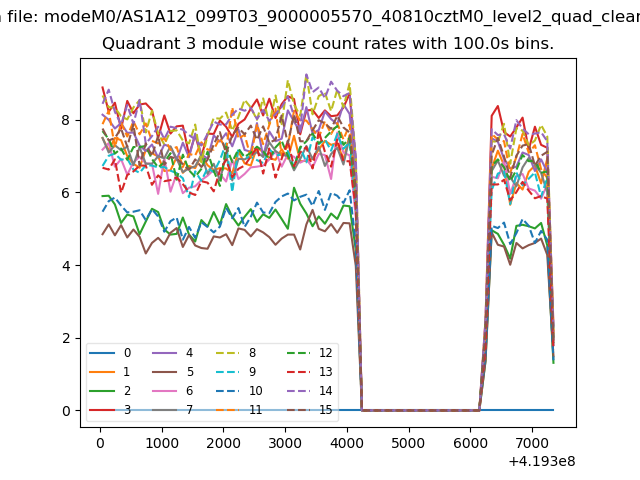 |
 |
| Parameter | Plot |
|---|---|
| CZT HV Monitor |  |
| D_VDD | 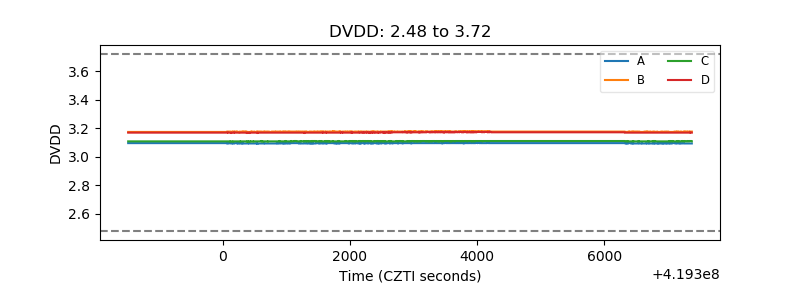 |
| Temperature 1 | 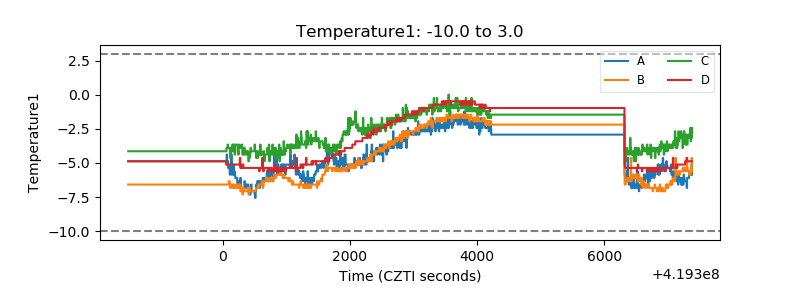 |
| Veto HV Monitor | 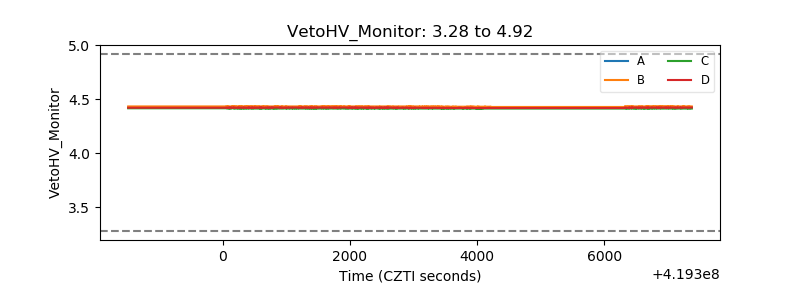 |
| Veto LLD | 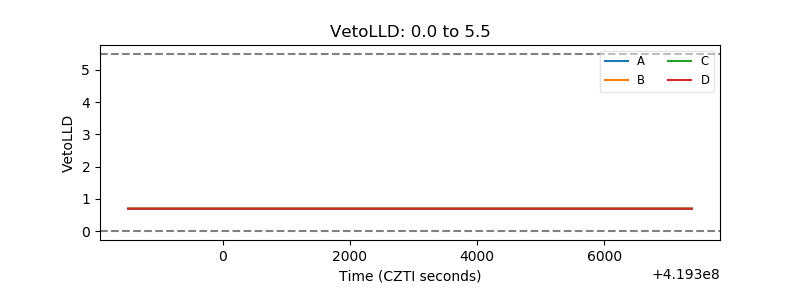 |
| Alpha Counter | 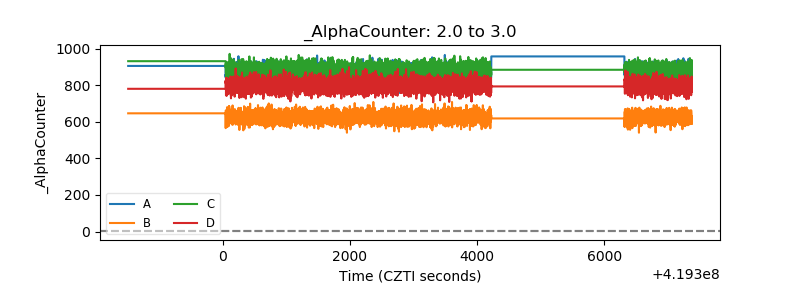 |
| _CPM_Rate | 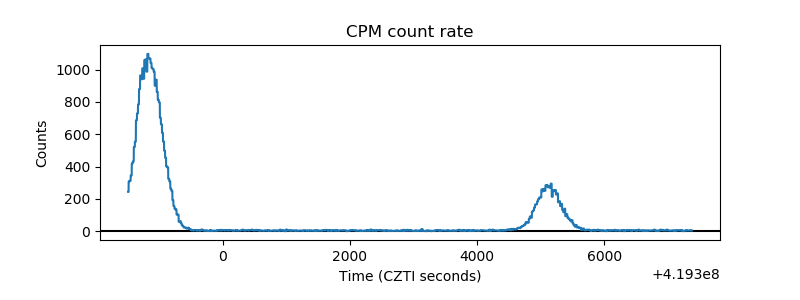 |
| CZT Counter | 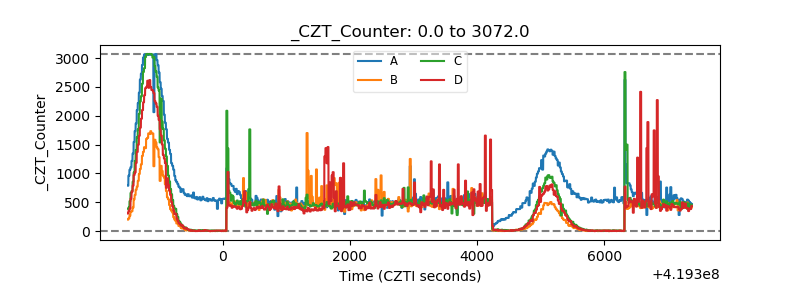 |
| +2.5 Volts monitor | 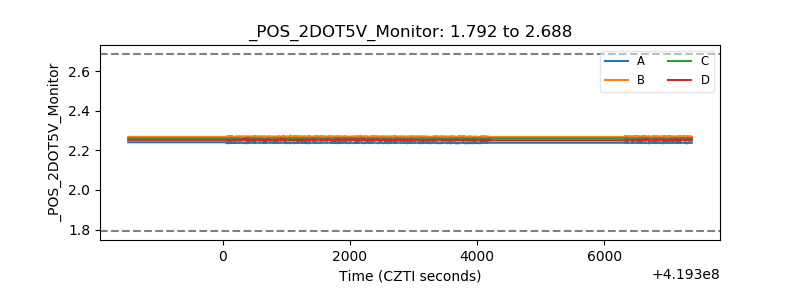 |
| +5 Volts monitor | 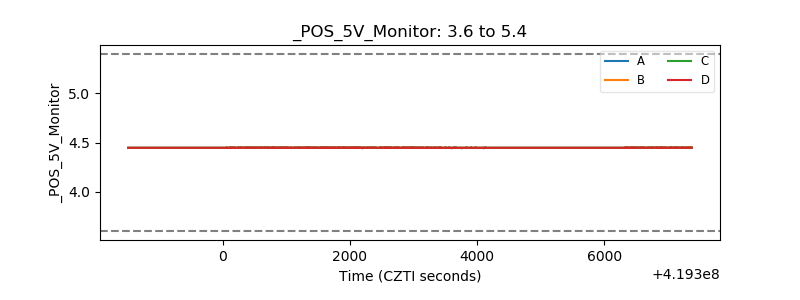 |
| _ROLL_ROT | 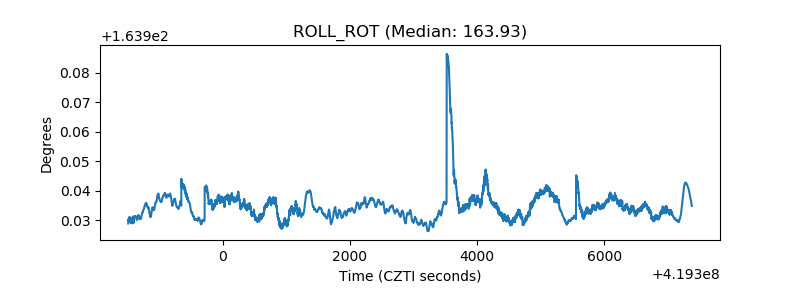 |
| _Roll_DEC | 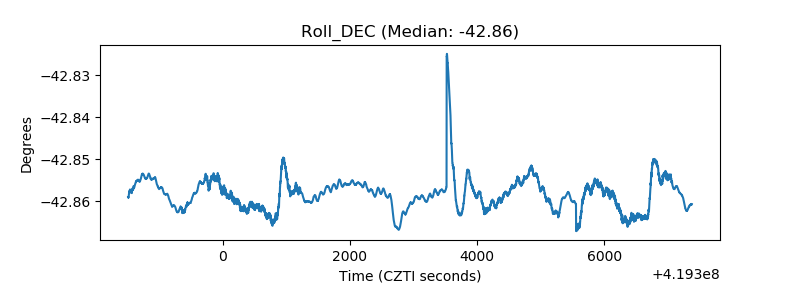 |
| _Roll_RA | 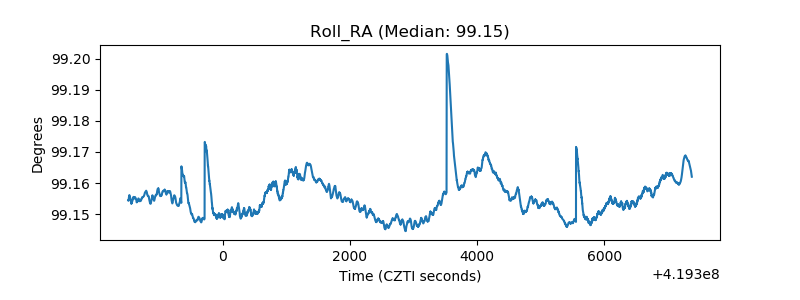 |
| Veto Counter | 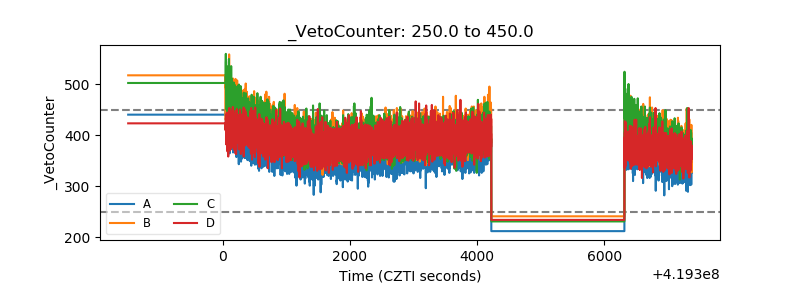 |