| Param | Original file | Final file |
|---|---|---|
| Filename | modeM0/AS1A12_099T03_9000005570_40811cztM0_level2.fits | modeM0/AS1A12_099T03_9000005570_40811cztM0_level2_quad_clean.evt |
| Size (bytes) | 316,863,360 | 88,865,280 |
| Size | 302.2 MB | 84.7 MB |
| Events in quadrant A | 2,942,105 | 595,044 |
| Events in quadrant B | 2,470,955 | 617,884 |
| Events in quadrant C | 2,723,590 | 578,449 |
| Events in quadrant D | 3,177,093 | 526,401 |
| Mode M0 | |||
|---|---|---|---|
| Quadrant | BADHDUFLAG | Total packets | Discarded packets |
| A | 0 | 11809 | 3 |
| B | 0 | 10933 | 2 |
| C | 0 | 11363 | 2 |
| D | 0 | 13326 | 2 |
| Mode SS | |||
|---|---|---|---|
| Quadrant | BADHDUFLAG | Total packets | Discarded packets |
| A | 0 | 108 | 0 |
| B | 0 | 108 | 0 |
| C | 0 | 108 | 0 |
| D | 0 | 108 | 0 |
| Mode M9 | |||
|---|---|---|---|
| Quadrant | BADHDUFLAG | Total packets | Discarded packets |
| A | 0 | 27 | 0 |
| B | 0 | 27 | 0 |
| C | 0 | 27 | 0 |
| D | 0 | 28 | 0 |
| Quadrant | Total seconds | Saturated seconds | Saturation percentage |
|---|---|---|---|
| A | 5331 | 16 | 0.300131% |
| B | 5331 | 14 | 0.262615% |
| C | 5331 | 30 | 0.562746% |
| D | 5331 | 95 | 1.782030% |
Noise dominated data is calculated using 1-second bins in cleaned event files. If a bin has >2000 counts, and if more than 50% of those come from <1% of pixels, then it is considered to be noise-dominated and hence unusable.
| Quadrant | # 1 sec bins | Bins with >0 counts | Bins with >2000 counts | High rate bins dominated by noise | Noise dominated (total time) | Noise dominated (detector-on time) | Marked lightcurve |
|---|---|---|---|---|---|---|---|
| A | 7214 | 5332 | 7 | 7 | 0.10% | 0.13% | 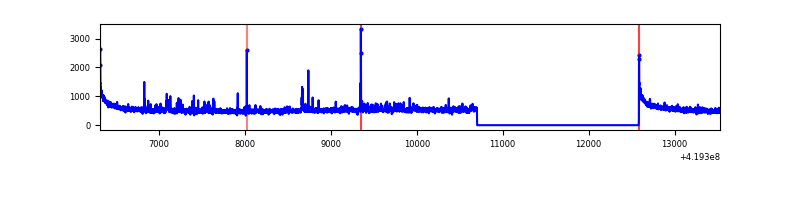 |
| B | 7214 | 5332 | 2 | 2 | 0.03% | 0.04% | 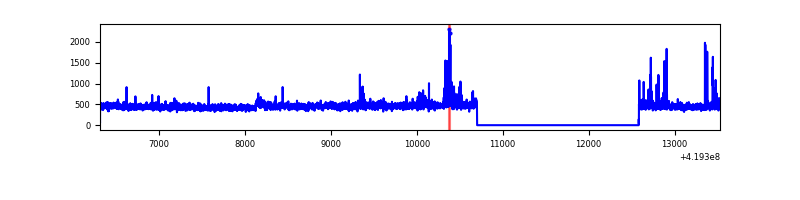 |
| C | 7214 | 5332 | 22 | 22 | 0.30% | 0.41% | 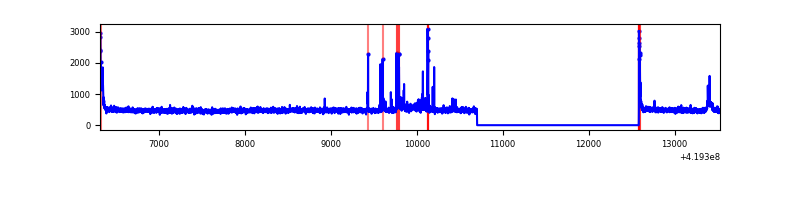 |
| D | 7214 | 5332 | 84 | 84 | 1.16% | 1.58% | 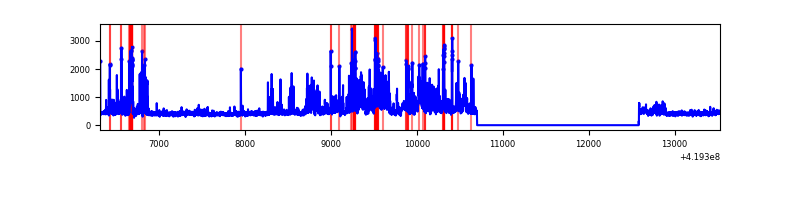 |
Top three noisy pixels from each quadrant. If the there are fewer than three noisy pixels in the level2.evt file, extra rows are filled as -1
| Pixel properties | Quadrant properties | ||||||
|---|---|---|---|---|---|---|---|
| Quadrant | DetID | PixID | Counts | Sigma | Mean | Median | Sigma |
| A | 10 | 83 | 519305 | 4220.27 | 594 | 582 | 122.9 |
| A | 13 | 248 | 49160 | 395.22 | 594 | 582 | 122.9 |
| A | 12 | 189 | 48276 | 388.03 | 594 | 582 | 122.9 |
| B | 0 | 190 | 86630 | 748.54 | 592 | 575 | 115.0 |
| B | 0 | 230 | 25654 | 218.15 | 592 | 575 | 115.0 |
| B | 12 | 111 | 14186 | 118.39 | 592 | 575 | 115.0 |
| C | 15 | 214 | 233092 | 1716.84 | 578 | 583 | 135.4 |
| C | 14 | 254 | 136431 | 1003.1 | 578 | 583 | 135.4 |
| C | 0 | 10 | 85487 | 626.93 | 578 | 583 | 135.4 |
| D | 5 | 222 | 574970 | 4042.66 | 574 | 557 | 142.1 |
| D | 12 | 233 | 134837 | 945.05 | 574 | 557 | 142.1 |
| D | 1 | 47 | 113133 | 792.3 | 574 | 557 | 142.1 |
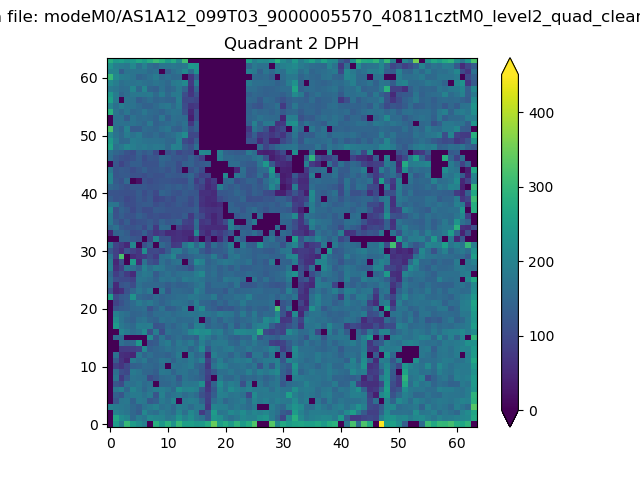
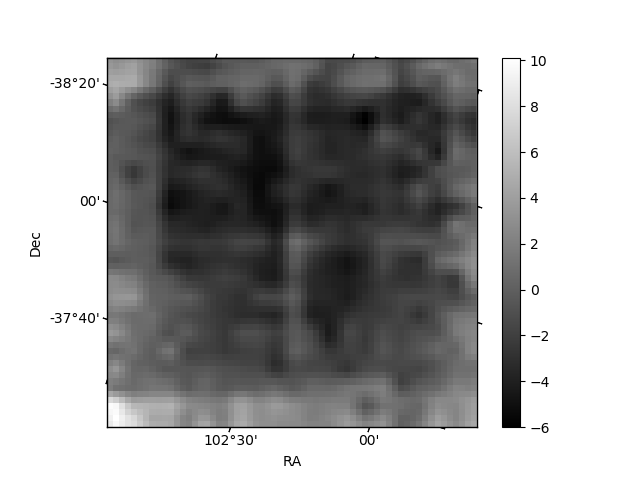
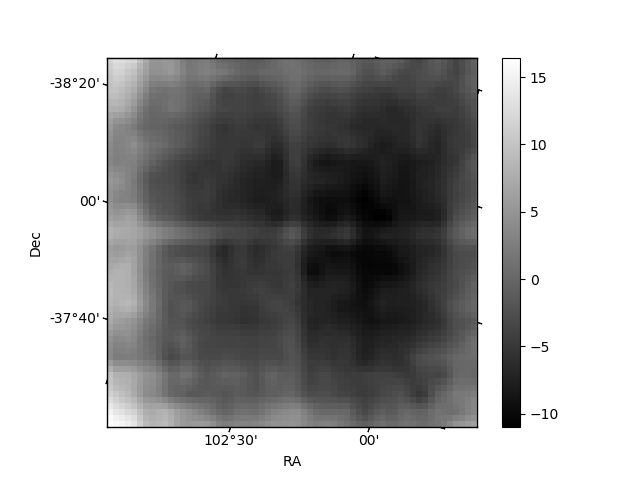
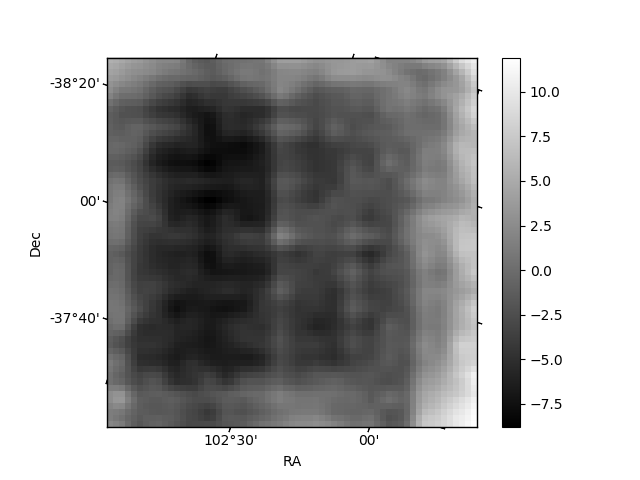
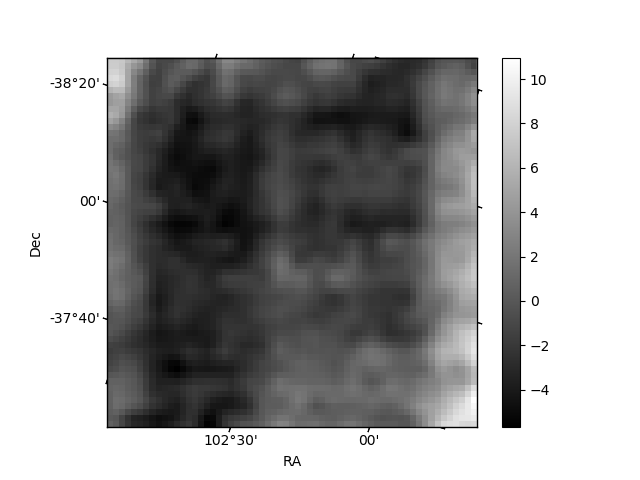
Histogram calculated using DETX and DETY for each event in the final _common_clean file
| Quadrant A | 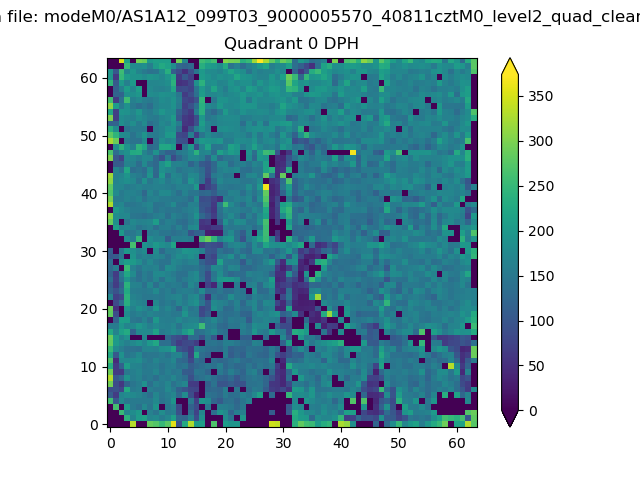 |
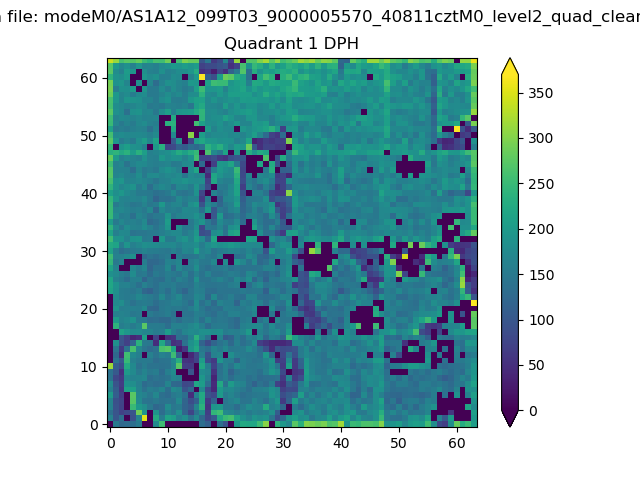 |
Quadrant B |
|---|---|---|---|
| Quadrant D | 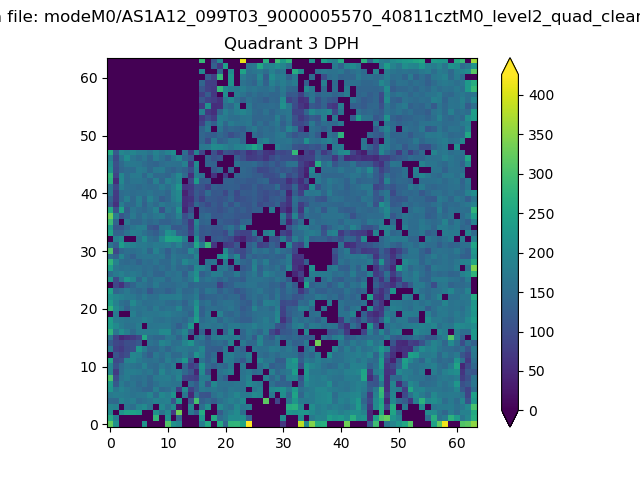 |
 |
Quadrant C |
| Plot type | Count rate plots | Images |
|---|---|---|
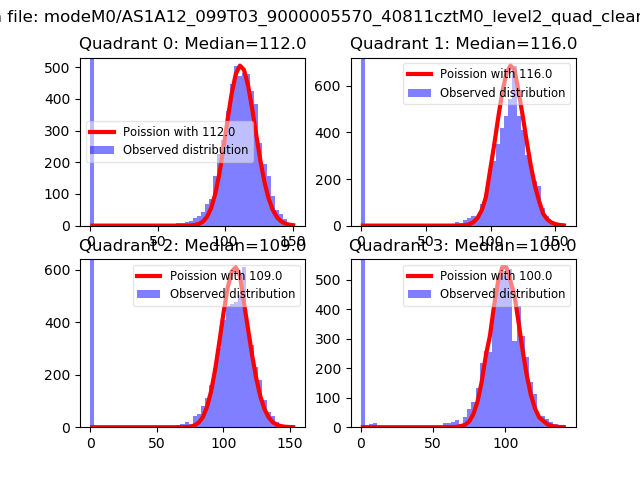
| Comparison with Poisson distribution Blue bars denote a histogram of data divided into 1 sec bins. Red curve is a Poisson curve with rate = median count rate of data. |
 |
 |
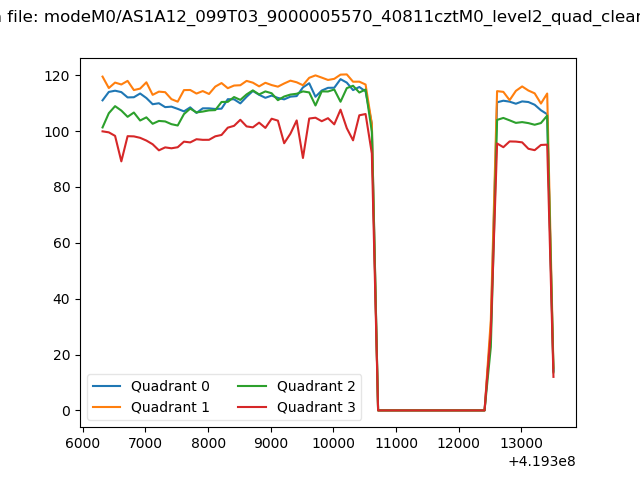
| Quadrant-wise count rates Data is divided into 100 sec bins |
 |
|
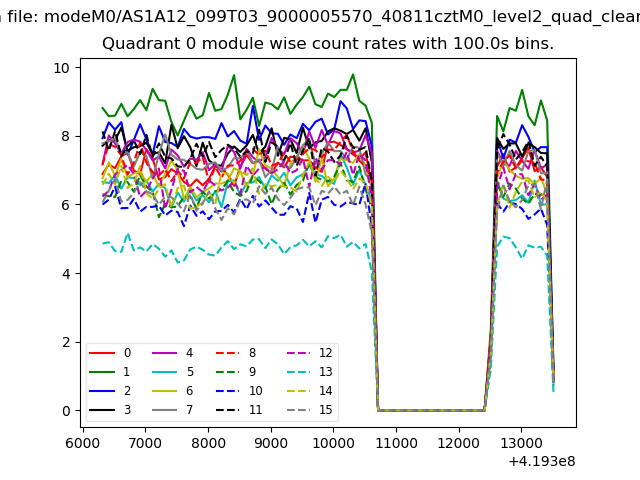
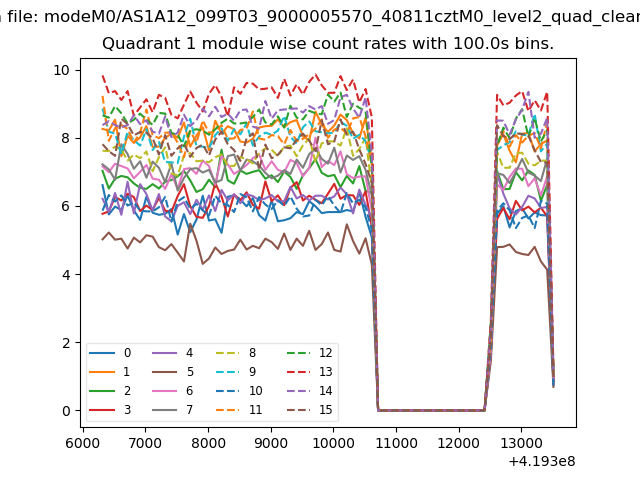
| Module-wise count rates for Quadrant A Data is divided into 100 sec bins |
 |
 |
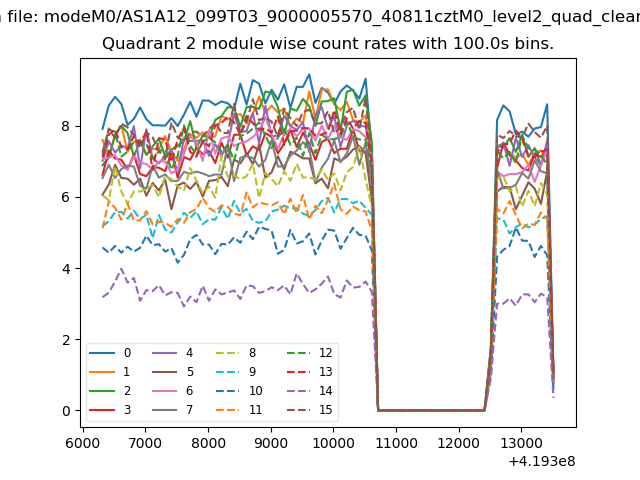
| Module-wise count rates for Quadrant B Data is divided into 100 sec bins |
 |
 |
| Module-wise count rates for Quadrant C Data is divided into 100 sec bins |
 |
 |
| Module-wise count rates for Quadrant D Data is divided into 100 sec bins |
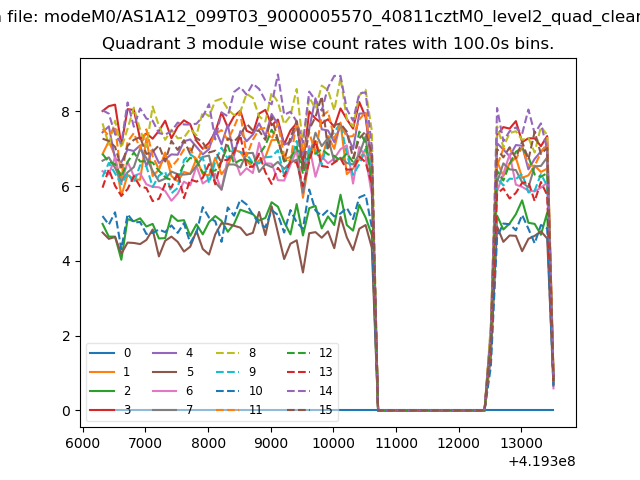 |
 |
| Parameter | Plot |
|---|---|
| CZT HV Monitor | 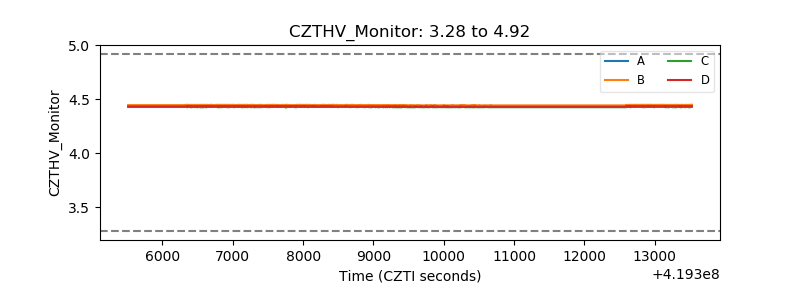 |
| D_VDD | 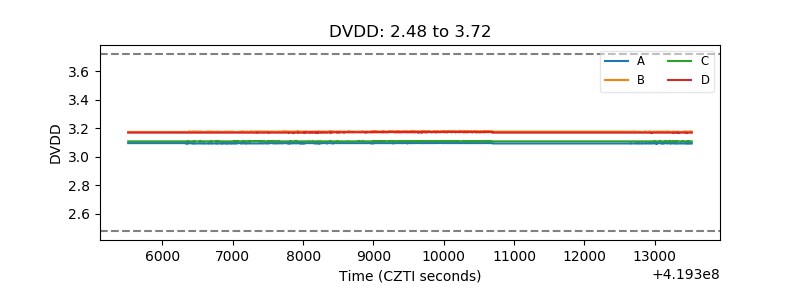 |
| Temperature 1 | 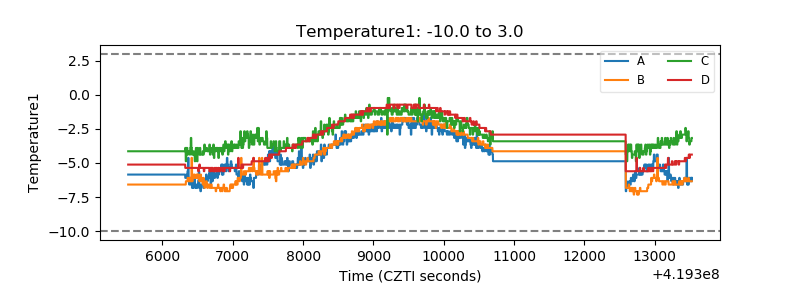 |
| Veto HV Monitor | 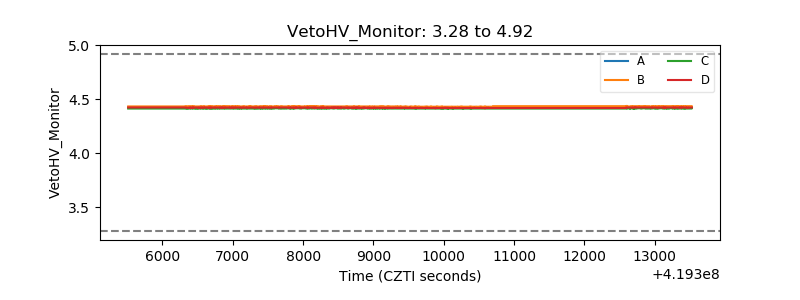 |
| Veto LLD | 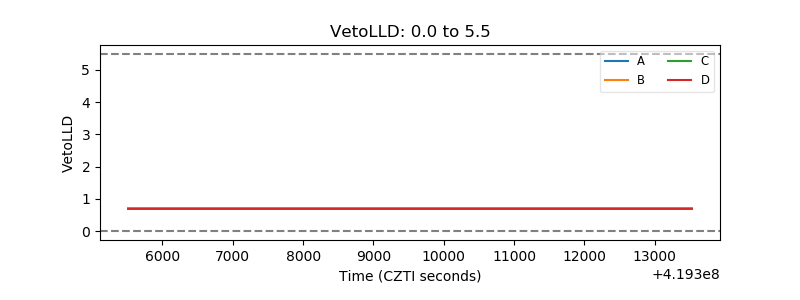 |
| Alpha Counter | 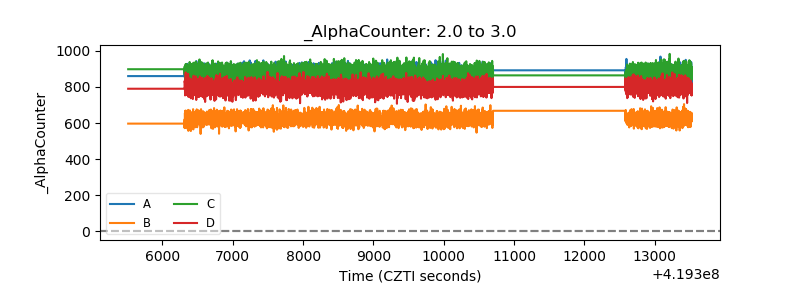 |
| _CPM_Rate | 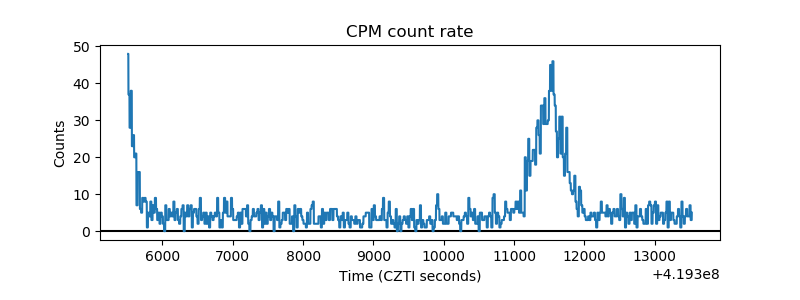 |
| CZT Counter | 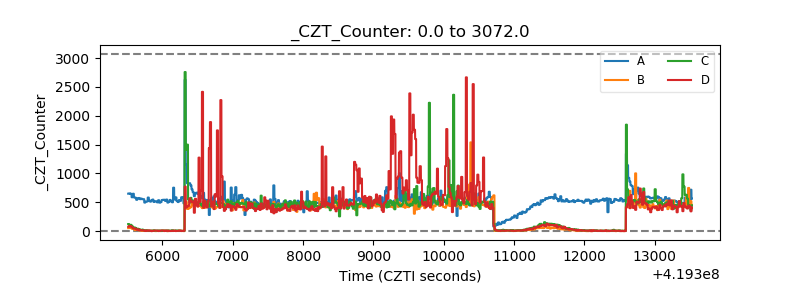 |
| +2.5 Volts monitor | 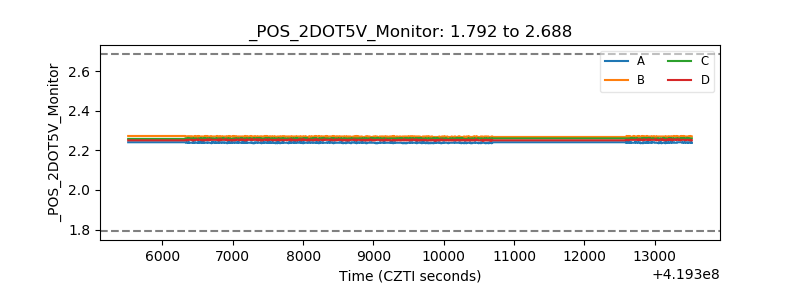 |
| +5 Volts monitor | 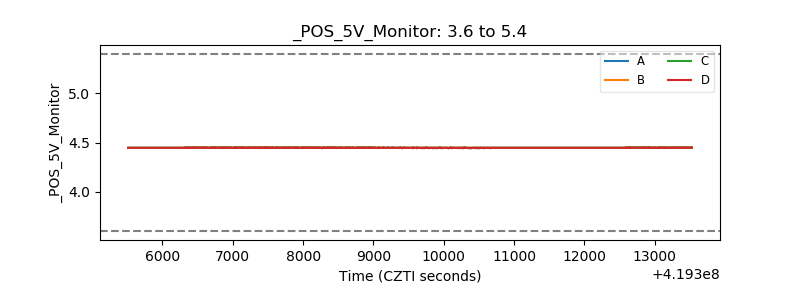 |
| _ROLL_ROT | 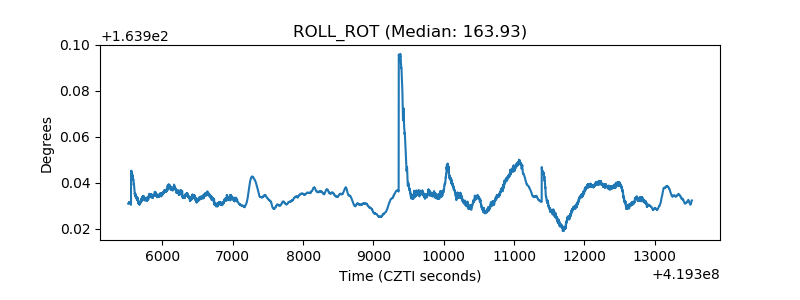 |
| _Roll_DEC | 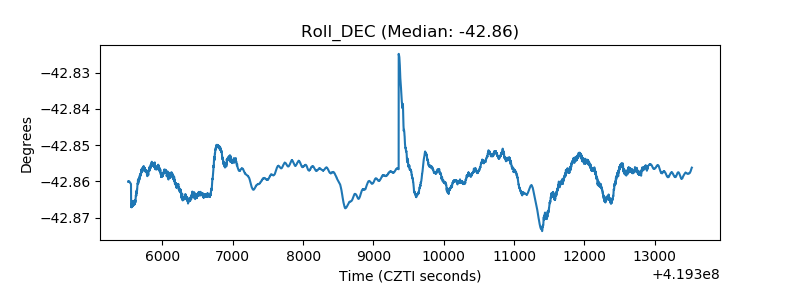 |
| _Roll_RA | 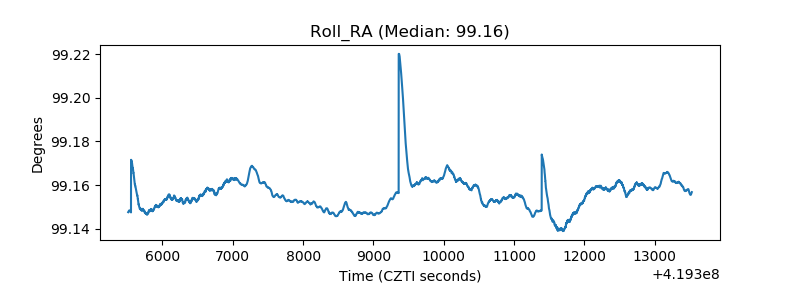 |
| Veto Counter | 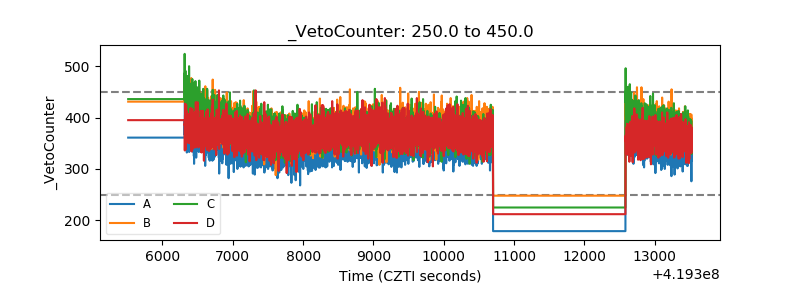 |