| Param | Original file | Final file |
|---|---|---|
| Filename | modeM0/AS1A12_099T03_9000005570_40812cztM0_level2.fits | modeM0/AS1A12_099T03_9000005570_40812cztM0_level2_quad_clean.evt |
| Size (bytes) | 329,987,520 | 96,537,600 |
| Size | 314.7 MB | 92.1 MB |
| Events in quadrant A | 3,109,528 | 642,844 |
| Events in quadrant B | 2,725,981 | 667,490 |
| Events in quadrant C | 2,801,449 | 632,927 |
| Events in quadrant D | 3,122,521 | 571,455 |
| Mode M0 | |||
|---|---|---|---|
| Quadrant | BADHDUFLAG | Total packets | Discarded packets |
| A | 0 | 12607 | 3 |
| B | 0 | 12051 | 2 |
| C | 0 | 11959 | 2 |
| D | 0 | 13530 | 2 |
| Mode SS | |||
|---|---|---|---|
| Quadrant | BADHDUFLAG | Total packets | Discarded packets |
| A | 0 | 120 | 0 |
| B | 0 | 120 | 0 |
| C | 0 | 120 | 0 |
| D | 0 | 120 | 0 |
| Mode M9 | |||
|---|---|---|---|
| Quadrant | BADHDUFLAG | Total packets | Discarded packets |
| A | 0 | 35 | 0 |
| B | 0 | 35 | 0 |
| C | 0 | 35 | 0 |
| D | 0 | 35 | 0 |
| Quadrant | Total seconds | Saturated seconds | Saturation percentage |
|---|---|---|---|
| A | 5846 | 12 | 0.205269% |
| B | 5846 | 18 | 0.307903% |
| C | 5846 | 20 | 0.342114% |
| D | 5846 | 104 | 1.778994% |
Noise dominated data is calculated using 1-second bins in cleaned event files. If a bin has >2000 counts, and if more than 50% of those come from <1% of pixels, then it is considered to be noise-dominated and hence unusable.
| Quadrant | # 1 sec bins | Bins with >0 counts | Bins with >2000 counts | High rate bins dominated by noise | Noise dominated (total time) | Noise dominated (detector-on time) | Marked lightcurve |
|---|---|---|---|---|---|---|---|
| A | 9282 | 5848 | 5 | 5 | 0.05% | 0.09% | 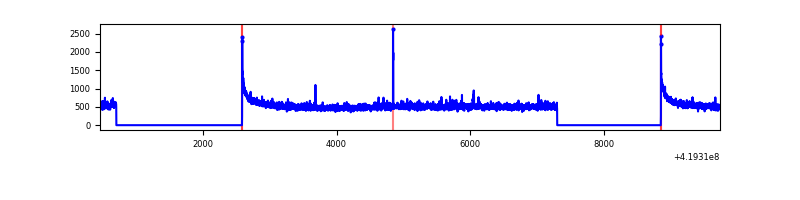 |
| B | 9282 | 5848 | 2 | 2 | 0.02% | 0.03% | 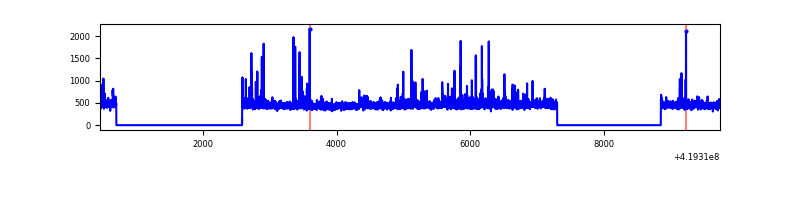 |
| C | 9282 | 5848 | 11 | 11 | 0.12% | 0.19% | 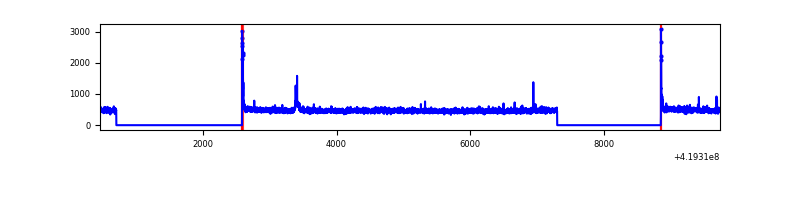 |
| D | 9282 | 5848 | 94 | 94 | 1.01% | 1.61% | 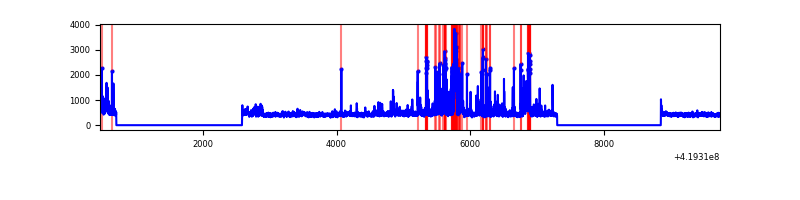 |
Top three noisy pixels from each quadrant. If the there are fewer than three noisy pixels in the level2.evt file, extra rows are filled as -1
| Pixel properties | Quadrant properties | ||||||
|---|---|---|---|---|---|---|---|
| Quadrant | DetID | PixID | Counts | Sigma | Mean | Median | Sigma |
| A | 10 | 83 | 546086 | 4097.25 | 646 | 631 | 133.1 |
| A | 12 | 189 | 44563 | 330.0 | 646 | 631 | 133.1 |
| A | 2 | 79 | 9386 | 65.76 | 646 | 631 | 133.1 |
| B | 0 | 190 | 113701 | 895.97 | 643 | 625 | 126.2 |
| B | 7 | 202 | 37927 | 295.57 | 643 | 625 | 126.2 |
| B | 0 | 230 | 18667 | 142.96 | 643 | 625 | 126.2 |
| C | 15 | 214 | 253203 | 1718.28 | 629 | 632 | 147.0 |
| C | 0 | 10 | 56412 | 379.48 | 629 | 632 | 147.0 |
| C | 14 | 254 | 29291 | 194.97 | 629 | 632 | 147.0 |
| D | 2 | 249 | 224506 | 1476.13 | 623 | 603 | 151.7 |
| D | 2 | 153 | 176550 | 1159.97 | 623 | 603 | 151.7 |
| D | 12 | 233 | 153836 | 1010.22 | 623 | 603 | 151.7 |
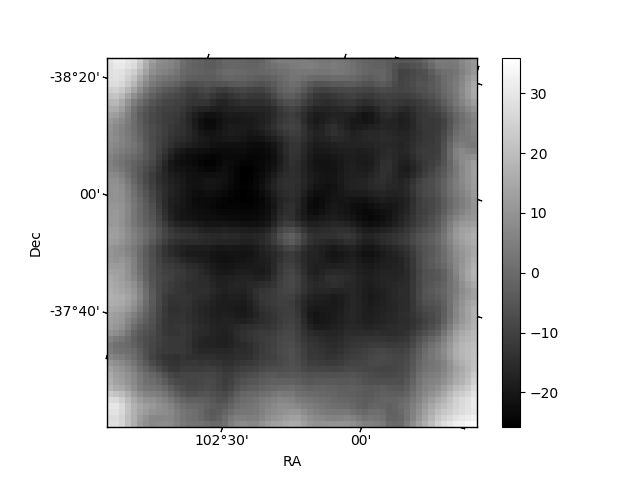
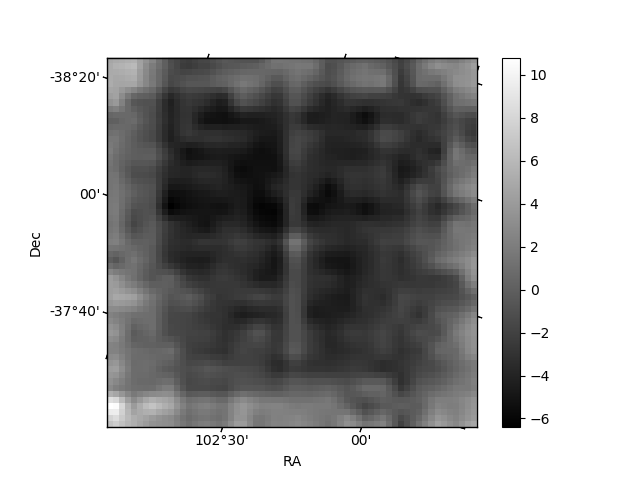
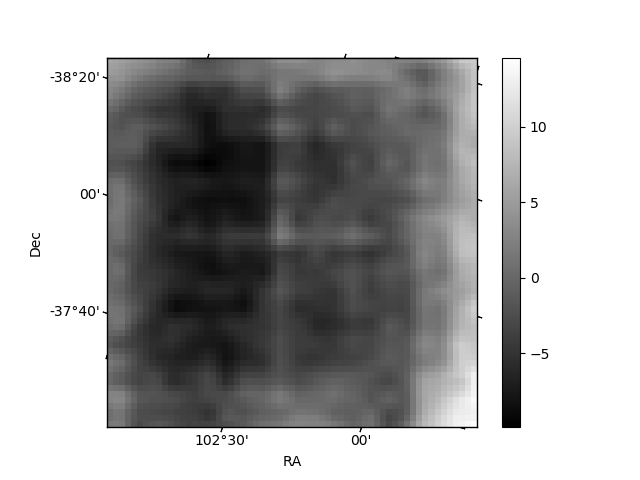
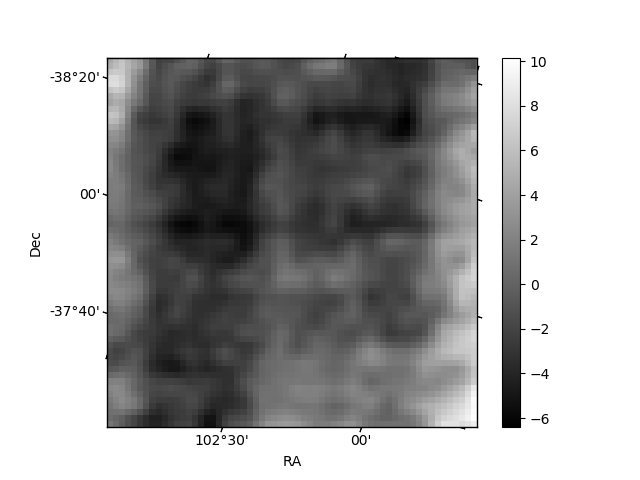
Histogram calculated using DETX and DETY for each event in the final _common_clean file
| Quadrant A | 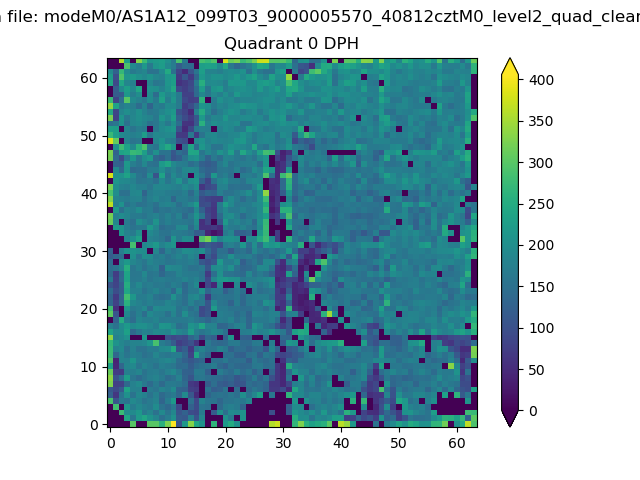 |
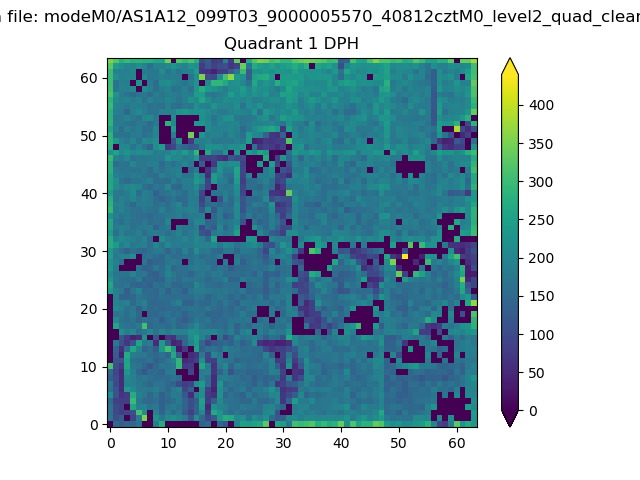 |
Quadrant B |
|---|---|---|---|
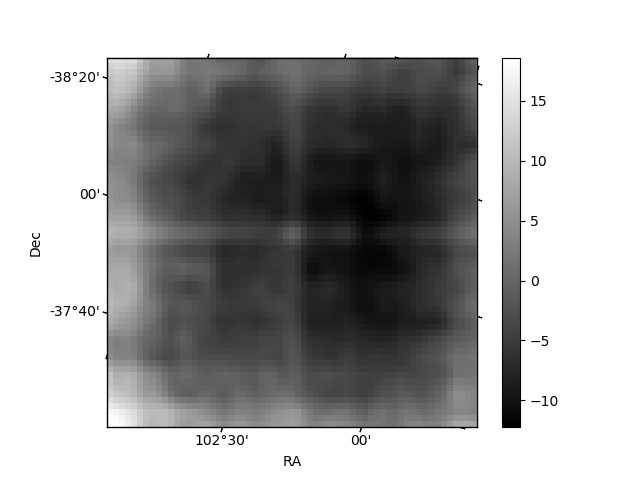
| Quadrant D | 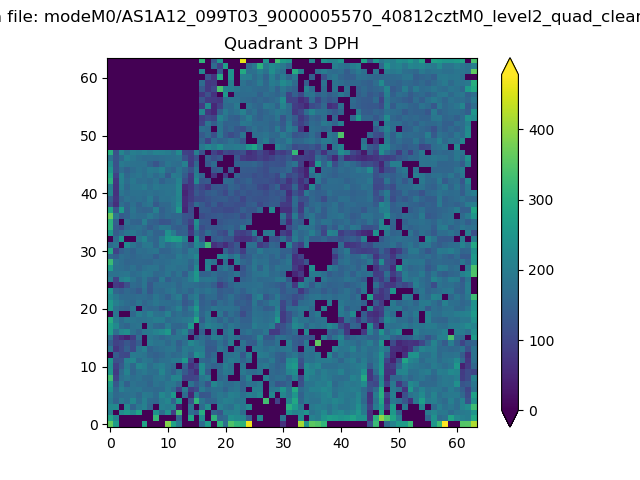 |
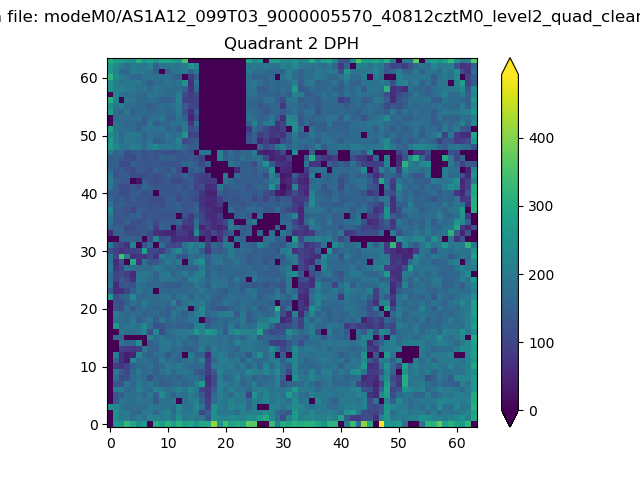 |
Quadrant C |
| Plot type | Count rate plots | Images |
|---|---|---|
| Comparison with Poisson distribution Blue bars denote a histogram of data divided into 1 sec bins. Red curve is a Poisson curve with rate = median count rate of data. |
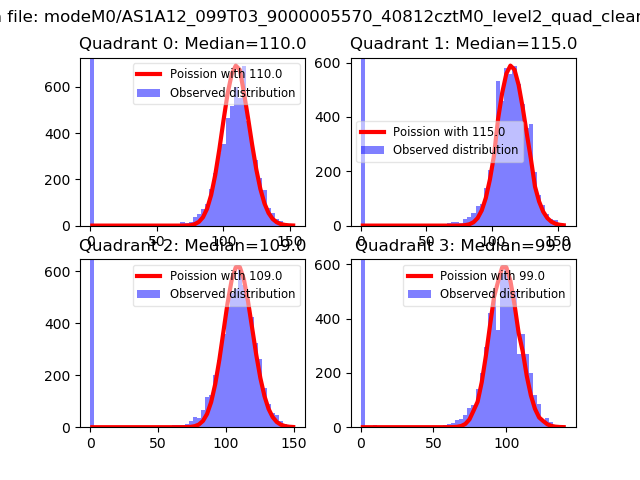 |
 |
| Quadrant-wise count rates Data is divided into 100 sec bins |
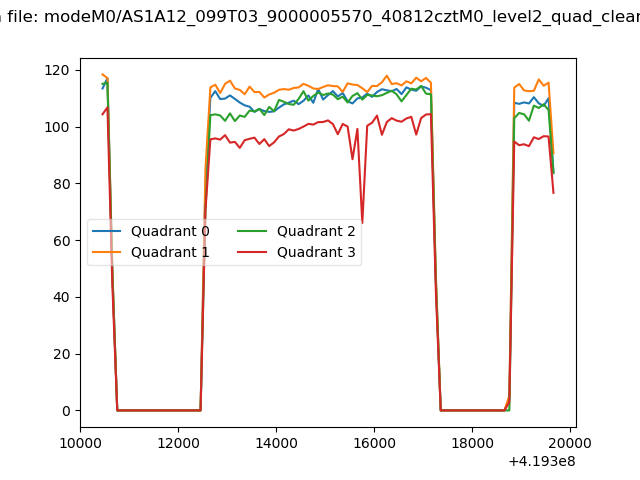 |
|
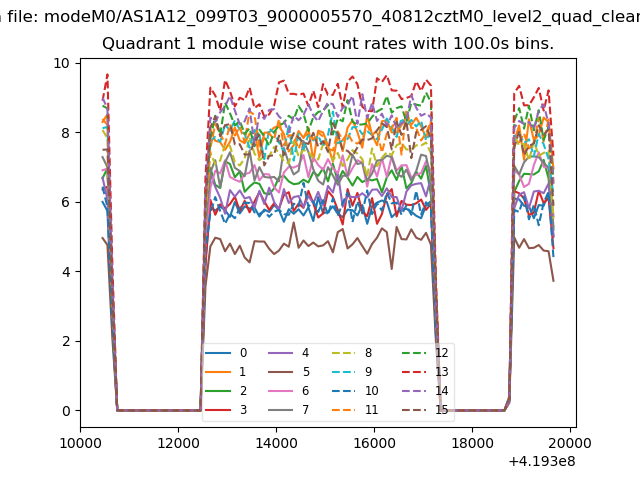
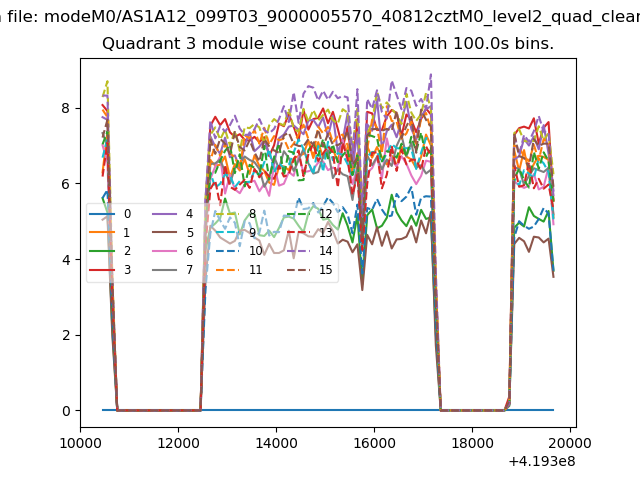
| Module-wise count rates for Quadrant A Data is divided into 100 sec bins |
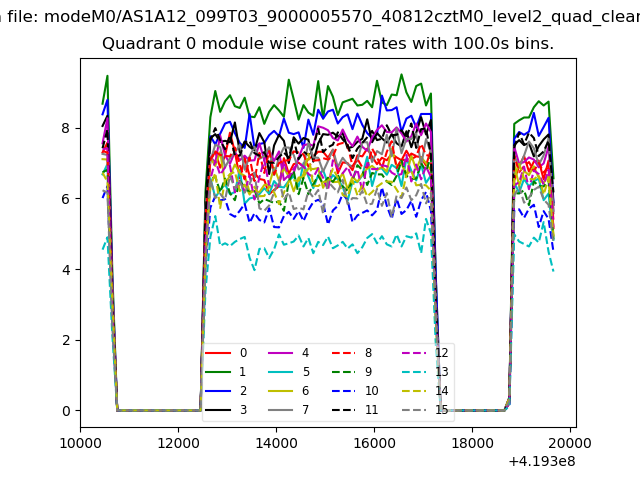 |
 |
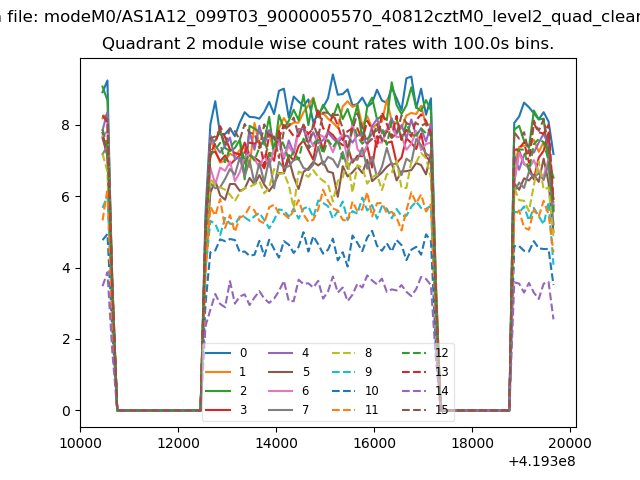
| Module-wise count rates for Quadrant B Data is divided into 100 sec bins |
 |
 |
| Module-wise count rates for Quadrant C Data is divided into 100 sec bins |
 |
 |
| Module-wise count rates for Quadrant D Data is divided into 100 sec bins |
 |
 |
| Parameter | Plot |
|---|---|
| CZT HV Monitor | 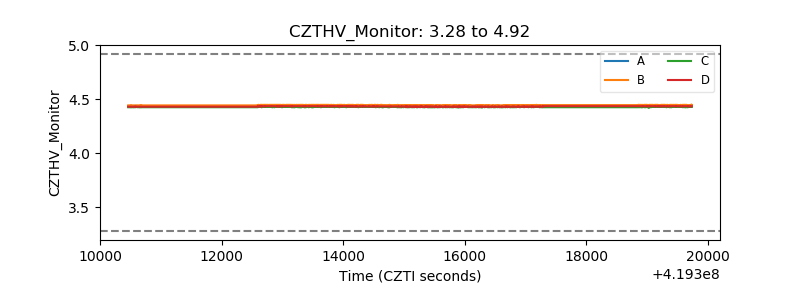 |
| D_VDD | 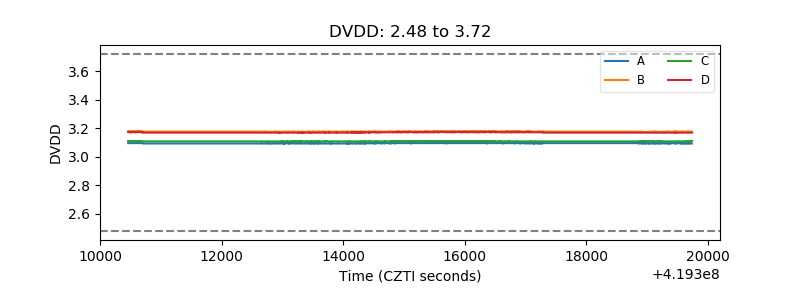 |
| Temperature 1 | 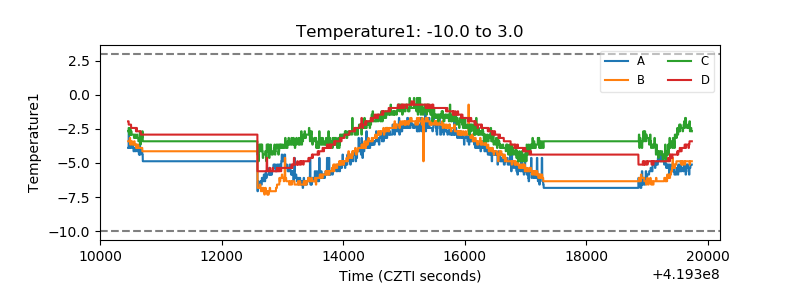 |
| Veto HV Monitor | 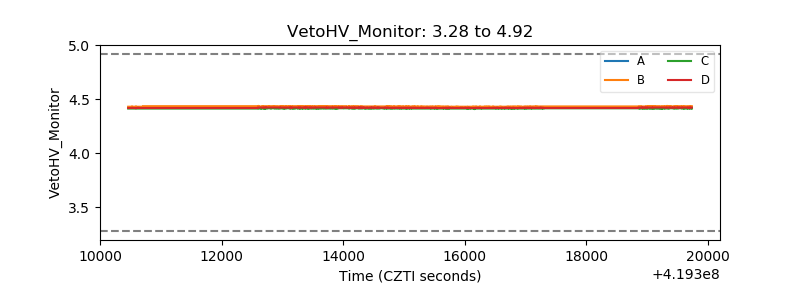 |
| Veto LLD | 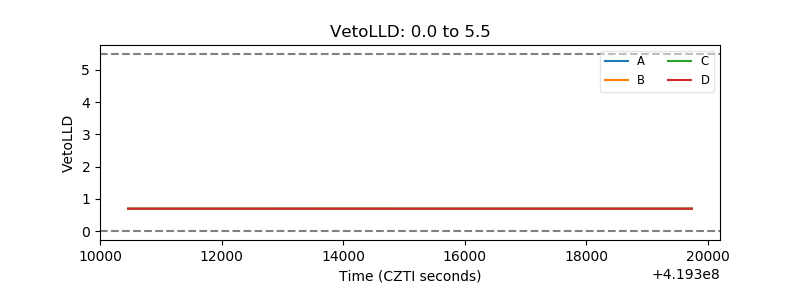 |
| Alpha Counter | 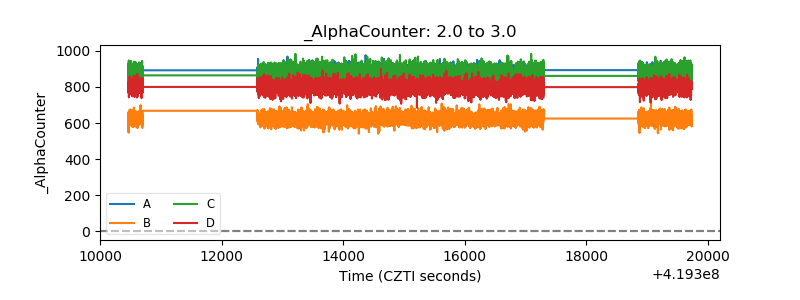 |
| _CPM_Rate | 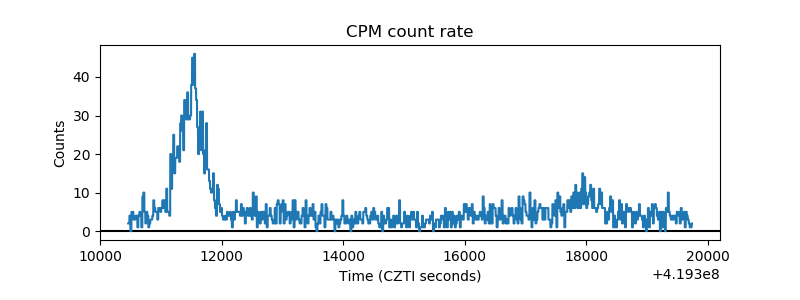 |
| CZT Counter | 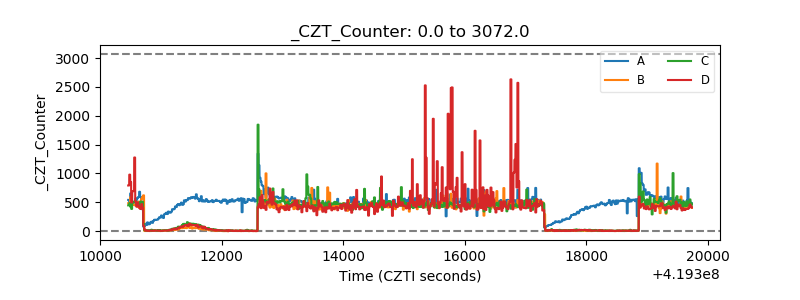 |
| +2.5 Volts monitor | 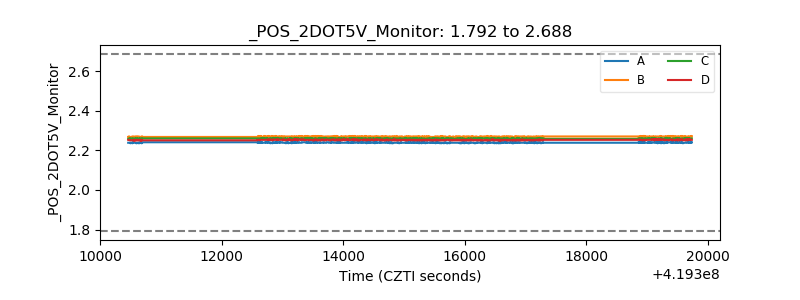 |
| +5 Volts monitor |  |
| _ROLL_ROT | 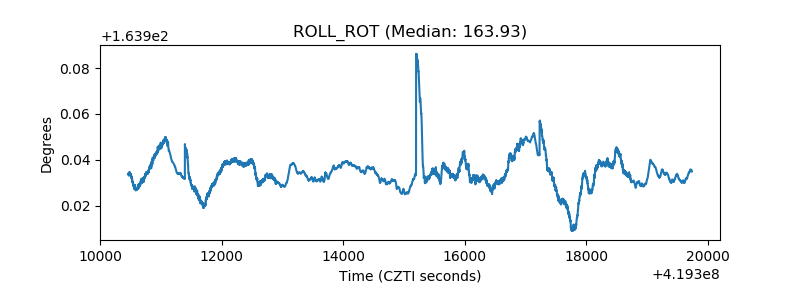 |
| _Roll_DEC | 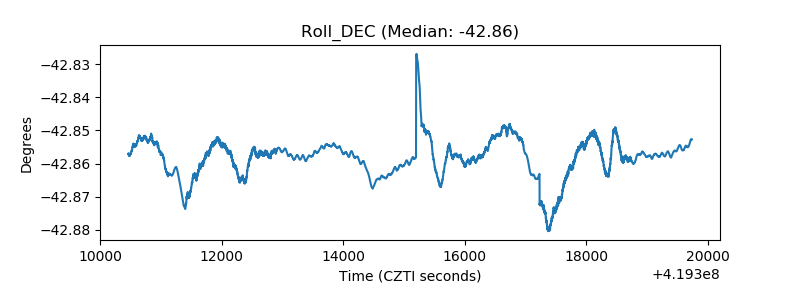 |
| _Roll_RA | 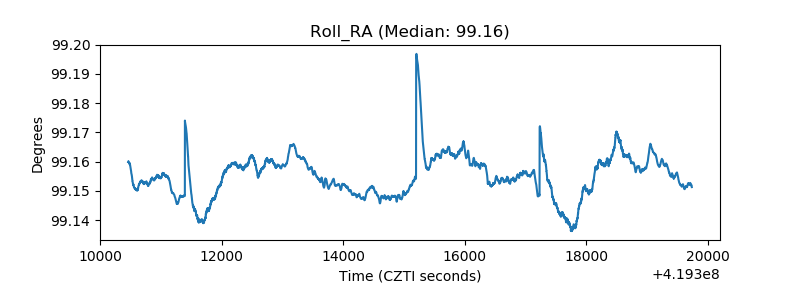 |
| Veto Counter | 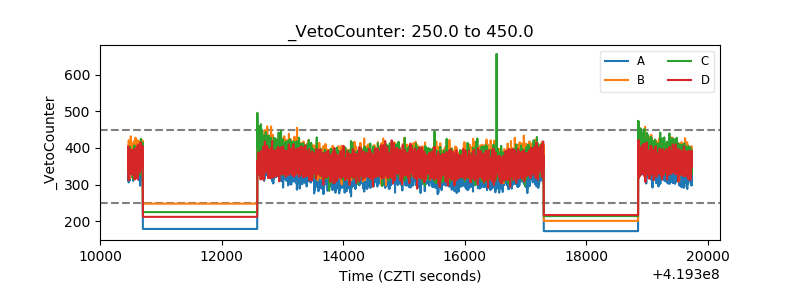 |