| Param | Original file | Final file |
|---|---|---|
| Filename | modeM0/AS1A12_099T03_9000005570_40813cztM0_level2.fits | modeM0/AS1A12_099T03_9000005570_40813cztM0_level2_quad_clean.evt |
| Size (bytes) | 344,753,280 | 94,792,320 |
| Size | 328.8 MB | 90.4 MB |
| Events in quadrant A | 3,364,103 | 625,289 |
| Events in quadrant B | 2,752,066 | 654,770 |
| Events in quadrant C | 2,790,250 | 626,155 |
| Events in quadrant D | 3,400,249 | 556,148 |
| Mode M0 | |||
|---|---|---|---|
| Quadrant | BADHDUFLAG | Total packets | Discarded packets |
| A | 0 | 13427 | 3 |
| B | 0 | 12183 | 2 |
| C | 0 | 11921 | 2 |
| D | 0 | 14339 | 2 |
| Mode SS | |||
|---|---|---|---|
| Quadrant | BADHDUFLAG | Total packets | Discarded packets |
| A | 0 | 118 | 0 |
| B | 0 | 118 | 0 |
| C | 0 | 118 | 0 |
| D | 0 | 118 | 0 |
| Mode M9 | |||
|---|---|---|---|
| Quadrant | BADHDUFLAG | Total packets | Discarded packets |
| A | 0 | 25 | 0 |
| B | 0 | 25 | 0 |
| C | 0 | 25 | 0 |
| D | 0 | 26 | 0 |
| Quadrant | Total seconds | Saturated seconds | Saturation percentage |
|---|---|---|---|
| A | 5839 | 111 | 1.901010% |
| B | 5839 | 28 | 0.479534% |
| C | 5839 | 29 | 0.496660% |
| D | 5839 | 197 | 3.373865% |
Noise dominated data is calculated using 1-second bins in cleaned event files. If a bin has >2000 counts, and if more than 50% of those come from <1% of pixels, then it is considered to be noise-dominated and hence unusable.
| Quadrant | # 1 sec bins | Bins with >0 counts | Bins with >2000 counts | High rate bins dominated by noise | Noise dominated (total time) | Noise dominated (detector-on time) | Marked lightcurve |
|---|---|---|---|---|---|---|---|
| A | 7183 | 5840 | 95 | 95 | 1.32% | 1.63% | 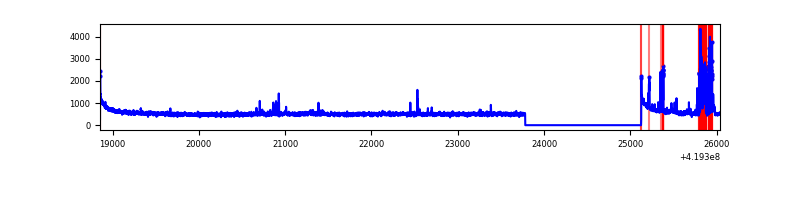 |
| B | 7183 | 5840 | 19 | 19 | 0.26% | 0.33% | 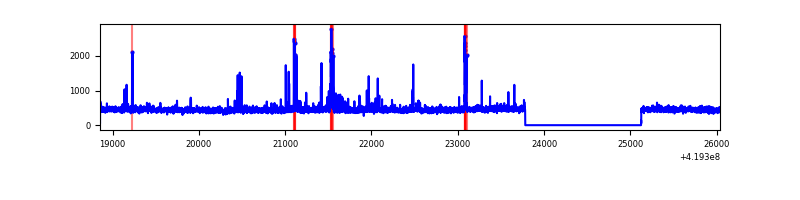 |
| C | 7183 | 5840 | 19 | 19 | 0.26% | 0.33% | 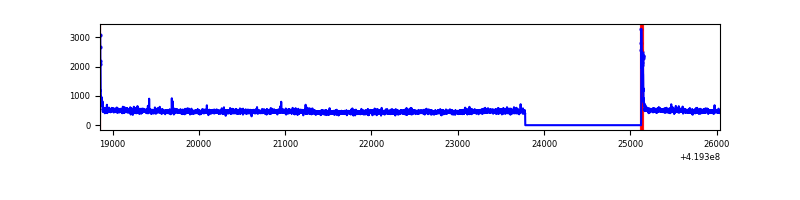 |
| D | 7183 | 5840 | 186 | 186 | 2.59% | 3.18% | 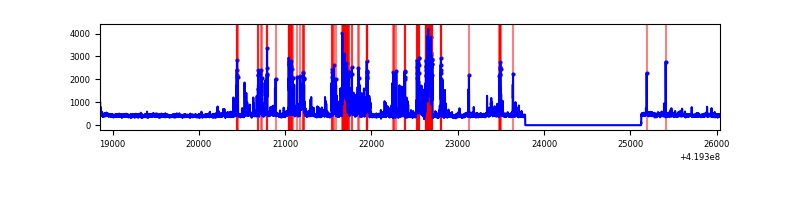 |
Top three noisy pixels from each quadrant. If the there are fewer than three noisy pixels in the level2.evt file, extra rows are filled as -1
| Pixel properties | Quadrant properties | ||||||
|---|---|---|---|---|---|---|---|
| Quadrant | DetID | PixID | Counts | Sigma | Mean | Median | Sigma |
| A | 10 | 83 | 548236 | 4177.05 | 639 | 626 | 131.1 |
| A | 6 | 10 | 255751 | 1946.04 | 639 | 626 | 131.1 |
| A | 2 | 79 | 39914 | 299.68 | 639 | 626 | 131.1 |
| B | 7 | 202 | 71066 | 558.8 | 639 | 621 | 126.1 |
| B | 0 | 190 | 64266 | 504.86 | 639 | 621 | 126.1 |
| B | 5 | 255 | 51278 | 401.84 | 639 | 621 | 126.1 |
| C | 15 | 214 | 253574 | 1726.38 | 626 | 629 | 146.5 |
| C | 0 | 10 | 71911 | 486.51 | 626 | 629 | 146.5 |
| C | 3 | 233 | 7409 | 46.27 | 626 | 629 | 146.5 |
| D | 2 | 249 | 425237 | 2786.62 | 619 | 601 | 152.4 |
| D | 12 | 233 | 314854 | 2062.24 | 619 | 601 | 152.4 |
| D | 2 | 153 | 131150 | 856.71 | 619 | 601 | 152.4 |
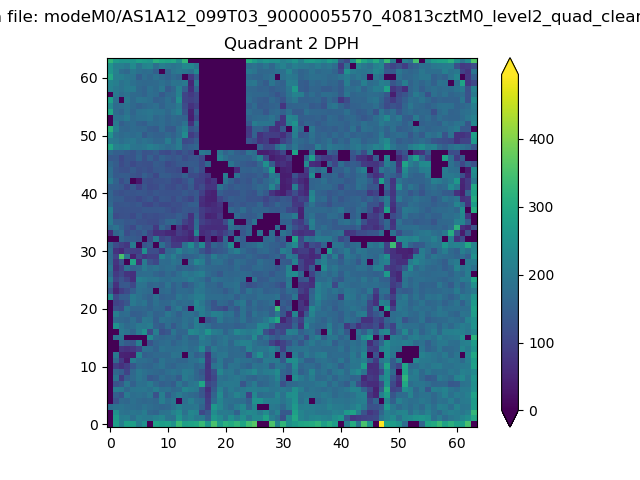
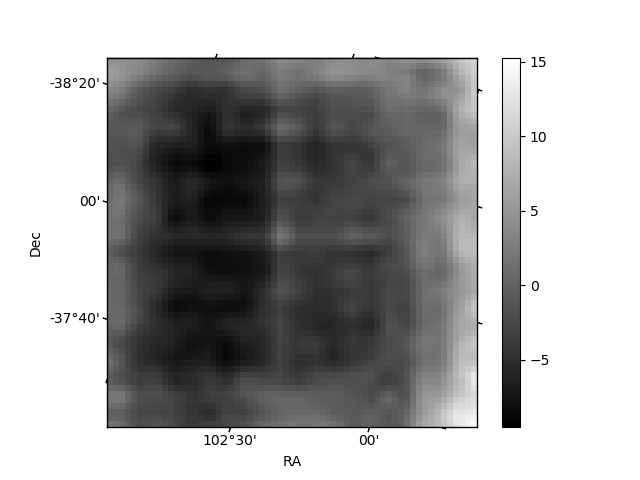
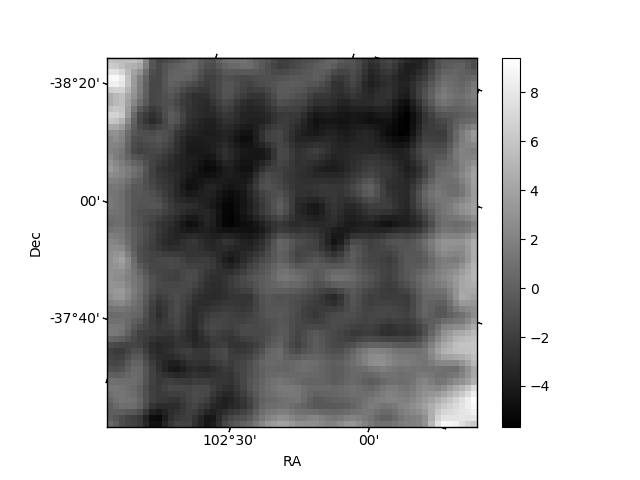
Histogram calculated using DETX and DETY for each event in the final _common_clean file
| Quadrant A | 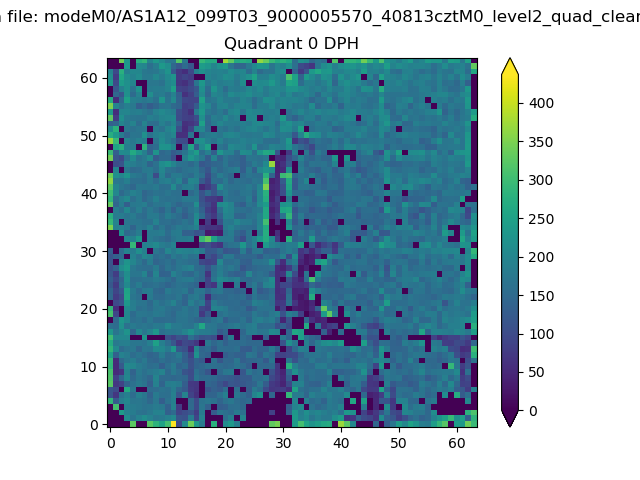 |
 |
Quadrant B |
|---|---|---|---|
| Quadrant D |  |
 |
Quadrant C |
| Plot type | Count rate plots | Images |
|---|---|---|
| Comparison with Poisson distribution Blue bars denote a histogram of data divided into 1 sec bins. Red curve is a Poisson curve with rate = median count rate of data. |
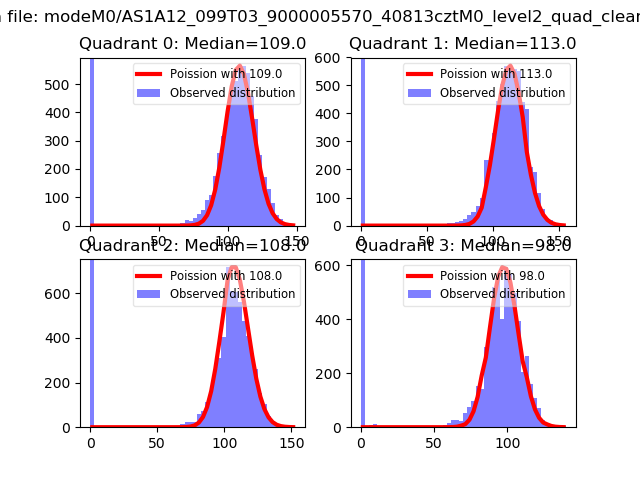 |
 |
| Quadrant-wise count rates Data is divided into 100 sec bins |
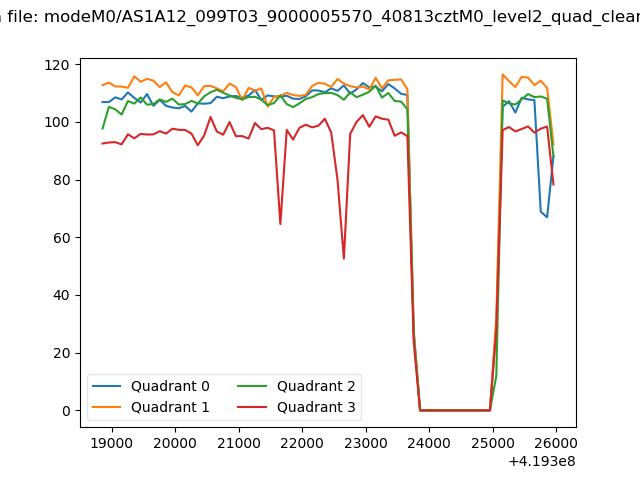 |
|
| Module-wise count rates for Quadrant A Data is divided into 100 sec bins |
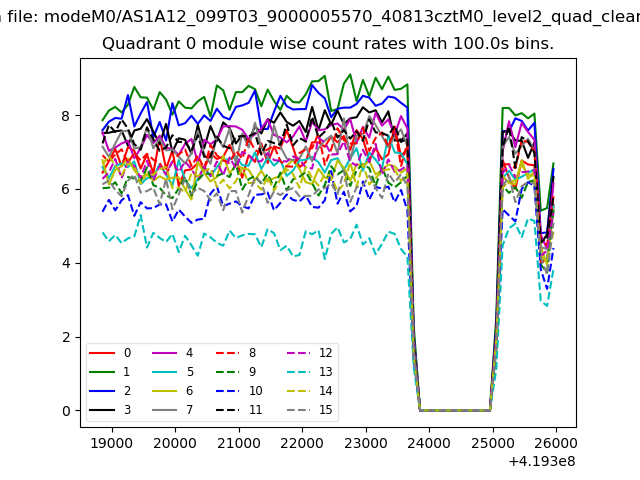 |
 |
| Module-wise count rates for Quadrant B Data is divided into 100 sec bins |
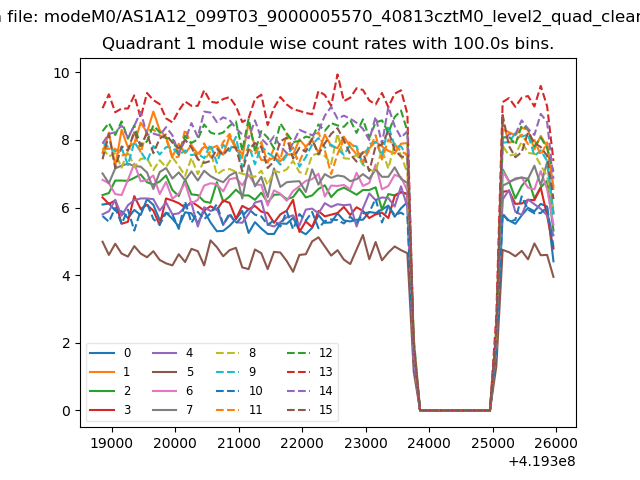 |
 |
| Module-wise count rates for Quadrant C Data is divided into 100 sec bins |
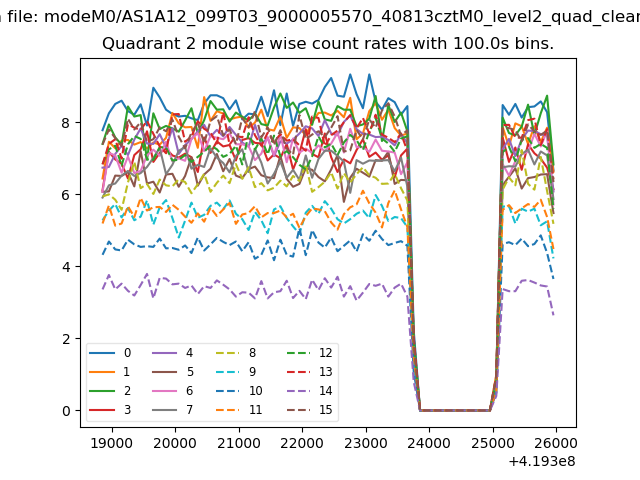 |
 |
| Module-wise count rates for Quadrant D Data is divided into 100 sec bins |
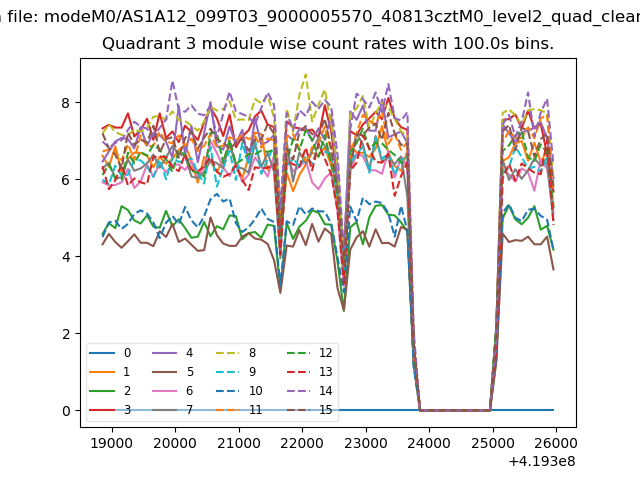 |
 |
| Parameter | Plot |
|---|---|
| CZT HV Monitor | 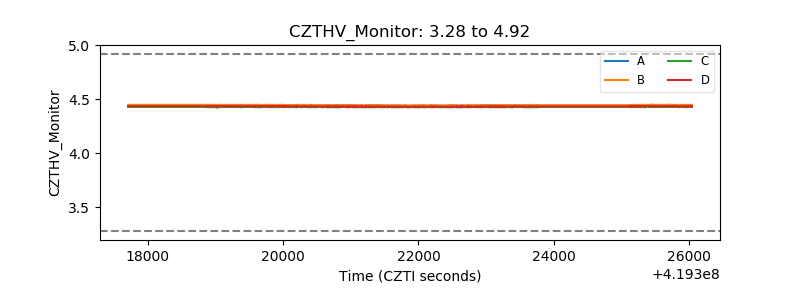 |
| D_VDD | 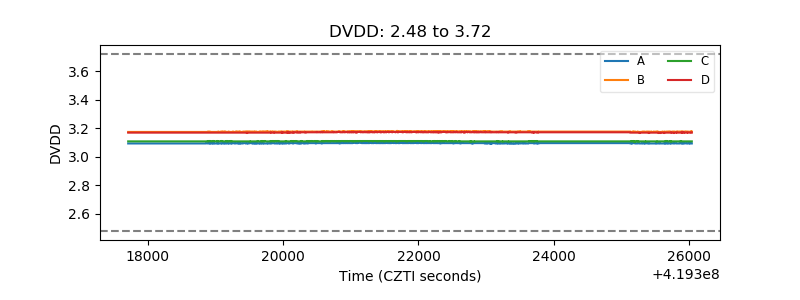 |
| Temperature 1 | 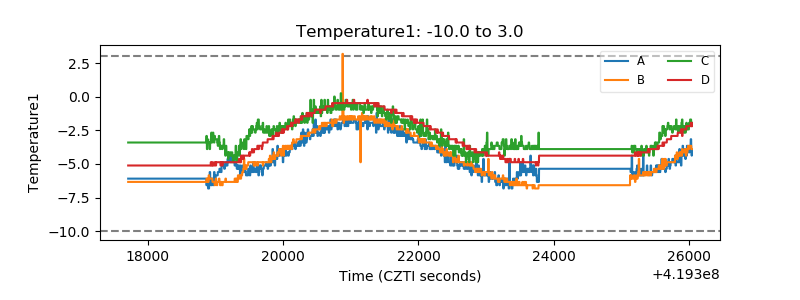 |
| Veto HV Monitor | 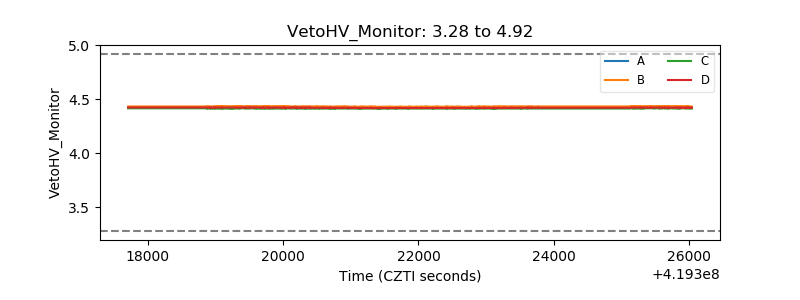 |
| Veto LLD | 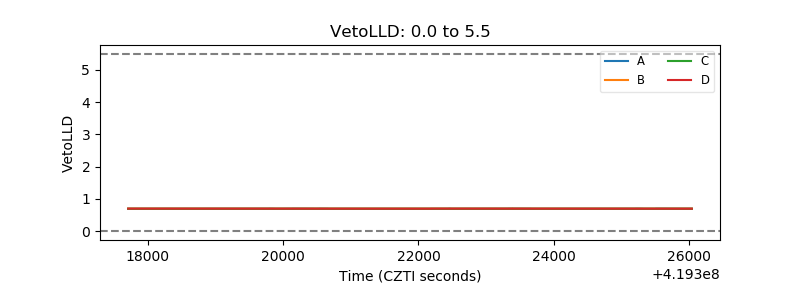 |
| Alpha Counter | 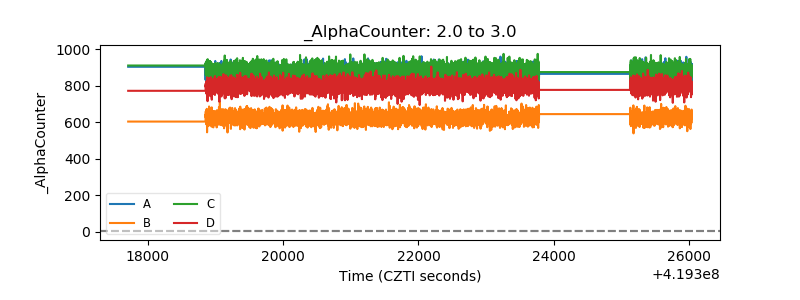 |
| _CPM_Rate | 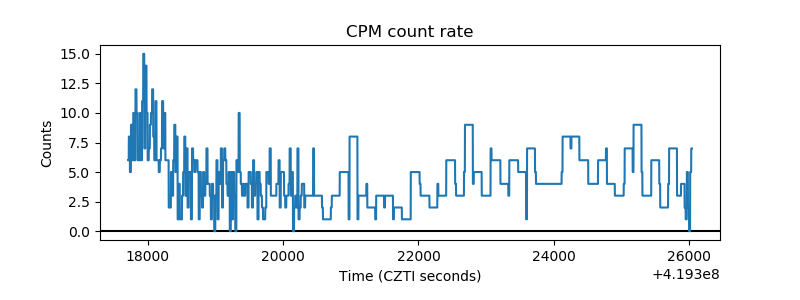 |
| CZT Counter | 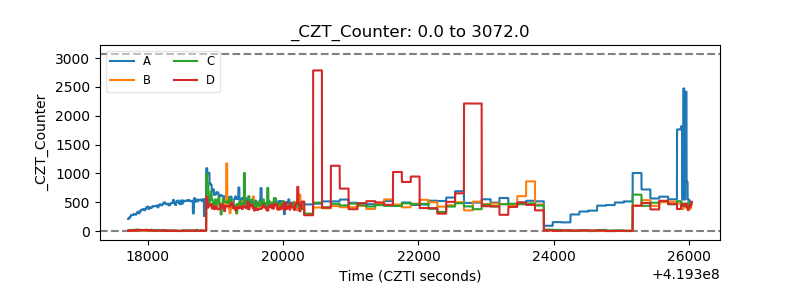 |
| +2.5 Volts monitor | 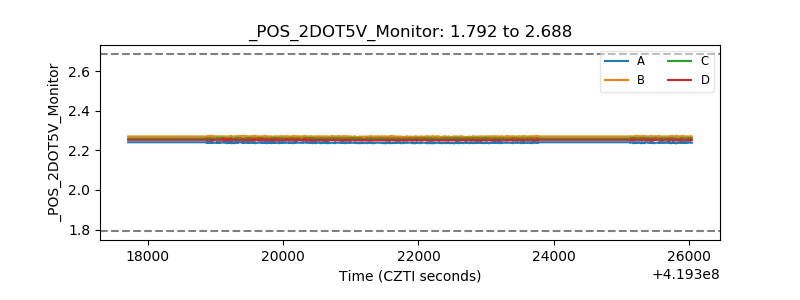 |
| +5 Volts monitor | 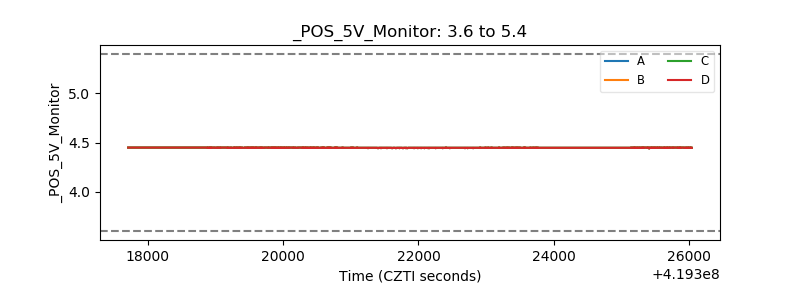 |
| _ROLL_ROT | 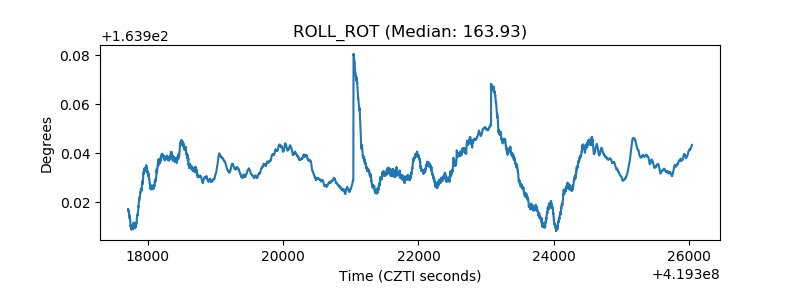 |
| _Roll_DEC | 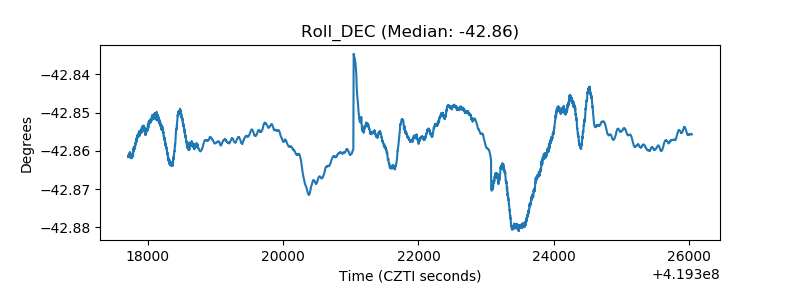 |
| _Roll_RA | 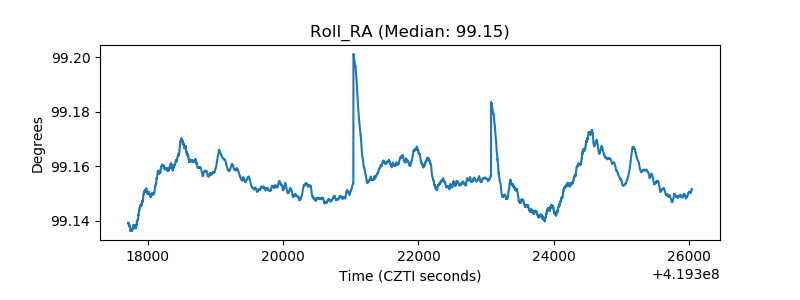 |
| Veto Counter | 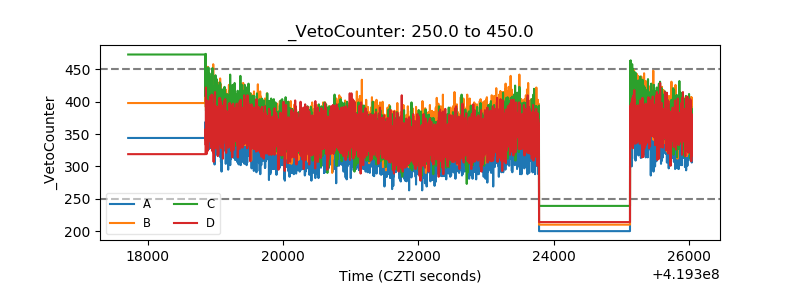 |