| Param | Original file | Final file |
|---|---|---|
| Filename | modeM0/AS1A12_099T03_9000005570_40816cztM0_level2.fits | modeM0/AS1A12_099T03_9000005570_40816cztM0_level2_quad_clean.evt |
| Size (bytes) | 651,081,600 | 175,049,280 |
| Size | 620.9 MB | 166.9 MB |
| Events in quadrant A | 6,104,455 | 1,172,041 |
| Events in quadrant B | 5,035,268 | 1,197,666 |
| Events in quadrant C | 5,103,434 | 1,147,755 |
| Events in quadrant D | 7,017,388 | 1,032,603 |
| Mode M0 | |||
|---|---|---|---|
| Quadrant | BADHDUFLAG | Total packets | Discarded packets |
| A | 0 | 24529 | 4 |
| B | 0 | 22401 | 3 |
| C | 0 | 22095 | 3 |
| D | 0 | 28572 | 3 |
| Mode SS | |||
|---|---|---|---|
| Quadrant | BADHDUFLAG | Total packets | Discarded packets |
| A | 0 | 220 | 0 |
| B | 0 | 220 | 0 |
| C | 0 | 220 | 0 |
| D | 0 | 220 | 0 |
| Mode M9 | |||
|---|---|---|---|
| Quadrant | BADHDUFLAG | Total packets | Discarded packets |
| A | 0 | 28 | 0 |
| B | 0 | 28 | 0 |
| C | 0 | 28 | 0 |
| D | 0 | 29 | 0 |
| Quadrant | Total seconds | Saturated seconds | Saturation percentage |
|---|---|---|---|
| A | 10833 | 31 | 0.286163% |
| B | 10833 | 47 | 0.433860% |
| C | 10833 | 26 | 0.240007% |
| D | 10833 | 410 | 3.784732% |
Noise dominated data is calculated using 1-second bins in cleaned event files. If a bin has >2000 counts, and if more than 50% of those come from <1% of pixels, then it is considered to be noise-dominated and hence unusable.
| Quadrant | # 1 sec bins | Bins with >0 counts | Bins with >2000 counts | High rate bins dominated by noise | Noise dominated (total time) | Noise dominated (detector-on time) | Marked lightcurve |
|---|---|---|---|---|---|---|---|
| A | 13610 | 10835 | 13 | 13 | 0.10% | 0.12% | 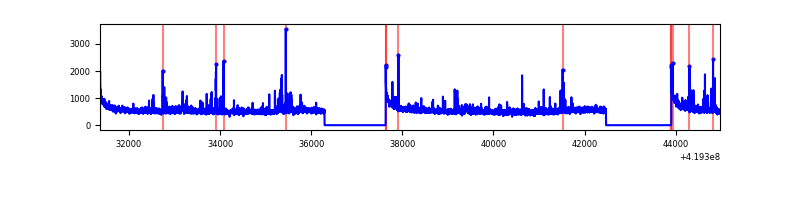 |
| B | 13610 | 10835 | 17 | 17 | 0.12% | 0.16% | 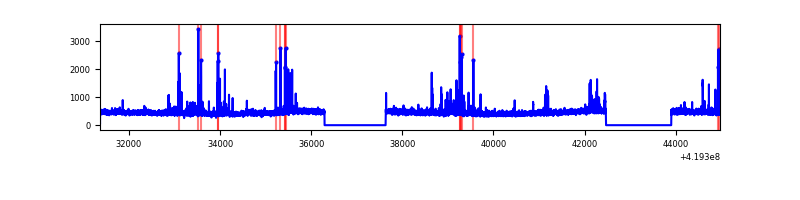 |
| C | 13610 | 10835 | 17 | 17 | 0.12% | 0.16% | 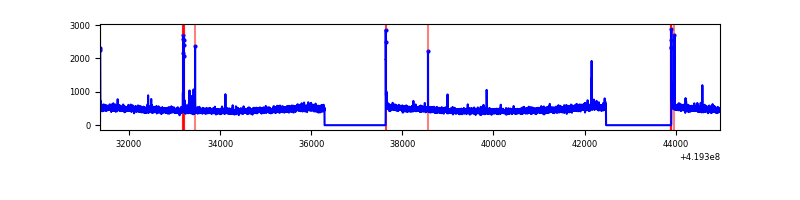 |
| D | 13610 | 10835 | 415 | 415 | 3.05% | 3.83% | 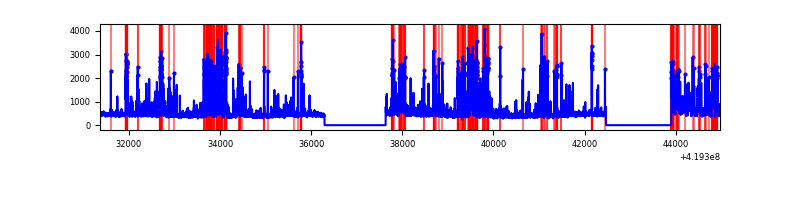 |
Top three noisy pixels from each quadrant. If the there are fewer than three noisy pixels in the level2.evt file, extra rows are filled as -1
| Pixel properties | Quadrant properties | ||||||
|---|---|---|---|---|---|---|---|
| Quadrant | DetID | PixID | Counts | Sigma | Mean | Median | Sigma |
| A | 10 | 83 | 978065 | 3991.43 | 1195 | 1171 | 244.7 |
| A | 15 | 191 | 112711 | 455.73 | 1195 | 1171 | 244.7 |
| A | 2 | 79 | 108411 | 438.16 | 1195 | 1171 | 244.7 |
| B | 0 | 190 | 288596 | 1244.71 | 1187 | 1153 | 230.9 |
| B | 0 | 230 | 53317 | 225.88 | 1187 | 1153 | 230.9 |
| B | 12 | 111 | 29384 | 122.25 | 1187 | 1153 | 230.9 |
| C | 15 | 214 | 461008 | 1704.96 | 1159 | 1166 | 269.7 |
| C | 0 | 10 | 46916 | 169.63 | 1159 | 1166 | 269.7 |
| C | 0 | 207 | 38237 | 137.45 | 1159 | 1166 | 269.7 |
| D | 1 | 47 | 844702 | 2993.49 | 1149 | 1116 | 281.8 |
| D | 2 | 249 | 697355 | 2470.62 | 1149 | 1116 | 281.8 |
| D | 12 | 79 | 334158 | 1181.81 | 1149 | 1116 | 281.8 |
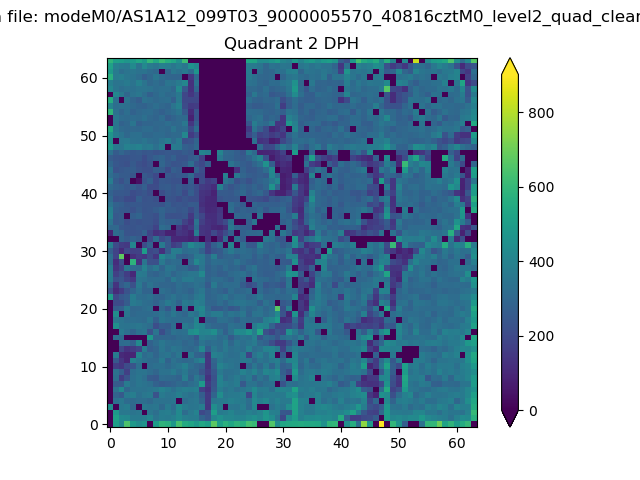
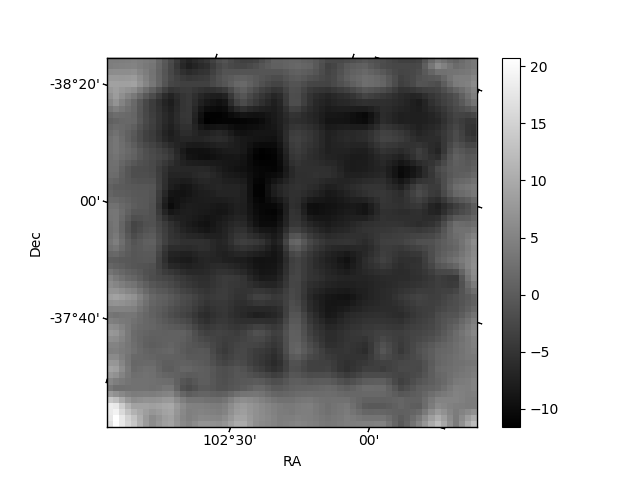
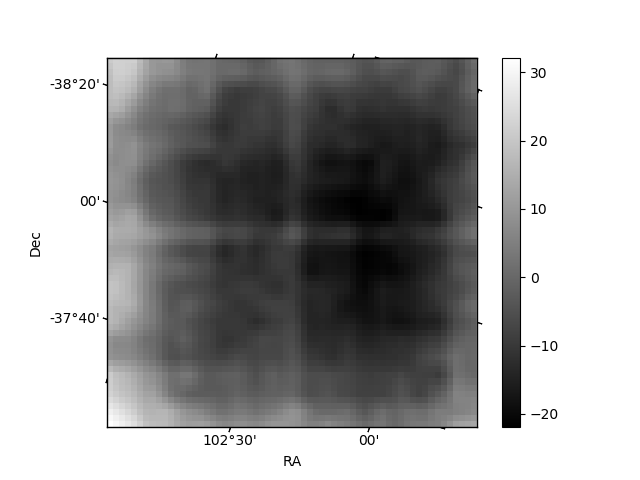
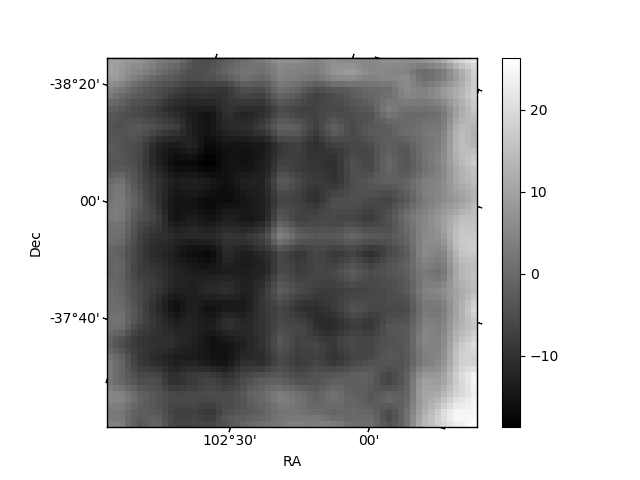
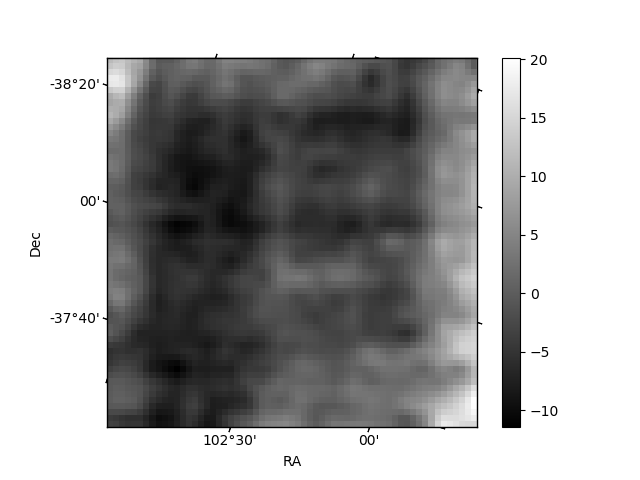
Histogram calculated using DETX and DETY for each event in the final _common_clean file
| Quadrant A | 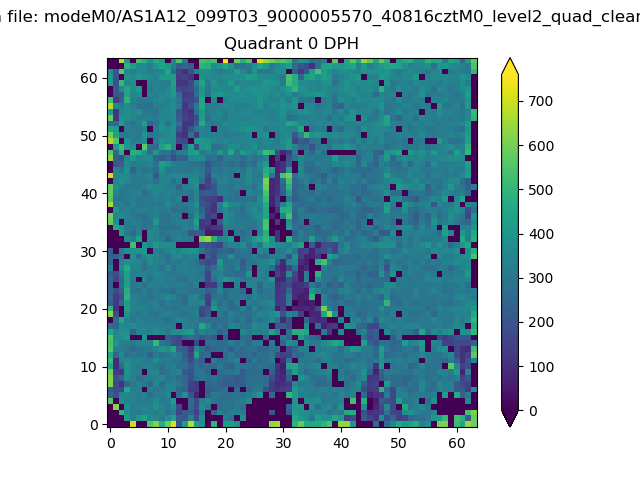 |
 |
Quadrant B |
|---|---|---|---|
| Quadrant D |  |
 |
Quadrant C |
| Plot type | Count rate plots | Images |
|---|---|---|
| Comparison with Poisson distribution Blue bars denote a histogram of data divided into 1 sec bins. Red curve is a Poisson curve with rate = median count rate of data. |
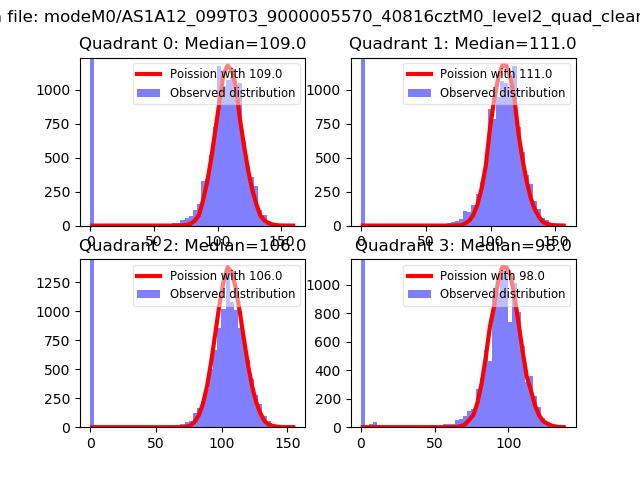 |
 |
| Quadrant-wise count rates Data is divided into 100 sec bins |
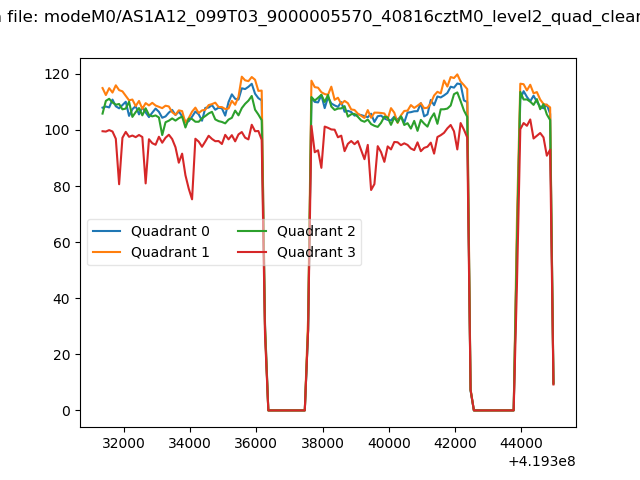 |
|
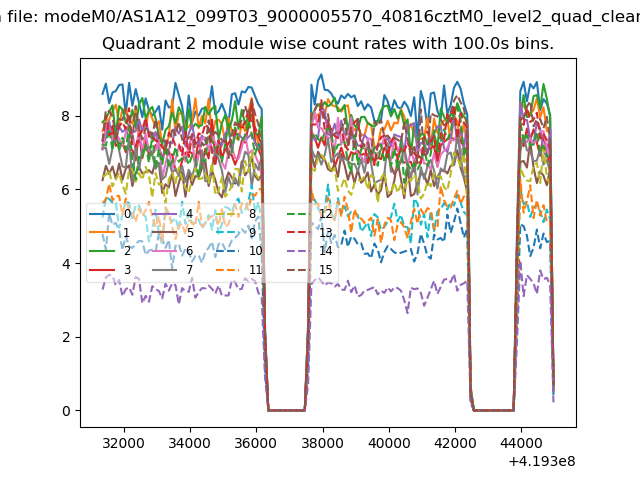
| Module-wise count rates for Quadrant A Data is divided into 100 sec bins |
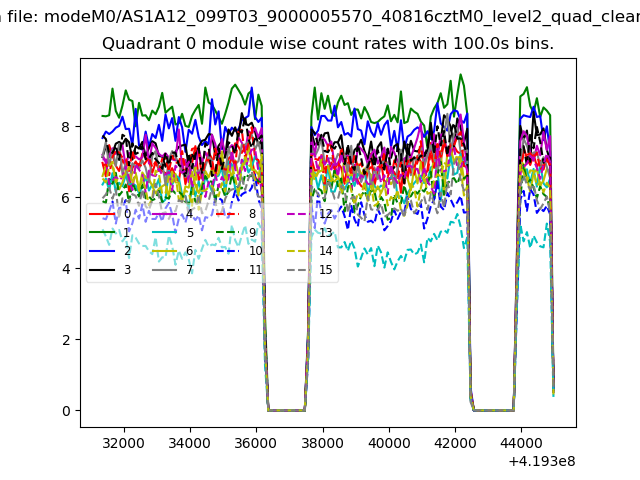 |
 |
| Module-wise count rates for Quadrant B Data is divided into 100 sec bins |
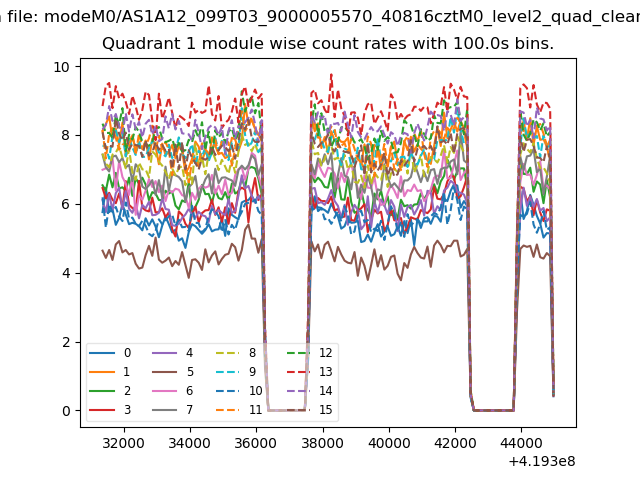 |
 |
| Module-wise count rates for Quadrant C Data is divided into 100 sec bins |
 |
 |
| Module-wise count rates for Quadrant D Data is divided into 100 sec bins |
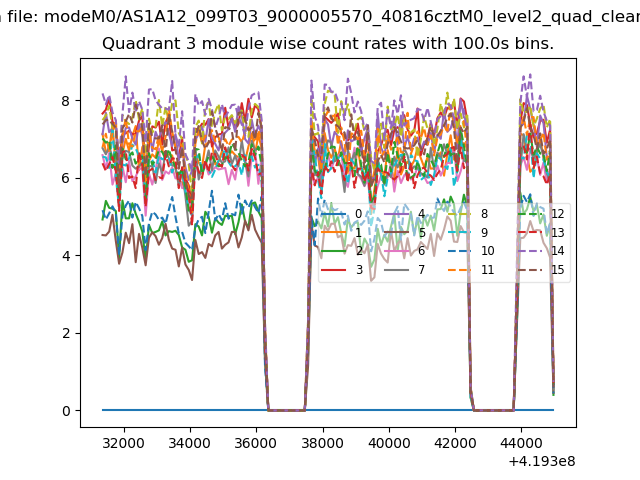 |
 |
| Parameter | Plot |
|---|---|
| CZT HV Monitor | 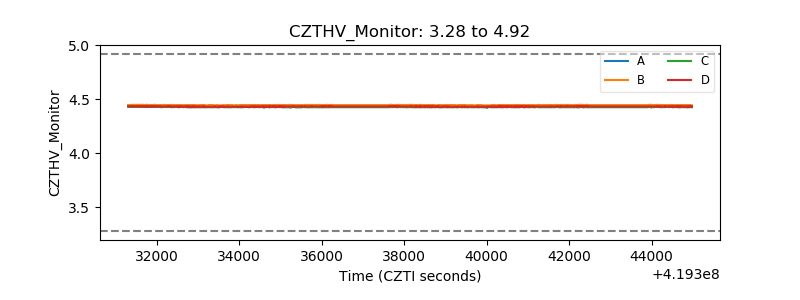 |
| D_VDD | 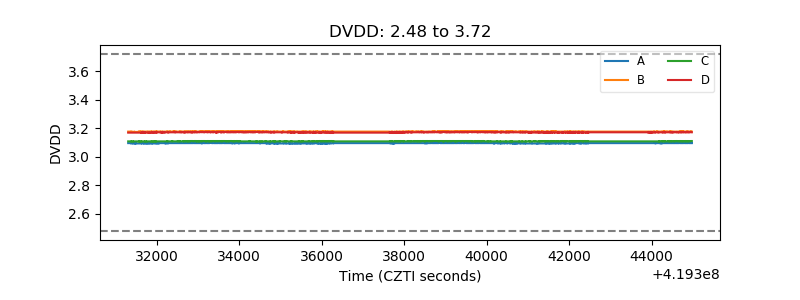 |
| Temperature 1 | 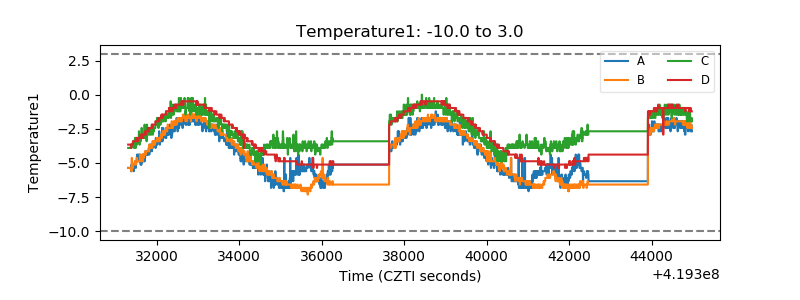 |
| Veto HV Monitor |  |
| Veto LLD | 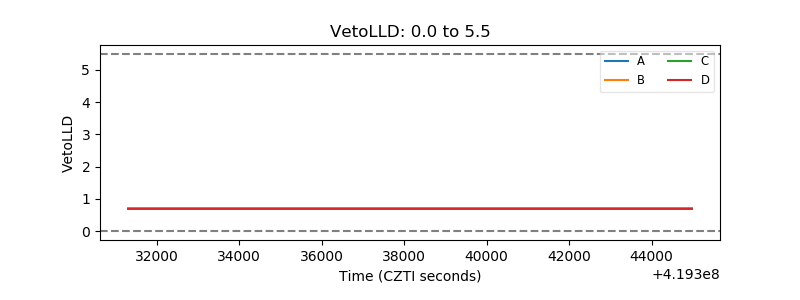 |
| Alpha Counter | 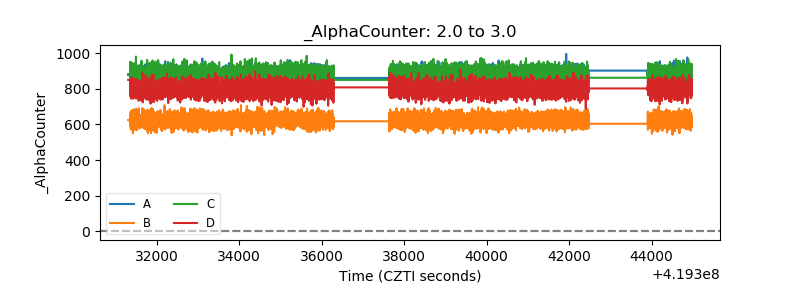 |
| _CPM_Rate | 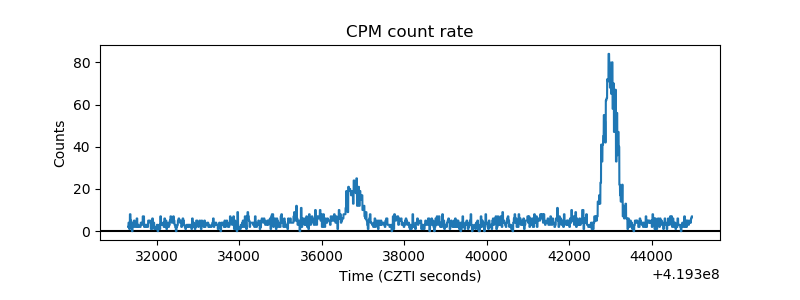 |
| CZT Counter | 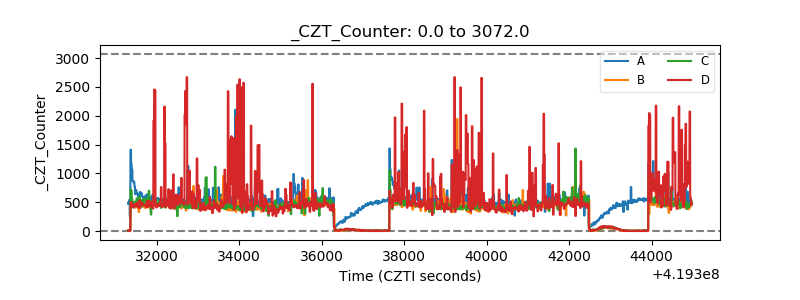 |
| +2.5 Volts monitor | 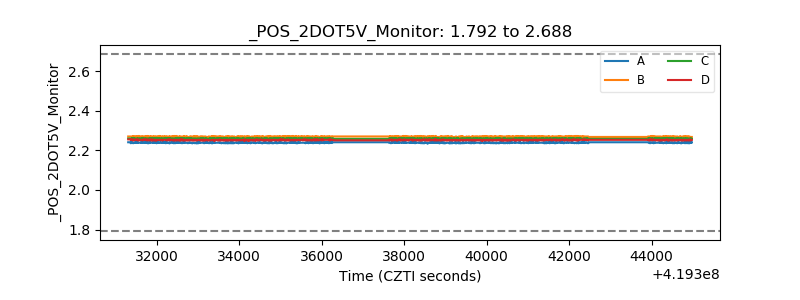 |
| +5 Volts monitor | 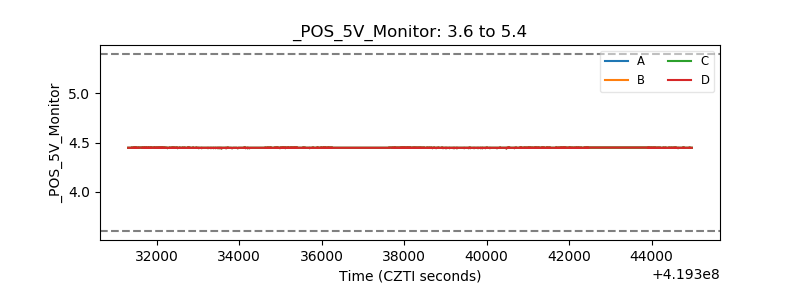 |
| _ROLL_ROT | 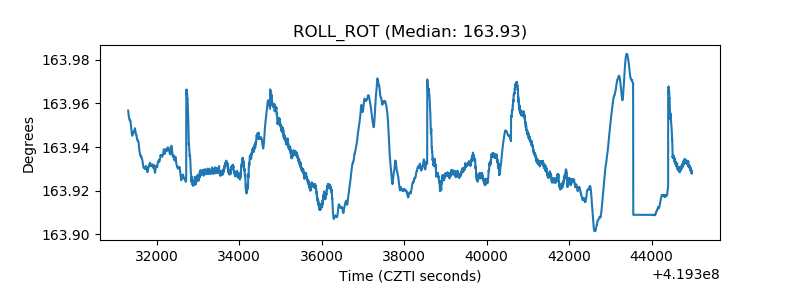 |
| _Roll_DEC | 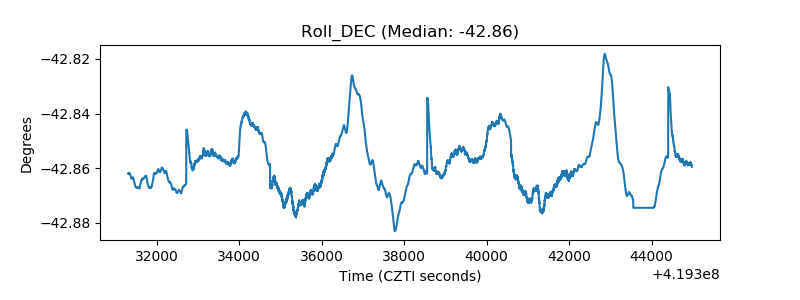 |
| _Roll_RA | 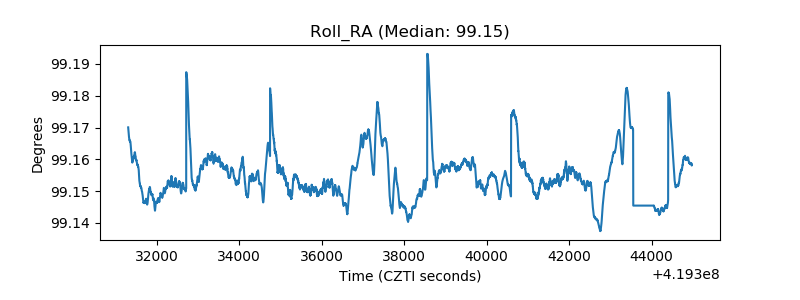 |
| Veto Counter | 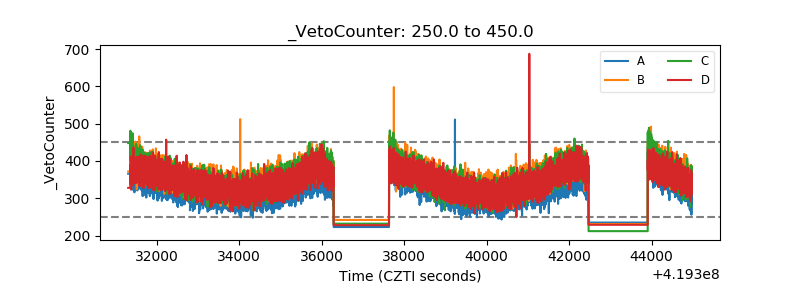 |