| Param | Original file | Final file |
|---|---|---|
| Filename | modeM0/AS1A12_099T03_9000005570_40817cztM0_level2.fits | modeM0/AS1A12_099T03_9000005570_40817cztM0_level2_quad_clean.evt |
| Size (bytes) | 360,895,680 | 92,606,400 |
| Size | 344.2 MB | 88.3 MB |
| Events in quadrant A | 3,169,293 | 617,815 |
| Events in quadrant B | 2,582,708 | 635,725 |
| Events in quadrant C | 2,721,086 | 601,210 |
| Events in quadrant D | 4,445,614 | 553,101 |
| Mode M0 | |||
|---|---|---|---|
| Quadrant | BADHDUFLAG | Total packets | Discarded packets |
| A | 0 | 12991 | 2 |
| B | 0 | 11605 | 1 |
| C | 0 | 11692 | 1 |
| D | 0 | 17162 | 1 |
| Mode SS | |||
|---|---|---|---|
| Quadrant | BADHDUFLAG | Total packets | Discarded packets |
| A | 0 | 116 | 0 |
| B | 0 | 116 | 0 |
| C | 0 | 116 | 0 |
| D | 0 | 116 | 0 |
| Mode M9 | |||
|---|---|---|---|
| Quadrant | BADHDUFLAG | Total packets | Discarded packets |
| A | 0 | 15 | 0 |
| B | 0 | 15 | 0 |
| C | 0 | 15 | 0 |
| D | 0 | 15 | 0 |
| Quadrant | Total seconds | Saturated seconds | Saturation percentage |
|---|---|---|---|
| A | 5662 | 13 | 0.229601% |
| B | 5662 | 18 | 0.317909% |
| C | 5662 | 25 | 0.441540% |
| D | 5662 | 119 | 2.101731% |
Noise dominated data is calculated using 1-second bins in cleaned event files. If a bin has >2000 counts, and if more than 50% of those come from <1% of pixels, then it is considered to be noise-dominated and hence unusable.
| Quadrant | # 1 sec bins | Bins with >0 counts | Bins with >2000 counts | High rate bins dominated by noise | Noise dominated (total time) | Noise dominated (detector-on time) | Marked lightcurve |
|---|---|---|---|---|---|---|---|
| A | 7214 | 5663 | 7 | 7 | 0.10% | 0.12% | 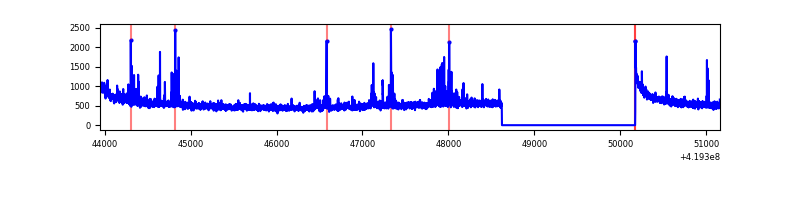 |
| B | 7214 | 5663 | 10 | 10 | 0.14% | 0.18% | 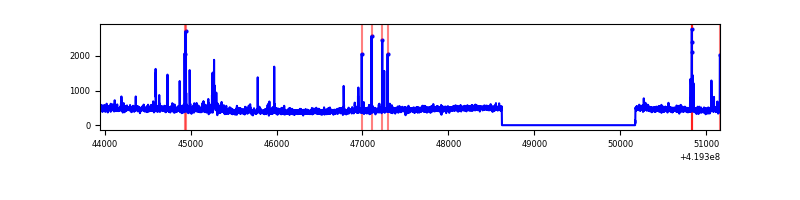 |
| C | 7214 | 5663 | 23 | 23 | 0.32% | 0.41% | 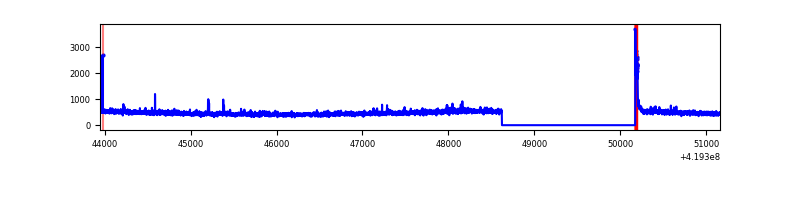 |
| D | 7214 | 5663 | 159 | 159 | 2.20% | 2.81% | 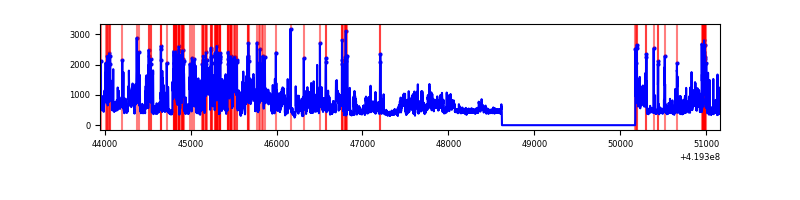 |
Top three noisy pixels from each quadrant. If the there are fewer than three noisy pixels in the level2.evt file, extra rows are filled as -1
| Pixel properties | Quadrant properties | ||||||
|---|---|---|---|---|---|---|---|
| Quadrant | DetID | PixID | Counts | Sigma | Mean | Median | Sigma |
| A | 10 | 83 | 531979 | 4124.49 | 623 | 610 | 128.8 |
| A | 13 | 248 | 97483 | 751.93 | 623 | 610 | 128.8 |
| A | 2 | 79 | 51501 | 395.02 | 623 | 610 | 128.8 |
| B | 0 | 190 | 95611 | 777.71 | 617 | 600 | 122.2 |
| B | 0 | 230 | 33074 | 265.81 | 617 | 600 | 122.2 |
| B | 15 | 85 | 21104 | 167.83 | 617 | 600 | 122.2 |
| C | 15 | 214 | 240796 | 1696.57 | 600 | 602 | 141.6 |
| C | 0 | 10 | 67653 | 473.6 | 600 | 602 | 141.6 |
| C | 15 | 159 | 46031 | 320.88 | 600 | 602 | 141.6 |
| D | 12 | 79 | 1614141 | 10890.14 | 599 | 582 | 148.2 |
| D | 12 | 233 | 183268 | 1232.97 | 599 | 582 | 148.2 |
| D | 2 | 249 | 172094 | 1157.56 | 599 | 582 | 148.2 |
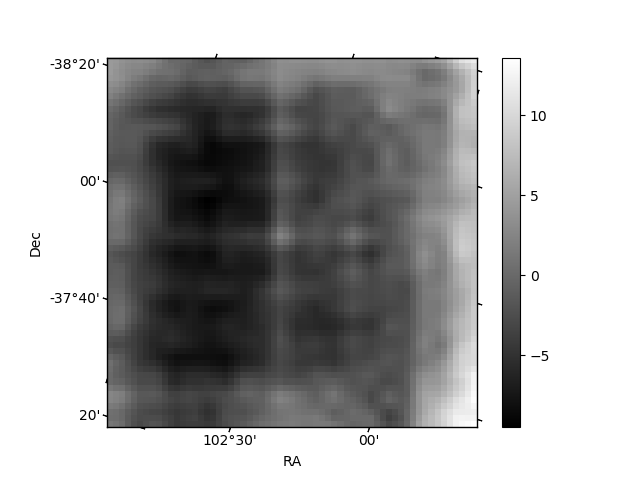
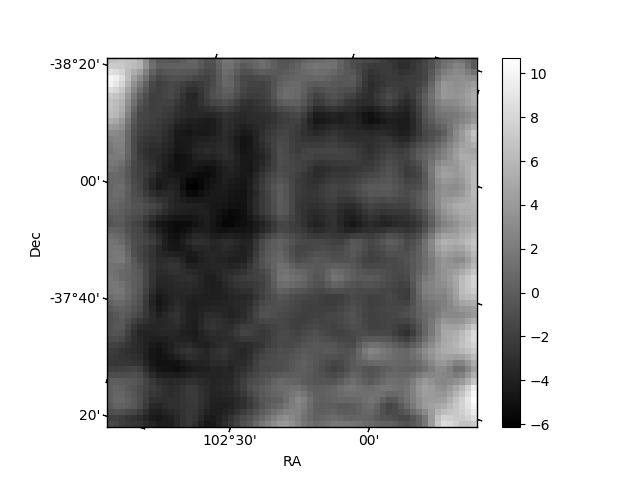
Histogram calculated using DETX and DETY for each event in the final _common_clean file
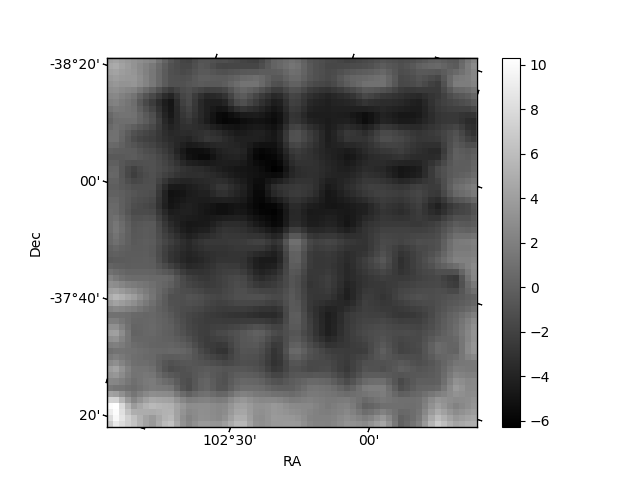
| Quadrant A |  |
 |
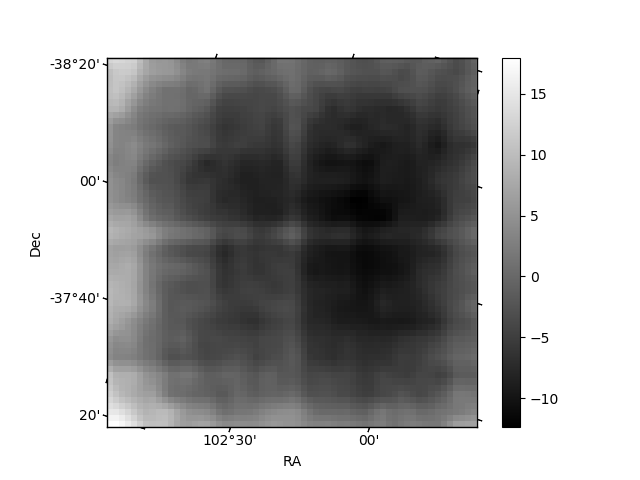
Quadrant B |
|---|---|---|---|
| Quadrant D |  |
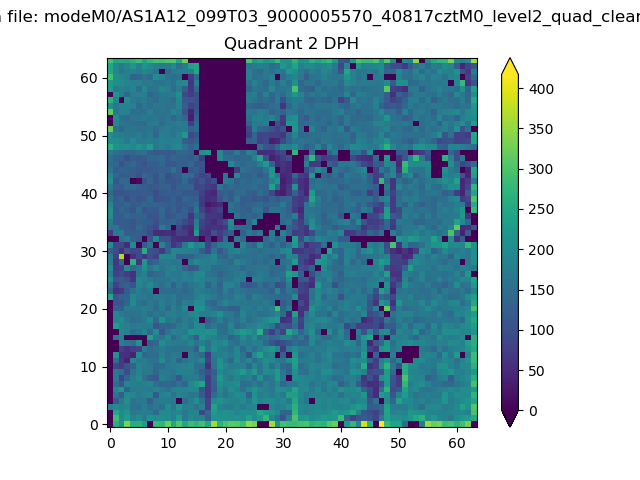 |
Quadrant C |
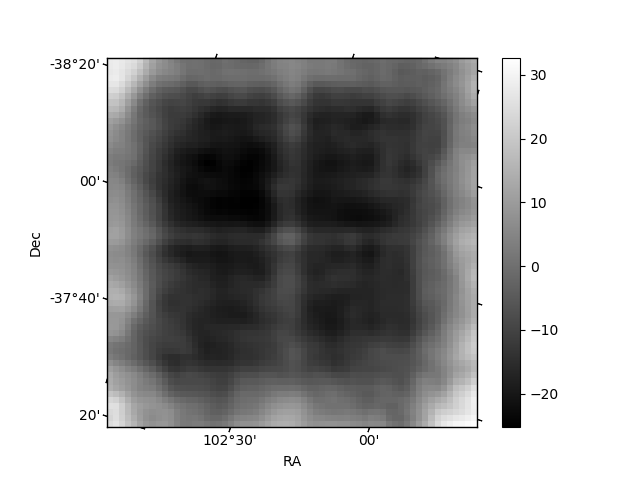
| Plot type | Count rate plots | Images |
|---|---|---|
| Comparison with Poisson distribution Blue bars denote a histogram of data divided into 1 sec bins. Red curve is a Poisson curve with rate = median count rate of data. |
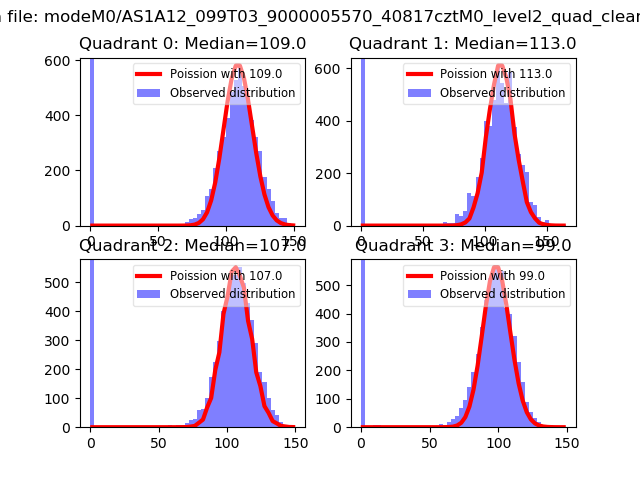 |
 |
| Quadrant-wise count rates Data is divided into 100 sec bins |
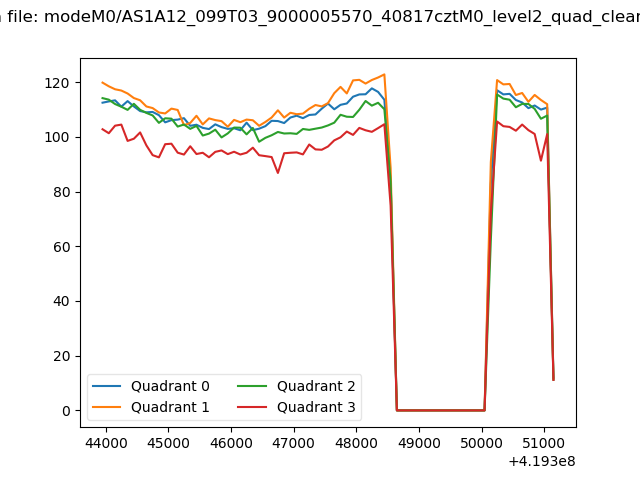 |
|
| Module-wise count rates for Quadrant A Data is divided into 100 sec bins |
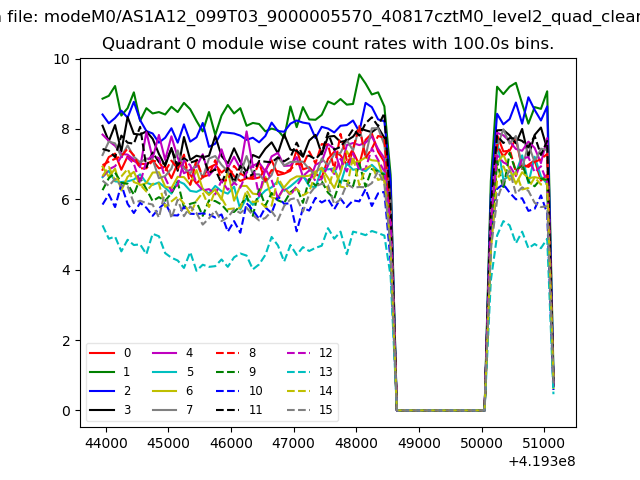 |
 |
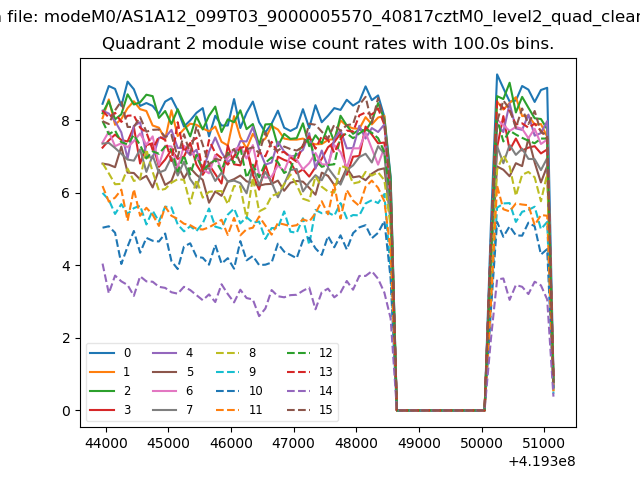
| Module-wise count rates for Quadrant B Data is divided into 100 sec bins |
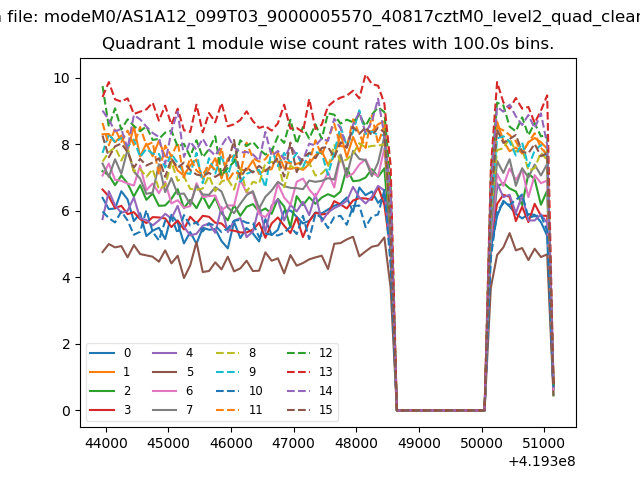 |
 |
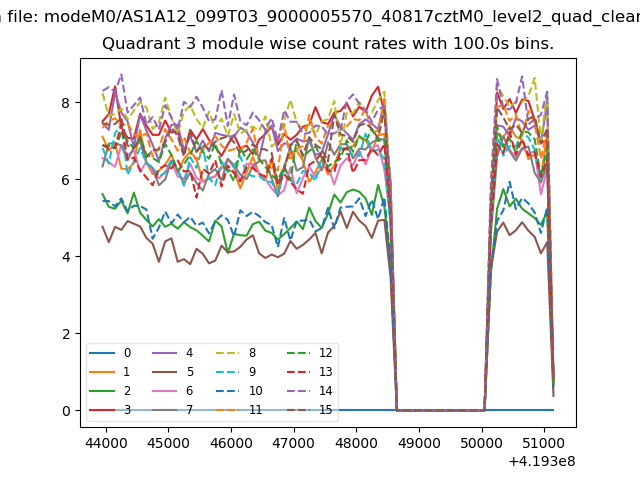
| Module-wise count rates for Quadrant C Data is divided into 100 sec bins |
 |
 |
| Module-wise count rates for Quadrant D Data is divided into 100 sec bins |
 |
 |
| Parameter | Plot |
|---|---|
| CZT HV Monitor | 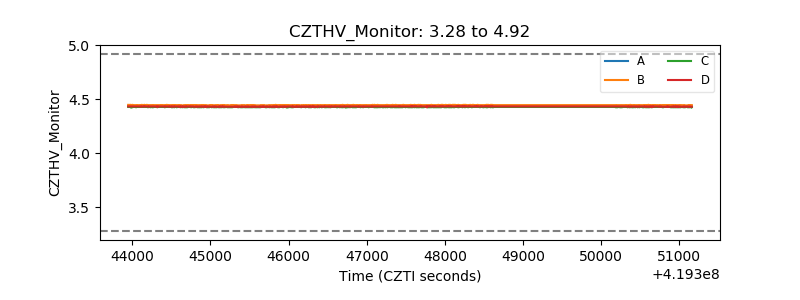 |
| D_VDD | 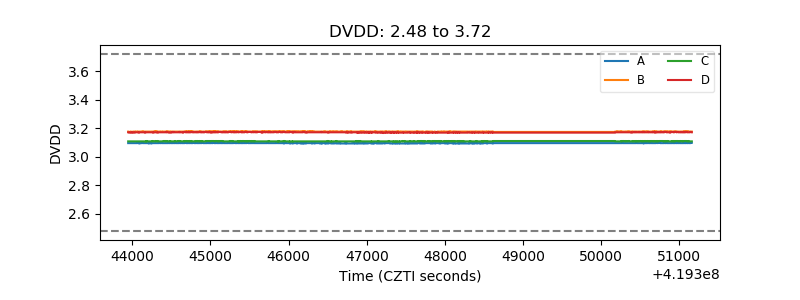 |
| Temperature 1 | 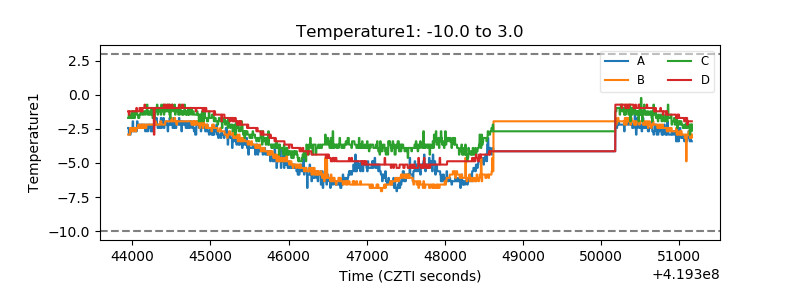 |
| Veto HV Monitor | 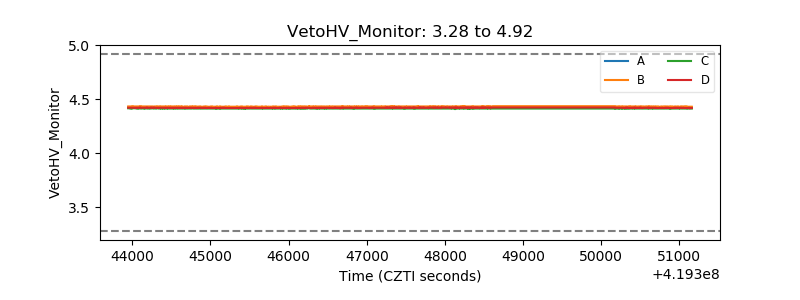 |
| Veto LLD | 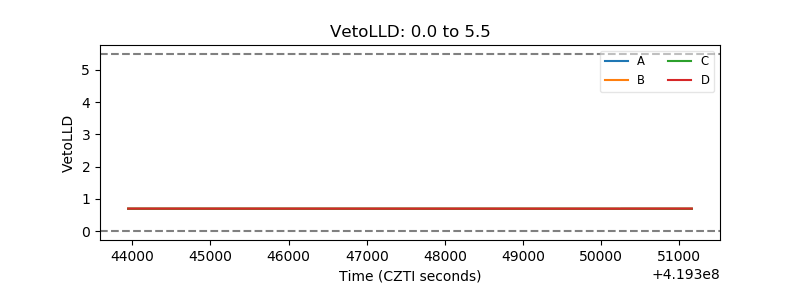 |
| Alpha Counter | 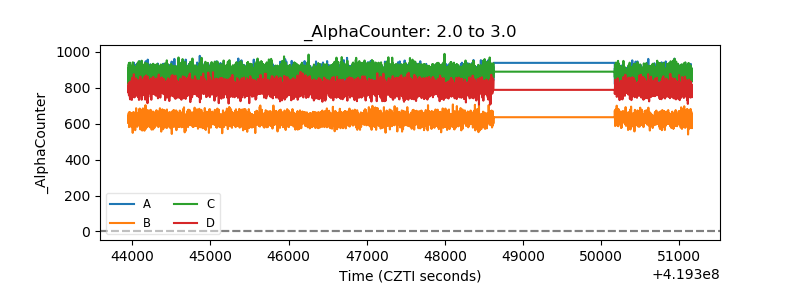 |
| _CPM_Rate | 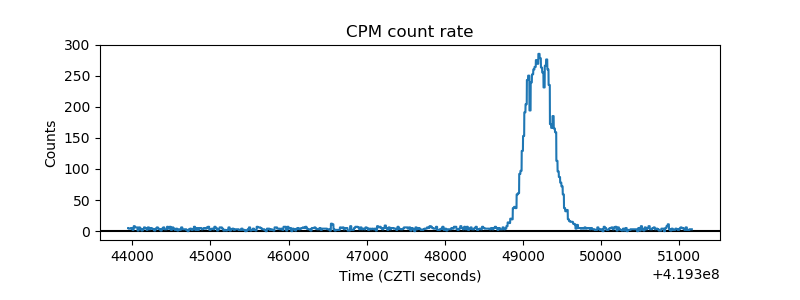 |
| CZT Counter | 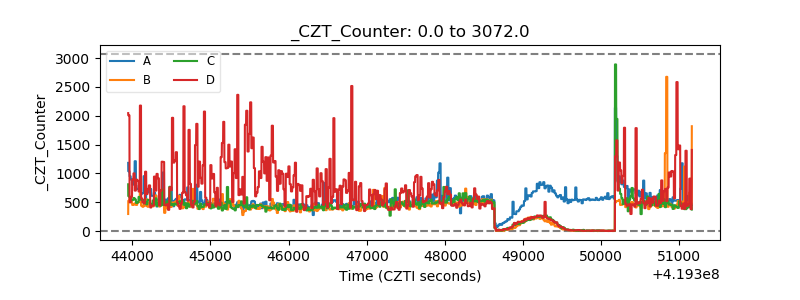 |
| +2.5 Volts monitor | 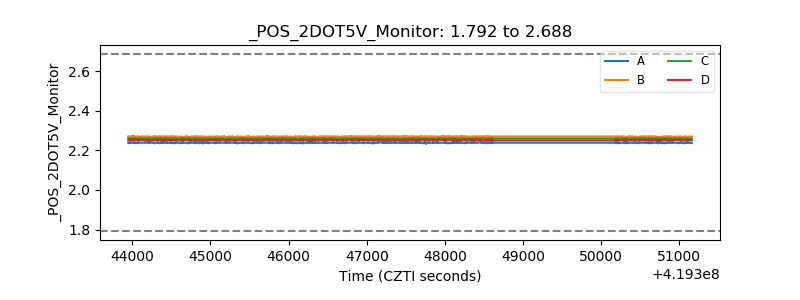 |
| +5 Volts monitor | 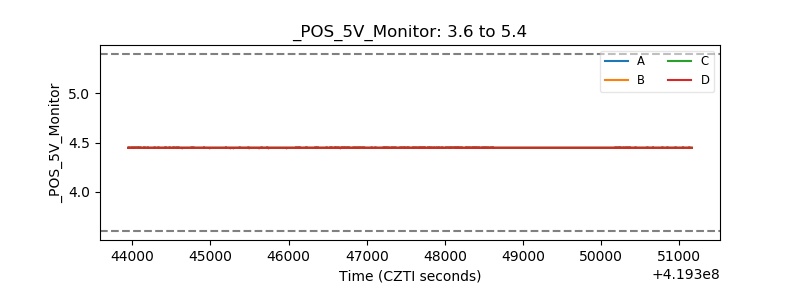 |
| _ROLL_ROT | 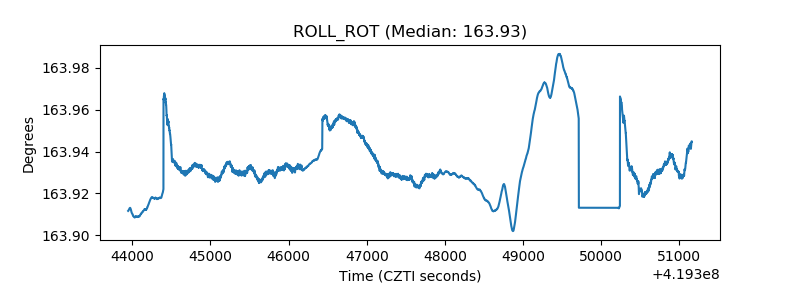 |
| _Roll_DEC | 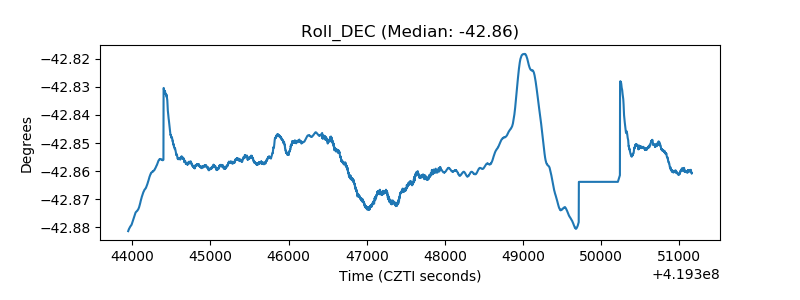 |
| _Roll_RA | 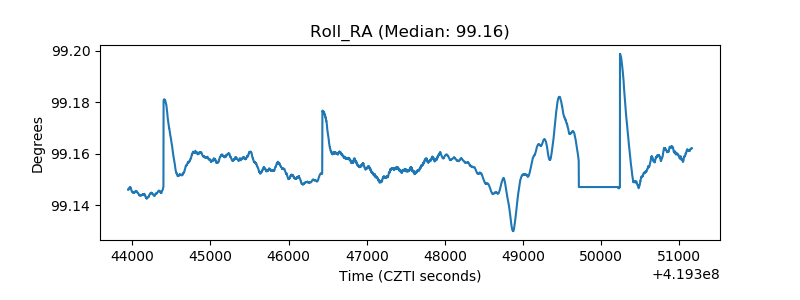 |
| Veto Counter | 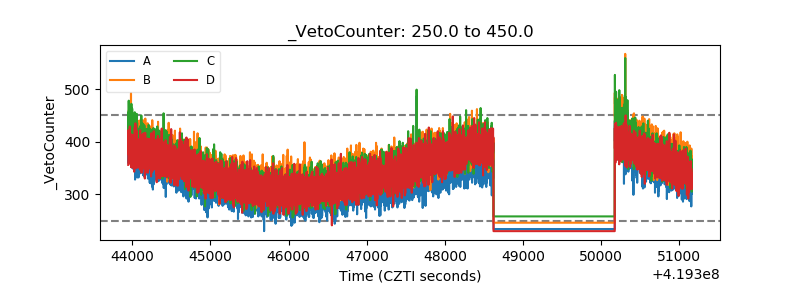 |