| Param | Original file | Final file |
|---|---|---|
| Filename | modeM0/AS1A12_099T03_9000005570_40818cztM0_level2.fits | modeM0/AS1A12_099T03_9000005570_40818cztM0_level2_quad_clean.evt |
| Size (bytes) | 343,990,080 | 86,964,480 |
| Size | 328.1 MB | 82.9 MB |
| Events in quadrant A | 2,965,981 | 584,531 |
| Events in quadrant B | 2,421,725 | 602,099 |
| Events in quadrant C | 2,512,532 | 568,408 |
| Events in quadrant D | 4,419,661 | 506,287 |
| Mode M0 | |||
|---|---|---|---|
| Quadrant | BADHDUFLAG | Total packets | Discarded packets |
| A | 0 | 12081 | 2 |
| B | 0 | 10941 | 1 |
| C | 0 | 10896 | 1 |
| D | 0 | 16826 | 1 |
| Mode SS | |||
|---|---|---|---|
| Quadrant | BADHDUFLAG | Total packets | Discarded packets |
| A | 0 | 108 | 0 |
| B | 0 | 108 | 0 |
| C | 0 | 108 | 0 |
| D | 0 | 108 | 0 |
| Mode M9 | |||
|---|---|---|---|
| Quadrant | BADHDUFLAG | Total packets | Discarded packets |
| A | 0 | 17 | 0 |
| B | 0 | 17 | 0 |
| C | 0 | 17 | 0 |
| D | 0 | 17 | 0 |
| Quadrant | Total seconds | Saturated seconds | Saturation percentage |
|---|---|---|---|
| A | 5309 | 18 | 0.339047% |
| B | 5309 | 27 | 0.508570% |
| C | 5309 | 9 | 0.169523% |
| D | 5309 | 324 | 6.102844% |
Noise dominated data is calculated using 1-second bins in cleaned event files. If a bin has >2000 counts, and if more than 50% of those come from <1% of pixels, then it is considered to be noise-dominated and hence unusable.
| Quadrant | # 1 sec bins | Bins with >0 counts | Bins with >2000 counts | High rate bins dominated by noise | Noise dominated (total time) | Noise dominated (detector-on time) | Marked lightcurve |
|---|---|---|---|---|---|---|---|
| A | 7012 | 5310 | 9 | 9 | 0.13% | 0.17% | 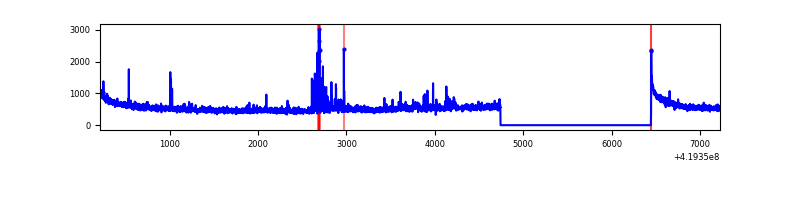 |
| B | 7012 | 5310 | 9 | 9 | 0.13% | 0.17% | 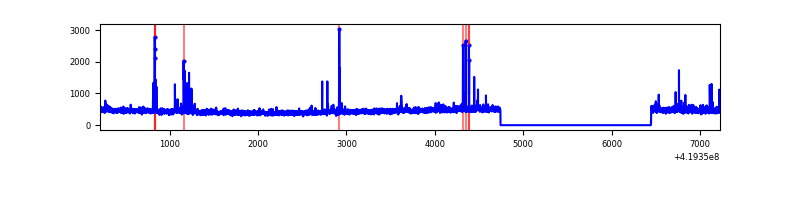 |
| C | 7012 | 5310 | 4 | 4 | 0.06% | 0.08% | 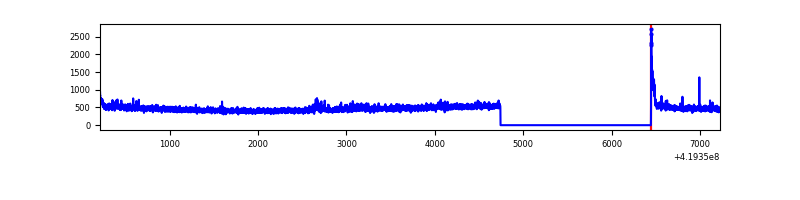 |
| D | 7012 | 5310 | 349 | 349 | 4.98% | 6.57% | 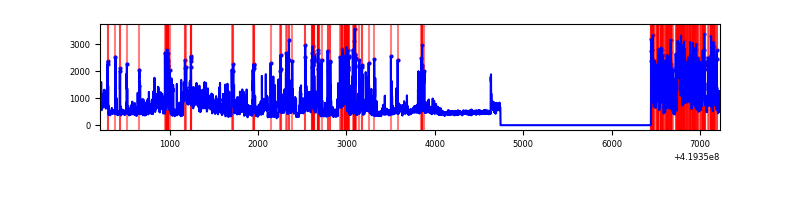 |
Top three noisy pixels from each quadrant. If the there are fewer than three noisy pixels in the level2.evt file, extra rows are filled as -1
| Pixel properties | Quadrant properties | ||||||
|---|---|---|---|---|---|---|---|
| Quadrant | DetID | PixID | Counts | Sigma | Mean | Median | Sigma |
| A | 10 | 83 | 496324 | 4115.3 | 582 | 570 | 120.5 |
| A | 13 | 248 | 88089 | 726.5 | 582 | 570 | 120.5 |
| A | 12 | 189 | 45067 | 369.37 | 582 | 570 | 120.5 |
| B | 0 | 190 | 106070 | 925.61 | 579 | 563 | 114.0 |
| B | 15 | 85 | 32396 | 279.27 | 579 | 563 | 114.0 |
| B | 12 | 111 | 14122 | 118.95 | 579 | 563 | 114.0 |
| C | 15 | 214 | 226872 | 1736.77 | 562 | 566 | 130.3 |
| C | 0 | 10 | 46686 | 353.95 | 562 | 566 | 130.3 |
| C | 15 | 159 | 33839 | 255.35 | 562 | 566 | 130.3 |
| D | 12 | 79 | 949537 | 6929.02 | 549 | 532 | 137.0 |
| D | 1 | 47 | 487586 | 3556.15 | 549 | 532 | 137.0 |
| D | 2 | 249 | 344279 | 2509.82 | 549 | 532 | 137.0 |
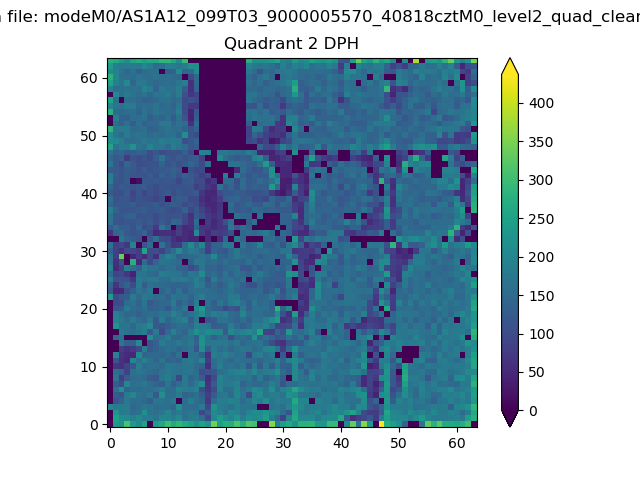
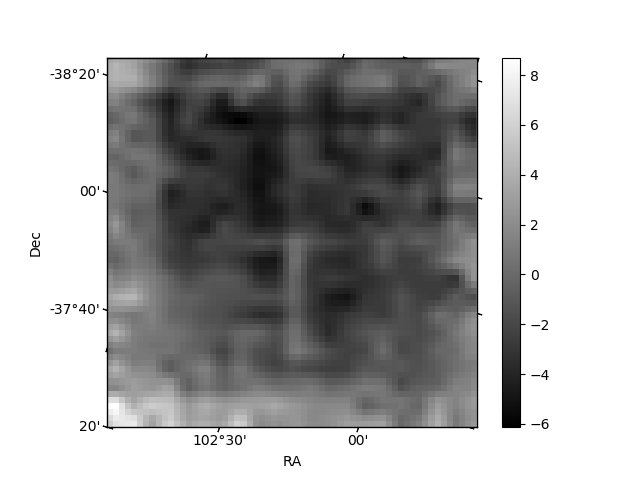
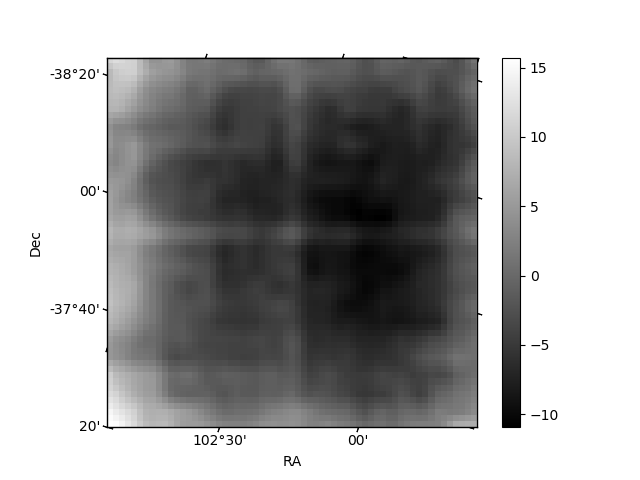
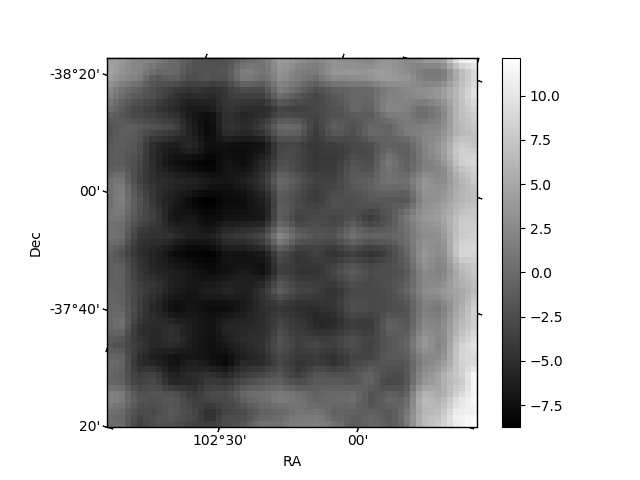
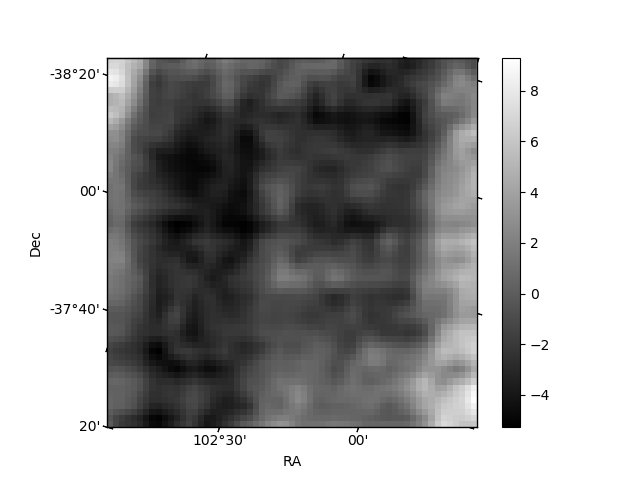
Histogram calculated using DETX and DETY for each event in the final _common_clean file
| Quadrant A | 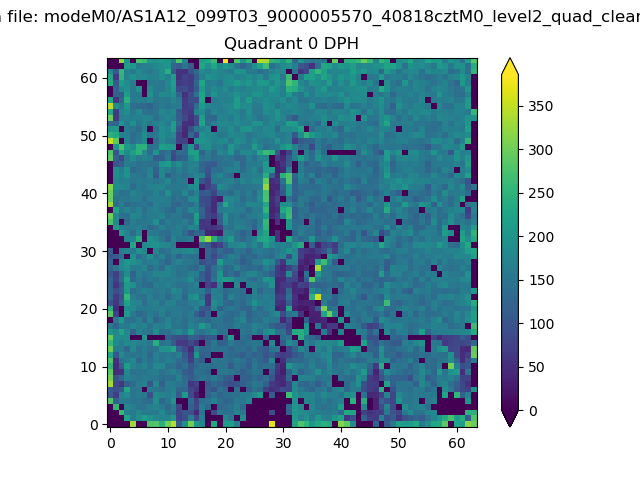 |
 |
Quadrant B |
|---|---|---|---|
| Quadrant D |  |
 |
Quadrant C |
| Plot type | Count rate plots | Images |
|---|---|---|
| Comparison with Poisson distribution Blue bars denote a histogram of data divided into 1 sec bins. Red curve is a Poisson curve with rate = median count rate of data. |
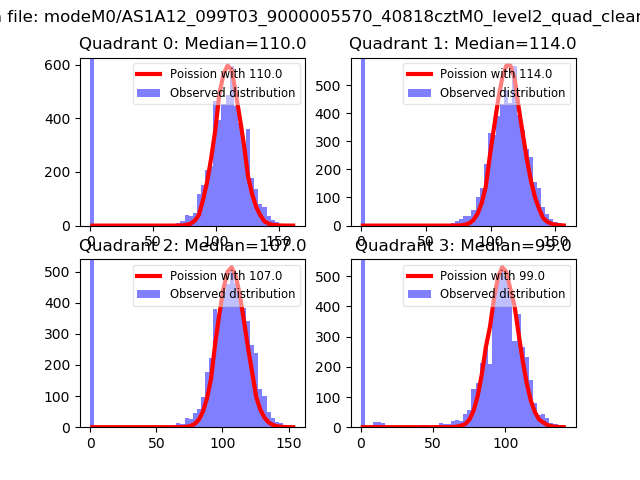 |
 |
| Quadrant-wise count rates Data is divided into 100 sec bins |
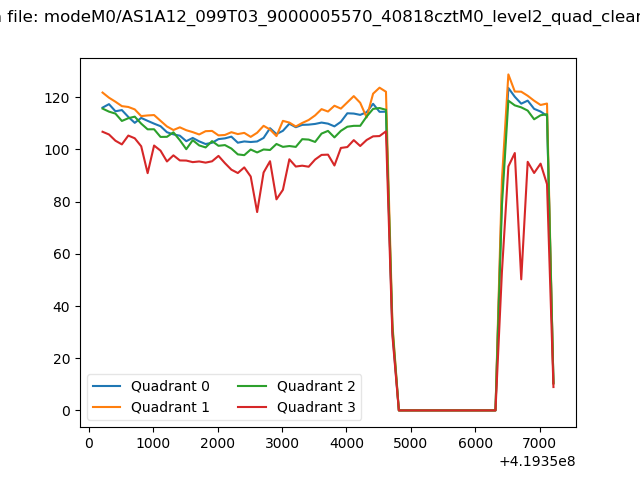 |
|
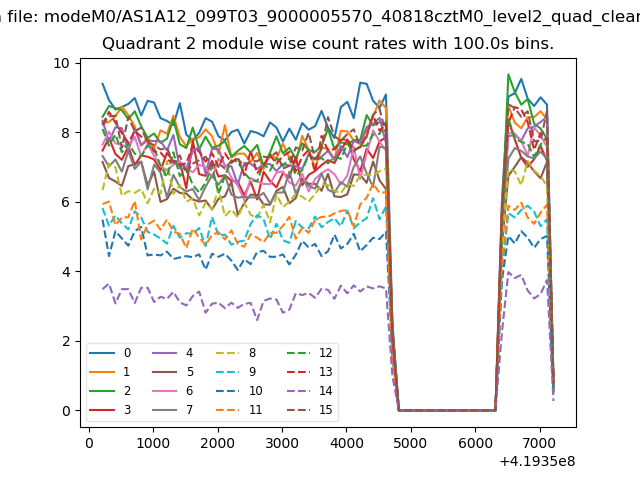
| Module-wise count rates for Quadrant A Data is divided into 100 sec bins |
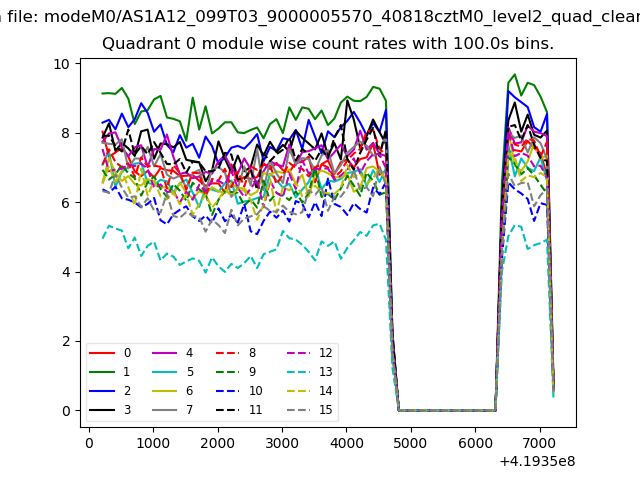 |
 |
| Module-wise count rates for Quadrant B Data is divided into 100 sec bins |
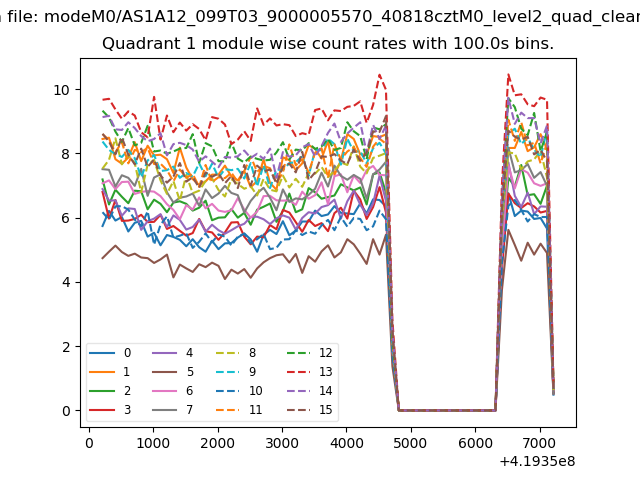 |
 |
| Module-wise count rates for Quadrant C Data is divided into 100 sec bins |
 |
 |
| Module-wise count rates for Quadrant D Data is divided into 100 sec bins |
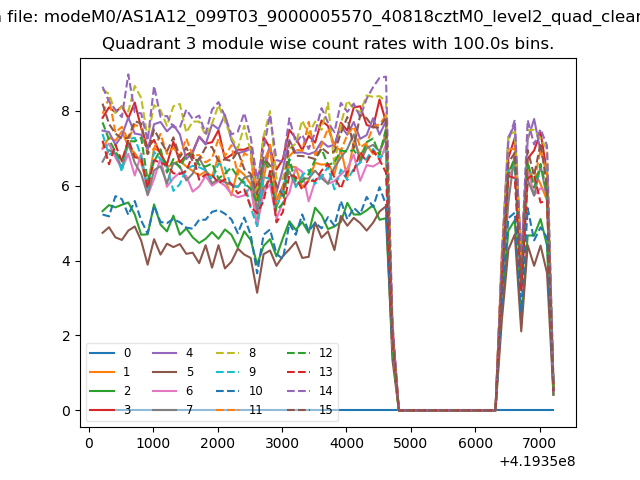 |
 |
| Parameter | Plot |
|---|---|
| CZT HV Monitor | 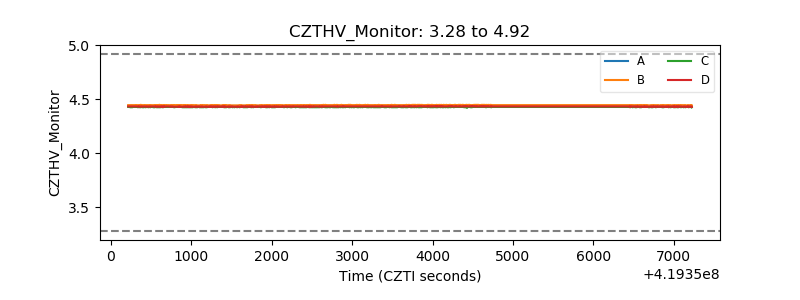 |
| D_VDD | 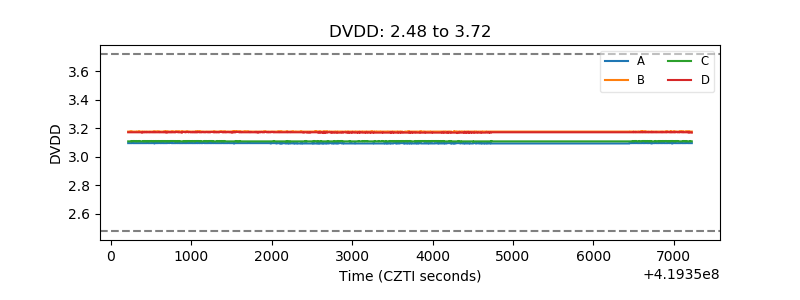 |
| Temperature 1 | 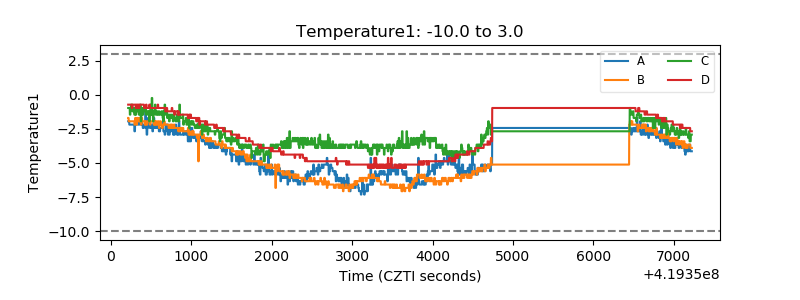 |
| Veto HV Monitor |  |
| Veto LLD | 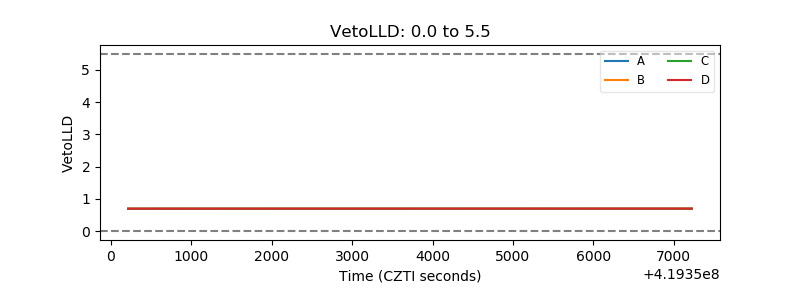 |
| Alpha Counter | 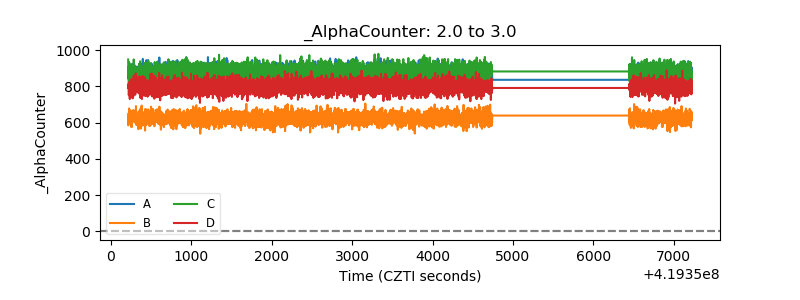 |
| _CPM_Rate | 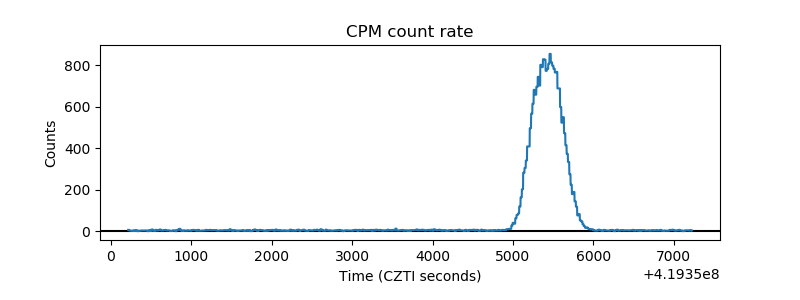 |
| CZT Counter | 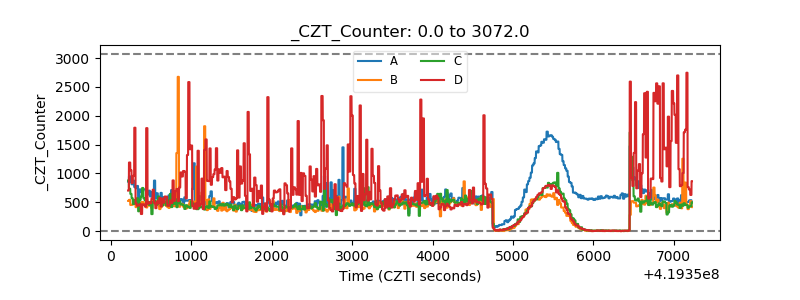 |
| +2.5 Volts monitor | 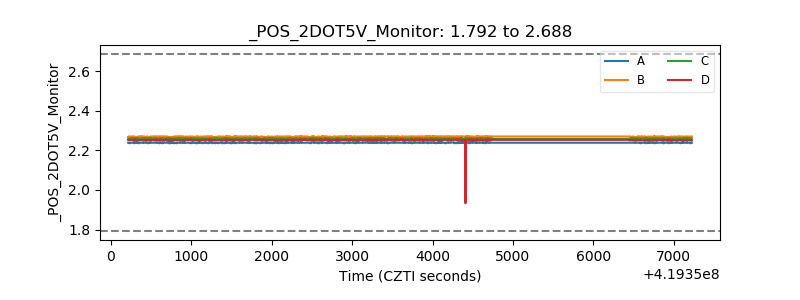 |
| +5 Volts monitor | 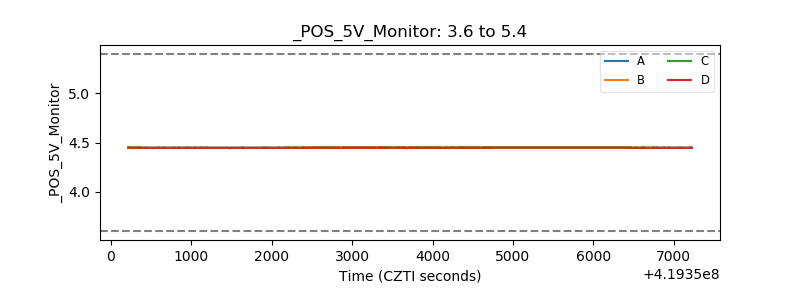 |
| _ROLL_ROT | 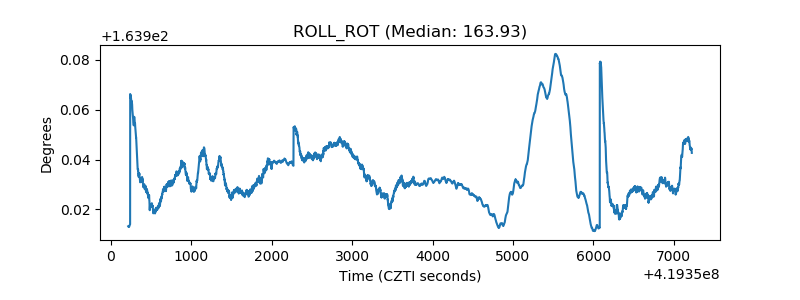 |
| _Roll_DEC | 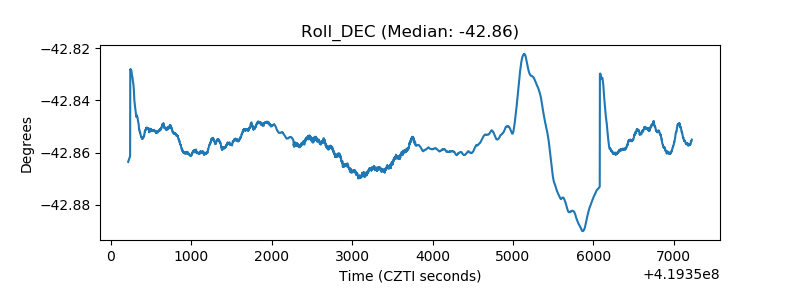 |
| _Roll_RA | 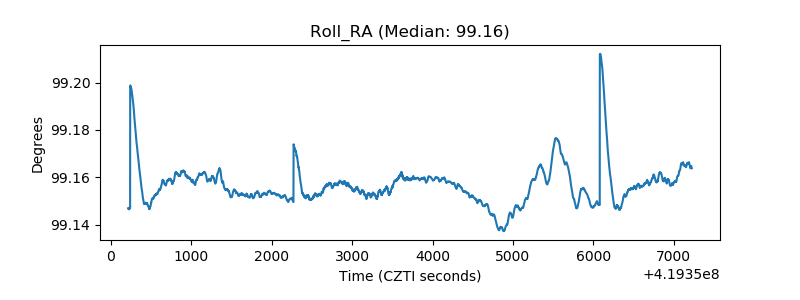 |
| Veto Counter | 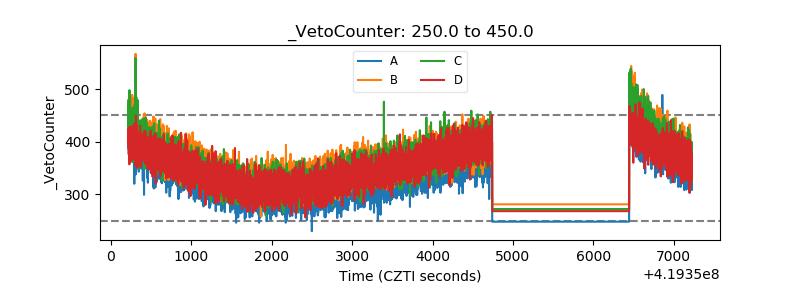 |